INTRODUCTION
It was predicted that by the end of 2019, 463 million people would have diabetes worldwide. By 2030, this number is assumed to rise to 578 million globally. By 2045, this number is projected to increase once more, this time to 700 million. Those in urban regions and citizens of high-income countries are at greater risk. Approximately half of those who have diabetes are unaware of their disorder. The number of persons with diminished glucose tolerance is expected to increase from its current 374 million in 2019 to 454 million in 2030 and 548 million in 2045, as per current projections (Saeedi et al., 2019). Several studies have been conducted to find anti-diabetic drugs that are more successful at controlling glucose levels while also having less negative side effects. Inhibitors of sodium-glucose cotransporter-2 (SGLT-2) have recently been sanctioned for usage in the management of type 2 diabetes either on its own or in addition to other diabetic treatments (Kalra, 2014). Dapagliflozin (DPZ) bearing the chemical name (2S,3R,4R,5S,6R)-2-[4-chloro-3-[(4-ethoxyphenyl)methyl]phenyl]-6-(hydroxymethyl)-oxane-3,4,5-triol has been categorised as SGLT2 inhibitor. The ability of kidney to reabsorb glucose is mostly dependent on a transporter called SGLT2. Often used in conjunction with other drugs, it can be helpful in controlling type 2 diabetes mellitus if combined with a healthy food intake and regular workout (Donepudi and Achanta, 2019; Gundala et al., 2019). Vildagliptin (VGT) chemically identified as (S)-1-[N-(3-hydroxy-1-adamantyl) glycyl] pyrrolidine-2-carbonitrile which is an antihyperglycemic agent acts by inhibition of the dipeptidyl peptidase-4 enzyme selectively. Incretin hormones like glucagon-like peptide-1 and glucose-reliant insulinotropic polypeptide are protected from breakdown by this mechanism. Glycated hemoglobin and fasting plasma glucose concentrations go down and alpha and beta-cell activity in the pancreas improves as a result of this. In patients with poor glycemic control following monotherapy, VGT is authorized in the European Union and internationally for the management of type 2 diabetes mellitus in conjunction with metformin, a sulfonylurea, a thiazolidinedione, or an SGLT2 inhibitor. Figure 1 provides the chemical structures of both the analytes (Boovizhikannan and Palanirajan, 2013; Donepudi and Achanta, 2019; Gundala et al., 2019).
Diabetic individuals typically require a combination of drugs to control their blood sugar levels (Sen et al., 2022). In late 2022, the newer combination comprising of DPZ and VGT was made available in the Indian market. Fixed dose combination consisting of DPZ (10 mg) and VGT (100 mg) formulated as tablets (sustained release that aids people with keeping blood sugar levels in check when suffering from type 2 diabetes) (Joshi et al., 2022; Orme et al., 2014; Sen et al., 2022; 1mg.com, 2023). Ultraviolet (UV) spectrophotometry (Attimarad et al., 2023; Banik et al., 2015; Manasa et al., 2014; Mante et al., 2017; Sen et al., 2023), high-performance liquid chromatography (Deepan and Dhanaraju, 2018; Gundala et al., 2019; Mante et al., 2018; Usman et al., 2020; Vankalapati et al., 2022), and high-performance thin layer chromatography (Abdelrahman et al., 2020; Ahmed et al., 2020; Bendale et al., 2018; Patil et al., 2020; Suma et al., 2019) were only some of the analytical methods described in the literature for determining DPZ and VGT concentrations in single and mixed dosage forms.
Out of all the reported methods, only Attimarad et al. (2023) detailed the determination of DPZ and VGT in mixed formulation simultaneously by three different UV spectroscopic methods, namely ratio difference spectroscopic method (RSM), derivative ratio spectroscopic technique (DRS) and constant ratio substation coupled with multiplication with divisor spectrum method (CSM). Whereas, the proposed study describes five different alternative UV spectroscopic methods namely simultaneous equation method (SEM), absorbance ratio method (ARM), second derivative zero crossing method (2DR), ratio difference method (RDM), and the first derivative of ratio spectra method (FDR). Proposed methods were compared with reported methods in terms of their name of methods, range, the limit of detection (LOD), limit of quantification (LOQ), specificity, solvents used, and application. Results of the comparison suggest that the proposed methods are quite similar in terms of various outcomes. However, the proposed methods stand out against the reported methods in terms of range, sensitivity, and solvent used. Furthermore, the reported approaches (Attimarad et al., 2023) have certain shortcomings, such as the absence of validation results for DPZ in the CSM method (Table 4). Additionally, there are instances where the method name does not correspond accurately in certain places. All of the presented methods have been validated in line with International Conference on Harmonization (ICH) standards and they each have their own set of advantages, including a broad concentration range, great sensitivity, and a low barrier in terms of reference and sample preparation. For routine drug quality assessments, UV-spectroscopic methods are regarded as simple, fast, and cost-effective analytical processes. The main disadvantage of direct UV spectroscopic techniques is the influence of multicomponent formulations and formulation additives. As a result, several methods were developed to counteract these effects, including SEM, ARM, 2DR, RDM, and FDR, all of which were validated as suitable for the simultaneous assessment of DPZ and VGT with no interference (Attimarad et al., 2012). However, the main limitation of UV-visible spectroscopy is that it can only be used to measure solutions and it cannot be used to measure solid or gaseous samples.
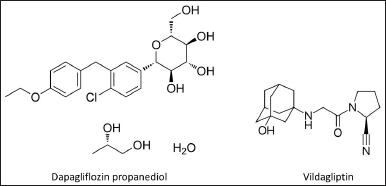 | Figure 1. Chemical constructions of DPZ propanediol and VGT. [Click here to view] |
MATERIALS AND METHODOLOGIES
Chemicals and reagents
Dalton PharmaChem, located in Vadodara, Gujarat, India, generously supplied us with a gift sample of DPZ (98.8% w/w) and VGT (99.25% w/w) as our reference standard throughout the course of our study. Loba Chemie Pvt. Ltd., Mumbai, India supplied all other solvents, chemicals, and excipients (specificity) made used in this research.
Instruments
For the experiment, a Shimadzu UV visible spectrophotometer (double beam) with a paired quartz cell having a 1 cm path length (UV-1800, UV Probe, Shimadzu Corporation, Kyoto Japan) was utilized. Weighing was carried out using the Ohaus Corporation’s Adventurer Pro AVG264C electronic balance.
Preparation of standard solution
Both DPZ (10 mg) and VGT (10 mg) were weighed carefully and shifted to separate 10 ml volumetric flasks for stock solution preparation. Water was used to dilute standard medicines to 10 ml to attain a solution strength of 1,000 µg/ml. To achieve the desired concentration, further dilutions in water was performed.
Reference stock solutions of DPZ and VGT mixture
In a sequence of 10 volumetric flasks, DPZ and VGT standard solutions were blended to produce mixture of desired concentrations, and the capacity was brought up to the level with water. With water, additional diution was carried out in order to acquire the necessary concentration.
Preparation of sample solution
Marketed formulations (ENCELIN D 10, Torrent Pharmaceuticals Ltd., India) were broken into powder and weighed out to be equivalent amounts (DPZ: 5 mg; VGT: 50 mg) before being added to a 100 ml standard bottle. Further, 50 ml of water was poured into a 100 ml standard flask, stirred for 10 minutes, and then added to bring the total volume to 100 ml before passing across Whatman filter paper no. 41. After that, 1 ml of the resulting liquid was transferred to a 10 ml reference bottle, and the remaining space was loaded with the same solvent to the appropriate strength (DPZ: 5 µg/ml; VGT: 50 µg/ml).
Methodology
Simultaneous equation method
The simultaneous equation method was applied to evaluate DPZ and VGT in the tablet formulation. The UV spectra of the reference analytes were recorded between 200 and 400 nm. In order to determine the proposed analytes in the tablet formulation, the overlapping UV spectra were used to determine the optimal wavelength for analysis. Substantial absorbance was seen at 223 and 210 nm in the overlaid zero-order spectra of DPZ and VGT, correspondingly (Fig. 2). The analyte absorptivity was then determined and tabulated (Table 1). The below-mentioned formula [(1) and (2)] was used to determine the exact amount of medication in each tablet.
………………………(1)
………………………(2)
Cx and Cy represent the amounts of DPZ and VGT found in the sample solutions, respectively, in the aforementioned equation.
The absorbances of the test solution at 223 nm is A1 and at 210 nm is A2. Absorptivity of DPZ at 223 and 210 nm are denoted by ax1 and ax2, correspondingly. The absorptivity of VGT is denoted by ay1, and that at 210 nm by ay2 (Beckett and Stenlake, 2005; Puranik et al., 2006; Sen et al., 2016a, 2016b).
Absorbance ratio method
Excellent linearity was found between the wavelengths of 219.2 nm (the isosbestic point) and 223 nm (the λmax of DPZ), hence these two wavelengths were chosen for simultaneous determination using the AR method. The formulas [(3) and (4)] below were used to determine the concentrations of DPZ and VGT in the test solution using ARM.
………………………(3)
………………………(4)
ax1 and ax2 stand for the DPZ absorptivities at 223 and 219.2 nm, respectively. As opposed to this, VGT has absorptivities of ay1 and ay2 at 223 and 219.2 nm, respectively (Table 1). Absorbances A1 and A2 were measured at 223 and 219.2 nm, respectively, for the sample solution. Both DPZ and VGT were found in the sample solution at detectable quantities represented by Cx and Cy, respectively (Beckett and Stenlake, 2005; Puranik et al., 2006; Sen et al., 2016a, 2016b).
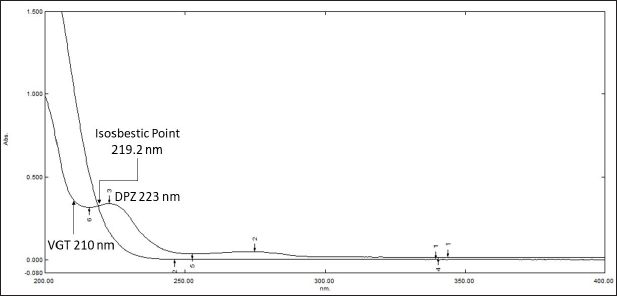 | Figure 2. Overlapping UV spectra of DPZ (7.5 µg/ml) and VGT (75 µg/ml). [Click here to view] |
 | Table 1. Mean absorptivity values of DPZ and VGT at different wavelengths for SEM & ARM. [Click here to view] |
Second derivative zero-crossing method
Recorded UV responses of both DPZ and VGT were manipulated into their respective second derivative spectra so that they could be evaluated using the second derivative (Zero Crossing) method. Subsequently, an 8 nm wavelength interval (Δλ) and a scaling factor of 100 were used to trace the zero crossing points of DPZ and VGT, respectively, at 219.2 and 290.6 nm. Estimation was performed at 290.6 and 219.2 nm for DPZ and VGT, respectively, using their traced zero crossing points (Table 2). Using the amplitudes of the second derivative spectra and the concentration of the analytes, a further linear curve was built. The results were put through a regression analysis, with slope, intercept, and correlation coefficient values determined by the method of least squares (Puranik et al., 2006; Sen et al., 2016a, 2016b).
Ratio difference spectroscopic method
In the RDM, the ratio spectra of DPZ and VGT were acquired by dividing the absorption spectra of the combination (DPZ, 0.5–10 µg/ml, and VGT, 5–100 µg/ml) by those of VGT, 150 µg/ml, and DPZ, 15 µg/ml, separately. Ratio spectra were then obtained. The concentration-amplitude difference of ratio spectra at 236 and 242 nm was used to construct a calibration curve for DPZ, whereas the concentration-amplitude difference of ratio spectra at 208.4 and 215 nm was used to construct a calibration curve for VGT (Attimarad et al., 2019; Darwish et al., 2016; Lofty et al., 2013; Zaazaa et al., 2015).
First derivative of ratio spectra method
In the FDR approach, the ratio spectra of DPZ and VGT were acquired by dividing the absorption spectra of the mixture (DPZ 1–15 µg/ml and VGT 10–150 µg/ml) by those of the pure compounds (VGT 150 µg/ml and DPZ 15 µg/ml). Afterward, ratio spectra of the first derivatives were recorded. The quantity of DPZ was assessed using the first derivative signal at 226 nm. A similar method was used for VGT at 215.6 nm. After plotting the amplitudes of the first derivative signals versus their concentrations, regression equations were obtained (Attimarad et al., 2019; Darwish et al., 2016; Erk, 2001; Nakhla et al., 2021).
Analysis of sample solution
The procedure for making the sample solution and diluting it was described in the preceding section. Analyte concentrations were determined using standard absorptivity (Table 1) and the absorbances of test liquids at those wavelengths to solve the corresponding equations for SEM and ARM. Whereas peak amplitude was measured and analytes were quantified with unique regression equations in 2DR, RDM, and FDR approach.
 | Table 2. Zero-crossing points and detection wavelengths for 2DR method. [Click here to view] |
Validation of spectroscopic methods
The established methodologies were endorsed as given in the recommendations of the ICH and several reported methods (Attimarad et al., 2019; Darwish et al., 2016; Erk, 2001; ICH, 2005; Lofty et al., 2013; Sen et al., 2023, 2022, 2016a).
Specificity
A specificity study was performed to examine the interaction between tablet formulation excipients and drug ingredients. All the commonly used excipients (European Medicines Agency, 2017; European Medicines Agency, 2012) like lactose (75 mg), microcrystalline cellulose (100 mg), sodium starch glycolate (10 mg), and magnesium stearate (5 mg) were mixed ratio wise (tablet weight was considered approximately 300 mg), diluted with water and passed through a Whatman filter paper no 41. Later, scanning of placebo and reference liquids was performed and analyzed in the UV region to determine the interference amongst formulation additives and medicines.
Linearity and range
Analysis of all the standard solutions consisting of DPZ and VGT in water was performed separately, for assessing the linearity and range of all five approaches. For SEM, absorbance was gauged at 223 and 210 nm, whereas the ARM used 223 and 219.2 nm for DPZ and VGT, respectively. For 2DR, the amplitude was measured at 290.6 and 219.2 nm for DPZ and VGT, sequentially. Differences in amplitude were measured at 236 and 242 nm for DPZ, 208.4 and 215 nm for VGT in RDM. However, in the FDR method, 226 and 215.6 nm were utilized for DPZ and VGT, respectively. Using absorbance versus concentration in SEM and ARM approach, amplitude difference versus concentration in RDM, the amplitude of second derivative spectra against concentration in 2DR, and amplitude versus concentration in FDR method, calibration graphs were created. Using the least-squares method, the slope, intercept, and correlation coefficient for DPZ and VGT at their respective wavelengths were calculated for regression equation.
Precision
Repeatability, intra-day and inter-day precision were measured and represented as percentage RSD for the acquired data so as to evaluate the precision of the procedures. Repeatability of measurement was performed at 5 and 50 µg/ml for DPZ and VGT, respectively six times for both the medicines and computing the percent RSD of the outcomes. Inside the linearity range, intra and inter-day precision experiments were conducted at 5 and 50 µg/ml for DPZ and VGT, respectively in triplicate on the same day and on three dissimilar days, correspondingly, and the % RSD of outcomes were estimated.
Accuracy
Recovery analysis was accomplished by means of the conventional standard addition procedure to crosscheck the viability and dependability of the anticipated methods. To a pre-examined sample solution (DPZ: 4 and VGT: 40 µg/ml), known concentrations of reference DPZ and VGT were supplemented at the 80, 100, and 120 percent levels, and the obtained solutions were re-examined using the proposed procedures and the percent recoveries were computed. Using the following formula, the accuracy of the proposed approaches was evaluated based on the proportion of standard DPZ and VGT retrieved from the formulation.
LOD and LOQ
For determining the sensitivity of the projected approaches in accordance with ICH suggestions, LOD and LOQ of DPZ and VGT were computed with the help of the below-mentioned equation.
Where σ = The SD of the response, S = The slope of the linear graph.
Solution stability
By storing the solutions at ambient temperature and assessing them at regular time periods, the stability of the solutions were determined by monitoring any differences in absorbance/amplitude and spectral pattern as compared to newly created solutions.
Statistical comparison by one-way ANOVA
One-way ANOVA (Microsoft 365, Microsoft Corporation, USA) was utilized to draw comparisons between assay outcomes.
Comparison of proposed methods with reported methods
The proposed methods in terms of their name, range, limits of detection (LOD), limits of quantification (LOQ), specificity, solvents utilized, and their applications were compared (Table 7) with a recently published research paper (Attimarad et al., 2023) in order to establish the novelty of the projected methods.
RESULTS AND DISCUSSION
In quality control departments, where time and money are of the essence, the proposed spectrophotometric procedures are seen as a natural fit. Because of the simplicity, speed, low cost, and reproducibility of the results, UV spectroscopic methods are widely used for routine investigation of pharmaceutical preparation. These spectrophotometric methods are superior to other analytical methods and provide many benefits. Multi-component formulations with overlapping UV spectra make it difficult to analyze all analytes in a single run. The proposed work describes straightforward and inexpensive methods for analyzing DPZ and VGT simultaneously in binary mixture showing overlapping spectra.
Simultaneous equation method
This method was developed and demonstrated to be sensitive and selective enough for the evaluation of DPZ and VGT in tablet formulation. Substantial absorption was observed in the zero-order UV spectra of DPZ and VGT at 223 and 210 nm. As displayed in Figure 2, the UV spectra of DPZ and VGT show some overlap, allowing for simultaneous estimation of both components in the binary combination. Using a simultaneous equation, we determined how much active pharmaceutical ingredient was present in the formulation. Tables 1 and 3 display absorptivity values and the outcomes of method validation parameters, respectively.
Absorbance ratio method
In ARM, 223 and 219.2 nm were utilized for detecting and quantifying DPZ and VGT. The zero-order overlapping UV spectra exhibited substantial absorbance at 223 and 219.2 nm for DPZ and VGT, sequentially. Moreover, the UV spectra of DPZ and VGT exhibited isosbestic point at 219.2 nm which enables simultaneous evaluation of DPZ and VGT in the binary mixture by ARM (Fig. 2). Table 1 displays the absorptivity values and Table 3 shows the validation results of the proposed methods.
Derivatization of UV spectra
It is a well-established fact that the derivatization of UV spectra increases the specificity and selectivity of pharmaceuticals in combination preparation by enhancing the spectral resolution. In addition to eliminating the excipient effects, derivatization also enables us to calculate one analyte in the presence of another analyte. In order to obtain the ratio spectra, which are free of divisor analyte and excipient interventions, the mixture spectra are divided using one of the analyte spectra. Using a spectrum that has been optimized as a divisor is another way to reduce interference and errors made during investigations. Quantifications are conducted in proportion to the peaks, which makes them more exact, sensitive, and specific. This is another advantage of the ratio spectra approach, which also has a number of other advantages. As a direct result of this, ratio spectroscopic methods came into existence. These methods, when contrasted with other spectroscopic approaches, produce results that are of a higher quality.
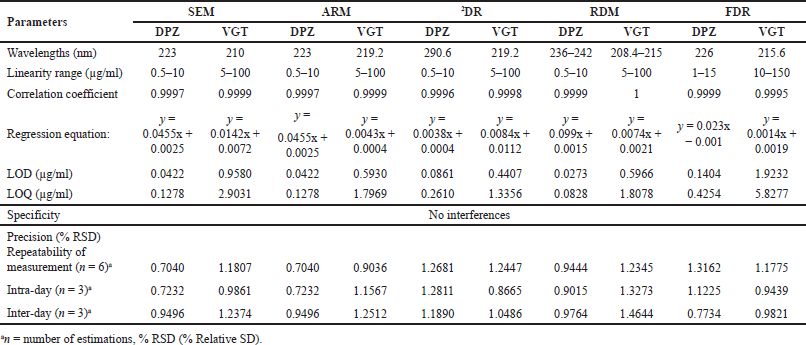 | Table 3. A summary of the data obtained by linear regression as well as method validation for the proposed methodologies. [Click here to view] |
Second derivative zero crossing method
Following the manipulation of the zero-order UV spectra of the analytes (DPZ and VGT) into their respective second derivative spectra, the second derivative signal at 290.6 and 219.2 nm was traced consecutively using 8 nm as the wavelength interval (Δλ), and 100 as the scaling factor. The second derivative UV spectra of DPZ and VGT which exhibit overlapping of spectra, zero-crossing point, and detection wavelength has been displayed in Figure 3, which enables simultaneous assessment of DPZ and VGT in the binary mixture. The number of analytes existing in the formulation was computed with the help of a regression equation.
Divisor and scaling factor optimization for the FDR spectra
In order to acquire the signal of the FDR spectra that is as excellent as it can possibly be, optimization of the many various choices of experimental parameters was done. Among all of these, the most crucial one was the optimization of the divisor and the scaling factor. Different concentrations of DPZ and VGT were experimented in order to find a divisor that had an appropriate level of concentration. In the end, a VGT concentration of 150 µg/ml and a DPZ concentration of 15 µg/ml were chosen as the appropriate divisors for the quantitative investigation of DPZ and VGT in their binary blend using the RDM and FDR methods. In addition, the scaling factor was set to one and optimized for this value because it was determined to be the most appropriate for accomplishing the goal of reaching the FDR spectra. In order to come up with the most accurate first derivative spectrum, a number of different wavelengths, including 2, 4, 8, and 10 nm were tried. Based on the findings, an optimal wavelength of 8 nm was found to be appropriate, and hence, this wavelength was selected and utilized with a scaling factor of 1.
Ratio difference spectroscopic method
The wavelengths chosen for this procedure were 236 and 242 nm for determining DPZ, whereas 208.4 and 215 nm for determining VGT. The amplitude difference at the given wavelength was then calculated for both DPZ and VGT. The amount of DPZ was estimated utilizing the linear regression equation derived by plotting the variation between the amplitude values at 236 and 242 nm (ΔP236–242) of the ratio spectra presented in Figure 4A against their respective concentrations. The amount of VGT was computed by means of linear regression equation achieved by plotting the variation in amplitude values at 208.4 and 215 nm (ΔP208.4–215) of the ratio spectra displayed in Figure 4B against their respective concentrations.
First derivative of ratio spectra method
DPZ was successfully determined using this method by dividing the spectra of mixed reference solutions by 150 µg/ml of VGT. Using one as a scaling factor and eight as Δλ, the resultant ratio spectra were manipulated to their first-order spectra. By means of the first derivative signal at 226 nm, the quantity of DPZ was calculated. For VGT, a similar technique was utilized, with 15 µg/ml DPZ serving as the divisor, 1 as the scaling factor, and 8 as Δλ. The VGT concentration was then calculated by detecting the first derivative signal at 215.6 nm. The first derivative signal’s amplitudes were put up against their respective concentrations, and regression equations were produced. Within the concentration series of 1–15 µg/ml for DPZ and 10–150 µg/ml for VGT a linear association was observed. Figure 5A and B depicts the overlaying FDR spectra of DPZ and VGT.
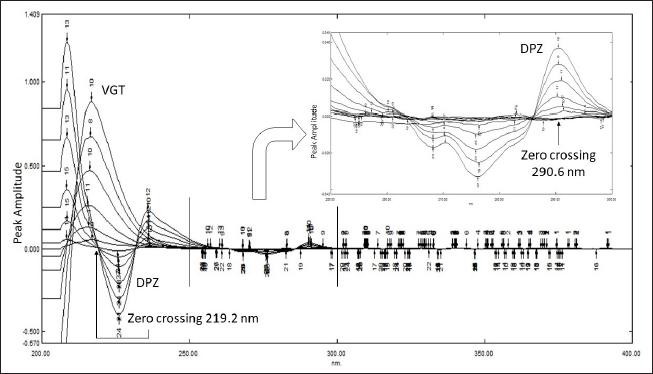 | Figure 3. Overlain second derivative UV spectra of DPZ (0.5–10 µg/ml) and VGT (5–100 µg/ml) showing zero crossing points and detection wavelengths. [Click here to view] |
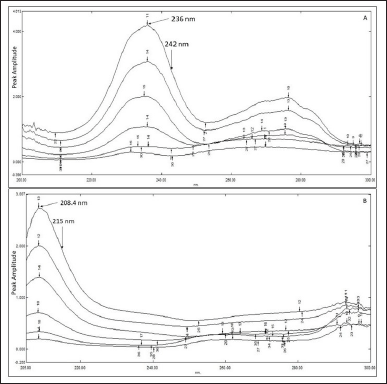 | Figure 4. Overlapping ratio spectra of DPZ employing 150 µg/ml VGT as the divisor (A); Overlapping ratio spectra of VGT utilizing 15 µg/ml DPZ as the divisor (B). [Click here to view] |
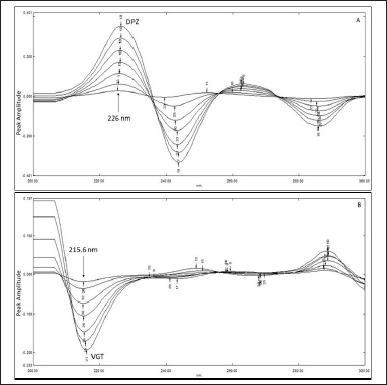 | Figure 5. Overlain first derivative ratio spectra of DPZ employing 150 µg/ml VGT as the divisor (A) and Overlain ratio spectra of VGT utilizing 15 µg/ml DPZ as the divisor (B) at Δλ = 8. [Click here to view] |
 | Table 4. Recovery data of the anticipated methodologies. [Click here to view] |
 | Table 5. Outcomes of formulation investigation employing various approaches. [Click here to view] |
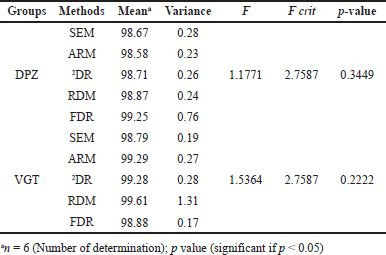 | Table 6. Statistical comparison of assay outcomes utilizing one-way ANOVA. [Click here to view] |
Method validation
All of the proposed methods were evaluated for their validity in agreement with ICH regulations. The subsequent part talks about the results of different validation parameters.
Specificity
It was found that there was no interaction between excipients and analytes by looking at the overlapping spectra of drug solutions and placebos. A placebo is a mixture of familiar excipients that are used in the marketed formulation. This information was presented in the preceding section.
Linearity and range
Evaluating linear correlation and range requires taking absorbance readings at predetermined wavelengths for SEM and ARM approach, amplitude difference of ratio spectra in RDM and amplitude of second derivative spectra in 2DR and amplitude of first derivative in FDR method. Linear correlation was observed for DPZ and VGT between 0.5–10 and 5–100 µg/ml, respectively for SEM, ARM, 2DR, and RDM methods. However, in the case of FDR method, DPZ and VGT were observed to be linear between 1–15 and 10–150 µg/ml, correspondingly. Using the least-squares method, the slope, intercept, and correlation coefficient for DPZ and VGT at their respective wavelengths were calculated for regression investigation. The correlation coefficient values argue in favor of the linearity of every method that was created (Table 3). Each response reflected an average of the results of six separate investigations.
Precision
The results of the precision trials, which were expressed as a percentage RSD and ensured that ICH recommended limits, were met (?2). The outcome demonstrates that all of the proposed methods had great repeatability and reduced intra-and inter-day changeability (Table 3).
Accuracy
The proposed procedures’ accuracy was determined using the standard addition method for recovering analytes. For each medicine, recovery rates in the experiments ranged from 96% to 103%, proving the efficacy of the established protocols (Table 4).
LOD and LOQ
Table 3 shows that the predicted procedures are highly sensitive because the LOD and LOQ amounts were observed as very small for all five approaches.
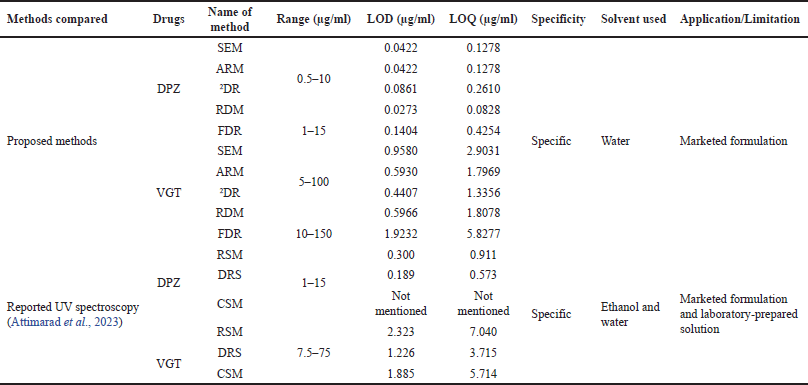 | Table 7. Comparison of proposed methods with reported methods. [Click here to view] |
Stability of the solution
Testing the stability of the solution found that it remained unchanged for 2 days at room temperature and for 10 days in the refrigerator (6°C).
Determination of DPZ and VGT in tablet formulation
The planned methods for evaluating DPZ and VGT were successfully implemented. Results were between 98% and 102% for both the analytes, as determined by six repeat determinations used to create a statistically reliable data set. Therefore, we can use the proposed methodologies to evaluate DPZ and VGT together on tablets (Table 5).
Statistical comparison using one-way ANOVA
The effects of each of the five planned procedures were examined using statistical techniques on the data from the assays. The one-way ANOVA in Microsoft 365, Microsoft Corporation, USA was used to relate the statistical implication of the five distinct strategies. All tests had a significance level of p ? 0.05. The outcomes of the one-way ANOVA are shown in Table 6, and it was discovered that the processes developed differed little from one another.
Comparison of proposed methods with reported methods
Proposed methods were compared (Table 7) with recently published research article (Attimarad et al., 2023) in terms of their name of methods, range, LOD, LOQ, specificity, solvents used, and application. Results of the comparison suggest that the proposed methods are quite similar in terms of various outcomes. However, the proposed methods stand out against the reported methods in terms of range, sensitivity, and solvent used. Furthermore, the reported approaches have certain shortcomings, such as the absence of validation results for DPZ in the CSM method (Table 4). Additionally, there are instances where the method name does not correspond accurately in certain places. All of the presented methods have been validated in line with ICH standards and they each have their own set of advantages, including broad concentration range, great sensitivity, and a low barrier in terms of reference and sample preparation. Therefore, the proposed methods are found to be comparable with the reported methods and can cover up the shortcomings of reported methods and thus can be utilized as alternative methods along with reported methods for the simultaneous assessment of DPZ and VGT in the combined formulation.
CONCLUSION
Five distinct spectroscopic approaches, SEM, ARM, 2DR, RDM, and FDR were developed for the synchronized evaluation of DPZ and VGT in a combined marketed formulation. All approaches were validated in accordance with ICH recommendations. It was determined that the proposed approaches are economical, easy, sensitive, precise, and accurate. In addition, the UV-spectrophotometric approaches developed need minimal sample preparation and have a broad concentration series and good sensitivity. There is no statistically significant variation among the five approaches. Therefore, all the described methodologies are suitable for regular quality control examination of DPZ and VGT in the binary mixture or tablet dosage form.
LIST OF ABBREVIATIONS
ARM, Absorbance ratio method; CSM, Constant ratio substation coupled with multiplication with divisor spectrum method; DPZ, Dapagliflozin propanediol; 2DR, second Derivative zero crossing method; DRS, Derivative ratio spectroscopic technique; FDR, First derivative of ratio spectra method; ICH, International Conference on Harmonization; RDM, Ratio difference method; RSM, Ratio difference spectroscopic method; SGLT2, Sodium-glucose Co-transporter-2; SEM, Simultaneous equation method; UV, Ultraviolet; VGT, Vildagliptin.
AUTHOR CONTRIBUTIONS
All authors made substantial contributions to the conception and design, acquisition of data, or analysis and interpretation of data; took part in drafting the article or revising it critically for important intellectual content; agreed to submit to the current journal; gave final approval of the version to be published; and agree to be accountable for all aspects of the work. All the authors are eligible to be an author as per the international committee of medical journal editors (ICMJE) requirements/guidelines.
FINANCIAL SUPPORT
There is no funding to report.
CONFLICTS OF INTEREST
The authors report no financial or any other conflicts of interest in this work.
ETHICAL APPROVALS
This study does not involve experiments on animals or human subjects.
DATA AVAILABILITY
All data generated and analyzed are included in this research article.
PUBLISHER’S NOTE
This journal remains neutral with regard to jurisdictional claims in published institutional affiliation.
REFERENCES
Abdelrahman AE, Maher HM, Alzoman NZ. HPTLC method for the determination of metformin hydrochloride, saxagliptin hydrochloride, and dapagliflozin in pharmaceuticals. Curr Anal Chem, 2020; 16(5):609–19. CrossRef
Ahmed HM, Omar MA, Batakoushy HA, Hamid MA. HPTLC-densitometric analysis of selected antidiabetic drugs in presence of their degradation products. Microchem J, 2020; 154:104560. CrossRef
Attimarad M, Al-Dhubiab BE, Alhaider IA, Nair AB, Sree HN, Mueen AK. Simultaneous determination of moxifloxacin and cefixime by first and ratio first derivative ultraviolet spectrophotometry. Chem Cent J, 2012; 6(1):105. CrossRef
Attimarad M, Islam MM, Shafi S, David M, Rahman A, Molina EI. Eco-friendly mathematically manipulated UV spectroscopic procedures to resolve severely overlapped spectra of a binary mixture of dapagliflozin with sitagliptin and vildagliptin. Microchem J, 2023; 190:108700. CrossRef
Attimarad M, Narayanswamy VK, Aldhubaib BE, Sreeharsha N, Nair AB. Development of UV spectrophotometry methods for concurrent quantification of amlodipine and celecoxib by manipulation of ratio spectra in pure and pharmaceutical formulation. PLos One, 2019; 14(9):e0222526. CrossRef
Available via https://www.1mg.com/generics/dapagliflozin-vildagliptin-509883.
Available via https://www.ema.europa.eu/en/documents/product-information/forxiga-epar-product-information_en.pdf.
Available via https://www.ema.europa.eu/en/documents/product-information/galvus-epar-product-information_en.pdf.
Banik S, Karmakar P, Miah MA. Development and validation of a UV-spectrophotometric method for determination of vildagliptin and linagliptin in bulk and pharmaceutical dosage forms. Bangladesh Pharm J, 2015; 18(2):163–8. CrossRef
Beckett AH, Stenlake JB. Instrumental methods in the development and use of medicines. Practical pharmaceutical chemistry (Part-2). 4th edition, CBS Publishers and Distributors, New Delhi, India, pp 275–99, 2005.
Bendale AR, Singh RP, Vidyasagar G. Development and validation stability indicating HPTLC method for determination of vildagliptin and metformin hydrochloride in the pharmaceutical dosage forms. Int J Appl Pharm, 2018; 10(1):36–45. CrossRef
Boovizhikannan T, Palanirajan VK. RP-HPLC determination of vildagliptin in pure and in tablet formulation. J Pharm Res, 2013; 7(1):113–6. CrossRef
Darwish HW, Bakheit AH, Naguib IA. Comparative study of novel ratio spectra and isoabsorptive point based spectrophotometric methods: application on a binary mixture of ascorbic acid and rutin. J Anal Methods Chem, 2016; 2016:2828647. CrossRef
Deepan T, Dhanaraju MD. Stability indicating HPLC method for the simultaneous determination of dapagliflozin and saxagliptin in bulk and tablet dosage form. Curr Issues Pharm Med Sci, 2018; 31(1):39–43. CrossRef
Donepudi S, Achanta S. Simultaneous estimation of saxagliptin and dapagliflozin in human plasma by validated high-performance liquid chromatography-ultraviolet method. Turk J Pharm Sci, 2019; 16(2):227–33. CrossRef
Erk N. Derivative ratio spectrophotometry and differential derivative spectrophotometric determination of isoniazid and pyridoxine hydrochloride in dosage forms. Spectrosc Lett, 2001; 34(6):745–61. CrossRef
Gundala A, Prasad KV, Koganti B. Application of quality by design approach in RP-HPLC method development for simultaneous estimation of saxagliptin and dapagliflozin in tablet dosage form. Braz J Pharm Sci, 2019; 55:e18129. CrossRef
ICH. Validation of analytical procedures: text and methodology Q2(R1). International Conference on Harmonization, Geneva, Switzerland, 2005.
Joshi A, Birla A, Prasad A, Warrier S. Bioequivalence study of a fixed-dose combination of dapagliflozin/vildagliptin sustained release tablets in healthy adult male subjects: a randomized, open-label, crossover study. J Drug Deliv Ther, 2022; 12(6):105–9. CrossRef
Kalra S. Sodium glucose Co-transporter-2 (SGLT2) inhibitors: a review of their basic and clinical pharmacology. Diabetes Ther, 2014; 5(2):355–66. CrossRef
Lotfy HM, Hassan NY, Elgizawy SM, Saleh SS. Comparative study of new spectrophotometric methods; an application on pharmaceutical binary mixture of ciprofloxacin hydrochloride and hydrocortisone. J Chil Chem Soc, 2013; 58(3):1892–8. CrossRef
Manasa S, Dhanalakshmi K, Nagarjuna RG, Kavitha B. Method development and validation of dapagliflozin API by UV Spectroscopy. Int J Pharm Sci Rev Res, 2014; 27(1):270–72.
Mante GV, Gupta KR, Hemke AT. Estimation of dapagliflozin from its tablet formulation by UV-spectrophotometry. Pharm Methods, 2017; 8(2):102–7. CrossRef
Mante GV, Hemke AT, Umekar MJ. RP-HPLC method for estimation of dapagliflozin from its tablet. Int J ChemTech Res, 2018; 11(01):242–8.
Nakhla DS, Hussein LA, Magdy N, Abdallah IA. Comparative study of different spectrophotometric methods for simultaneous determination of tramadol and paracetamol in pharmaceutical formulations. J Appl Spectrosc, 2021; 88(4):894–900. CrossRef
Orme M, Fenici P, Lomon ID, Wygant G, Townsend R, Roudaut M. A systematic review and mixed-treatment comparison of dapagliflozin with existing anti-diabetes treatments for those with type 2 diabetes mellitus inadequately controlled by sulfonylurea monotherapy. Diabetol Metab Syndr, 2014; 6(1):1–3. CrossRef
Patil KR, Deshmukh TA, Patil VR. A stability indicating HPTLC method development and validation for analysis of vildagliptin as bulk drug and from its pharmaceutical dosage form. Int J Pharm Sci Res, 2020; 11:2310–6.
Puranik M, Hirudkar A, Wadher SJ, Yeole PG. Development and validation of spectrophotometric methods for simultaneous estimation of tramadol hydrochloride and chlorzoxazone in tablet dosage form. Indian J Pharm Sci, 2006; 68(6):737–9. CrossRef
Saeedi P, Petersohn I, Salpea P, Malanda B, Karuranga S, Unwin N, Colagiuri S, Guariguata L, Motala AA, Ogurtsova K, Shaw JE, Bright D, Williams R. Global and regional diabetes prevalence estimates for 2019 and projections for 2030 and 2045: results from the international diabetes federation diabetes atlas, 9th edition. Diabetes Res Clin Pract, 2019; 157:107843. CrossRef
Sen AK, Hinsu DN, Sen DB, Zanwar AS, Maheshwari RA, Chandrakar VR. Analytical method development and validation for simultaneous estimation of teneligliptin hydrobromide hydrate and metformin hydrochloride from its pharmaceutical dosage form by three different UV spectrophotometric methods. J Appl Pharm Sci, 2016a; 6(9):157–65. CrossRef
Sen AK, Pandey H, Maheshwari RA, Zanwar AS, Velmurugan R, Sen DB. Novel UV spectroscopic methods for simultaneous assessment of empagliflozin, linagliptin and metformin in ternary mixture. Indian J Pharm Edu Res, 2022; 56(4):S669–81. CrossRef
Sen AK, Sen DB, Maheshwari RA, Balaraman R, Seth AK. Simultaneous estimation of aliskiren hemifumarate and hydrochlorothiazide in combined tablet formulation by simultaneous equation, absorbance ratio and first derivative spectroscopic methods. J App Pharm Sci, 2016b; 6(07):164–70. CrossRef
Sen DB, Jatu S, Maheshwari RA, Zanwar AS, Velmurugan R, Sen AK. New eco-friendly UV-spectroscopic methods for simultaneous assessment of dapagliflozin, saxagliptin and metformin in ternary mixture. Ind J Pharm Edu Res, 2023; 57(2):559–69. CrossRef
Suma BV, Deveswaran R, Premnath SH. A new high-performance thin layer chromatographic method development and validation of dapagliflozin in bulk and tablet dosage form. Int J Pharm Pharm Sci, 2019; 11(8):58–63. CrossRef
Usman MR, Ahmad S, Deore C, Shaikh T, Jain B, Imran M. Stability indicating RP-HPLC method for determination of saxagliptin and dapagliflozin in bulk and tablet dosage forms. J Pharm Sci Res, 2020; 12(4):499–506.
Vankalapati KR, Alegete P, Boodida S. Stability-indicating HPLC method development and validation for simultaneous estimation of metformin, dapagliflozin, and saxagliptin in bulk drug and pharmaceutical dosage form. Biomed Chromatogr, 2022; 36(7):e5384. CrossRef
Zaazaa HE, Elzanfaly ES, Soudi AT, Salem MY. Application of the ratio difference spectrophotometry to the determination of ibuprofen and famotidine in their combined dosage form; comparison with previously published spectrophotometric methods. Spectrochim Acta A Mol Biomol Spectrosc, 2015; 143:251–5. CrossRef