INTRODUCTION
The application of quality by design (QbD) concepts in the creation of analytical methods is becoming more and more prevalent as the validation guidelines as per suggested International Council on Harmonization (ICH) criteria do not give significant dependability, especially with method variability reduction [1]. The disparity can be attributed to a variety of factors, including the use of solvents with different polarity, and buffer mixes, as well as careful monitoring of chromatographic parameters including composition of mobile phase, flow rate, injection volume, pH, and so on [2]. The AQbD approach promotes a scientific and risk-based knowledge of the primary causes of fluctuation, which is then followed by the recognition of CMPs via risk evaluation and factor examination studies to locate vulnerable parameters with a major effect on analytical efficiency, and then optimize them using appropriate designs for experiments [3].
Apixaban (APX) is a derivative of pyrazole and a strong factor Xa inhibitor that is both direct and selective and works by directly and selectively blocking free and clot-bound factor Xa. Inhibiting factor Xa causes a reduction in the conversion of factor II (prothrombin) to factor IIa, resulting in a decrease in thrombin production [4]. Clopidogrel (CLP) is one of the most often used P2Y12 antiplatelet medications in the world (Fig. 1). It has a widely recognized function as a platelet antagonist, resulting in a lower incidence of recurrent ischemic episodes. In the realm of cardiology, it is critical in preventing coronary heart disease [5]. The present combination of APX and CLP has been suggested by the AUGUSTUS clinical trial (NCT02415400) formally executed by Bristol-Mayers Squibb and Pfizer to reduce bleeding and hospitalization events after arterial fibrillation without considerably increasing the number of events such as heart attacks, strokes, and blood clots. The clinical trial was conducted at the dose level of 2.5 mg of APX and 75 mg of CLP [6].
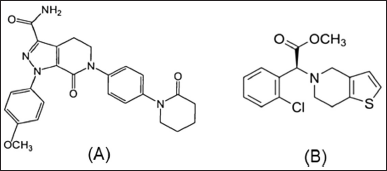 | Figure 1. Chemical structures of A. APX and B. Clopidogrel. [Click here to view] |
A thorough literature review on APX focuses mostly on UV spectroscopy [7], HPLC [8–11], LC-MS [12], and HPTLC [13–14] as analytical techniques for evaluation from bulk and pharmaceutical formulations. Similarly, a thorough examination of the literature on CLP indicated UV spectrophotometric [15–16], HPLC [17–20], LC-MS [21–22], and HPTLC [23–27] methods for quantitative determination either from bulk, pharmaceutical dosage form, or plasma.
A conclusion can be drawn that there is currently no HPLC technique accessible for the assessment of APX and CLP from their binary mixtures which is one of the most potential and promising regimens in upcoming months. Adoption of the QbD approach also fulfills the newer regulatory approach in method development for reducing risk to the quality and, hence, it was aimed at developing a QbD-based reverse phase high performance liquid chromatographic (RP-HPLC) method for determining APX and CLP from their binary mixture.
MATERIALS AND METHODS
Instruments and chemicals
The samples were processed using a SHIMADZU (Series 2010) HPLC equipment equipped with a UV-VIS detector with the ability of binary gradient operation, and the chromatogram was processed and integrated using LC solution software. The column used was a HYPERSIL ODS C18 column with dimensions of 250 mm in length and 4.6 mm in internal diameter. A Mettler Toledo weighing scale with a sensitivity of 0.1 mg was used to determine the precise quantities of materials. The pH meter Labman LMPH 10 was used to adjust the pH.
Alembic Pharmaceutical Pvt. Ltd., Vadodara, Gujarat, India, and Sunij Pharma Pvt. Ltd., Vatva, Ahmedabad, Gujarat, India, provided both active ingredients as free samples. Other chemicals, such as methyl alcohol, KH2PO4 buffer, O-phosphoric acid, and water, were of HPLC quality and were obtained from Merck Life Sciences Private Limited (Mumbai, India).
 | Table 1. Factorial design variables. [Click here to view] |
Factor screening studies
For factor screening investigations, certain critical method parameters (CMPs) such as pH, the proportion of Organic phase, and flow rate were considered based on a primary review of the literature and were transformed as a matrix to study their combined effect on critical method attributes (CMAs) (retention duration, resolution, and peak tailing). Table 1 illustrates the outline of CMPs and their assigned level that affects the CMA.
Preparation of standard solution
For preparing a standard solution, an accurate amount of 0.01 g of APX and 0.3 g of CLP was weighed. After being transferred to a 100 ml volumetric flask 20 ml of methanol was added and sonicated, and the volume was increased to 100 ml using methanol. 5 ml of the previous solution was transferred to a 50 ml volumetric flask and the volume was again increased to the mark with methanol. 2.5 ml of the previous solution was diluted to 10 ml with methanol to get a working solution containing 2.5 g/ml of APX and 75 g/ml of CLP.
Experimental design for method development
For selecting the analytical wavelength for method development, the solution containing 2.5 g/ml of APX and 75 g/ml of CLP was scanned individually between 200 and 400 nm. It is not only the identification of CMPs that is important as, always there is a combined effect of all the CMPs that we observed as a chromatographic separation and for the same. Three factorial designs were used to study the combined effect of each CMPs on the cited CMAs. For creating a three-factorial design, Design Expert 10.0 was used to create the study. Table 2 presents the design matrix with 27 trial runs generated from Design Expert 10 software. All experimental runs that were examined for CMAs (retention duration, resolution, and peak tailing) employed a standard concentration of 2.5 g/ml APX and 75 g/ml CLP.
Optimizing and analyzing data
Multiple linear regression analysis and quadratic design model were used for analyzing and optimizing data using Design Expert. The polynomial equation was built with model coefficients that had a statistical significance of 0.05. Finally, the model’s suitability for use was evaluated using a variety of metrics, including coefficient of correlation, projected error sum of squares, and lack of fit analysis. The 2D-contour and 3D-response surface plots were subjected to response surface analysis to determine the factor-response connection and possible interaction effect(s). The optimum chromatographic condition was finalized optimizing numerical functions and desirability.
Simulation of desired conditions to chromatographic output
Based on the desirability data obtained from the design expert software, the conditions were mimicked and a solution containing 2.5 μg/ml of APX and 75 μg/ml of CLP was chromatographed. Once the chromatogram was obtained, the system suitability parameters were checked three times, and a comparison between predicted values and mean actual values was made.
Validation of optimized method
The improved approach was validated in compliance with the ICH Q2R2 requirements. For the linearity, a standard calibration curve was created by injecting five different levels of APX ranging from 1.25–3.75 μg/ml and CLP ranging from 37.5–112.5 μg/ml. Between peak area and drug concentration, a linear calibration curve was established. Linear regression analysis was used to test the linearity. The repeatability of the method was ensured by injecting a 100% concentration (2.5 μg/ml of APX and 75 μg/ml of CLP) for a total of six times and its relative standard deviation (RSD) was monitored. LOD and LOQ were statistically determined. A mixture representing the whole range was examined for intraday precision for a total of three times, and the same concentration was also analyzed on separate days for monitoring the interday precision (APX + CLP = 1.25 + 37.5, 2.5 + 75 and 3.75 + 112.5 μg/ml). RSD was monitored to adjudge the method’s precision. Accuracy of the method was assessed by spiking of placebo with standard. The target concentration was APX + CLP = 2.5 + 75 μg/ml. The placebo was spiked at 50%, 100%, and 150% of the intended concentration. Placebo composition was selected based on generalized use for the mentioned category which comprises microcrystalline cellulose (MCC) (190 mg), magnesium stearate (4 mg), hydroxy propyl methyl cellulose (HPMC) (4 mg), and talc (2 mg). HPMC was introduced as a film-forming agent and MCC had the role of being a directly compressible material. Magnesium stearate was used as a gliding agent and talk has the role of lubricating agent. Again three replicates at each concentration were analysed and % recovery was monitored.
Quantification of APX and CLP form synthetic mixture
The proposed active binary mixture comprised 200 mg placebo as mentioned before, 2.5 mg APX, and 75 mg CLP (277.5 mg). The constituents were diluted in 10 ml of methanol to produce a mixture comprising 250 μg/ml of APX and 7,500 μg/ml of CLP, respectively. The solution described above was filtered via a 0.45 m Whatman filter disk. A total of 100 μl of filtrate was diluted to 10 ml with mobile phase to get a solution with 2.5 μg/ml of APX and 75 μg/ml of CLP. The combination was examined in triplicates to determine the percentage assay.
RESULTS AND DISCUSSION
Effect of independent variables on responses
The only parameter, that is analytical wavelength was kept constant, as there is a wide difference in the dose and absorptivity, the selection of analytical wavelength was a tedious one; however, at 245 nm, the signal of APX and CLP in the chromatogram were adequate and hence was selected as analytical wavelength (Fig. 2)
After the application of factorial design, when the system was applied, the mentioned responses were noted which are shown in Table 3. When statistical treatment was applied to the obtained responses in Design Expert software, the following observations were noted. The applicability of the model was determined based on agreement between Adj R-squared and Pred R-squared, the difference between the same should be less than 0.2 which was the case for all the responses. Another term, Adqe precision was observed whose ration should be greater than 4, which again was the case for all responses
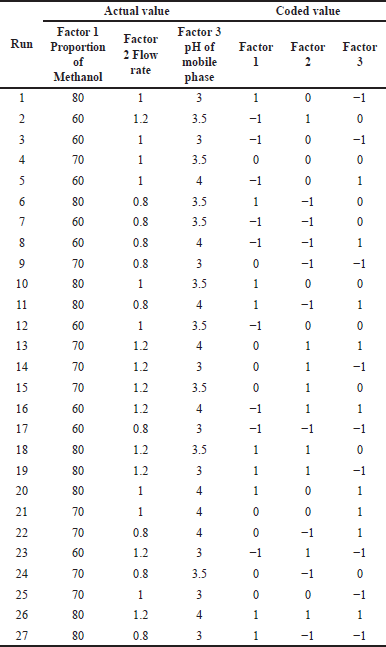 | Table 2. Executing three factorial designs (coded values). [Click here to view] |
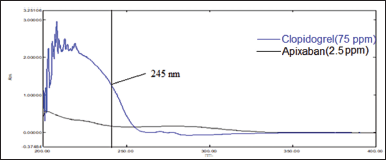 | Figure 2. Overlain UV spectrum of APX (2.5 μg/ml) and CLP (75 μg/ml). [Click here to view] |
For response 1, A and B were identified as significant model terms. Adeq precision value 54.162 indicated a strong signal. Hence, the presented design was employed to explore the design space which is highlighted as the surface and counter plot (Fig. 3). The polynomial equation can be described as an RT APX = +4.46 − 0.48*A − 0.13*B (Reduced model, as C is nonsignificant term). For response 2 (Rt of CLP), there were significant model terms identified as A, B, AB, and A2. Adeq precision value 24.347 indicated an adequate signal. The same model is highlighted as a surface and counter plot (Fig. 4). The polynomial equation can be described as an RT CLP = + 12.34 − 1.83*A − 0.80*B + 0.64*AB − 0.88*A2 (Reduced Model). For Response 3 (Tf of APX), A, B, AC, A2, and B2 were identified as significant model terms. Adeq precision value 35.73 indicated an adequate signal. The same model is highlighted as a surface and counter plot (Fig. 5). The polynomial equation can be described as a TF APX = + 1.50 + 0.18*A + 0.067*B + 0.020*AC − 0.024*A2 + 0.024B2 (Reduced Model). For response 4 (tailing factor of CLP), A, B, AB, AC, and A2 were significant model terms. Adeq precision value 32.39 indicated an adequate signal. The same model is highlighted as a surface and counter plot (Fig. 6). The polynomial equation can be described as a TF APX = + 1.40 + 0.16*A + 0.046*B − 0.021*AB + 0.020*AC − 0.051*A2 (Reduced model). For response 5, A, B, AB, and A2 were significant model terms. Adeq precision value 22.78 indicated an adequate signal. The same model is highlighted as a surface and counter plot (Fig. 7). The polynomial equation can be described as a Resolution = + 1.40 − 0.78*A − 0.36*B + 0.40*AB + 0.39*A2.
From the above data, a desirability surface plot was generated (Fig. 8), which provided the outline of predicted conditions that can provide the best possible response for dependent variables. The proportion of organic phase was predicted as 63.52 volumes, the flow rate was predicted as 0.8 ml/minute and the pH was predicted as 3.0. The desirability for a given condition was identified as 0.683, which gave an idea regarding perfect suitability. The proposed conditions by design expert software predicted the best possible response. When the conditions obtained from the software were mimicked, the perfect separation was observed (Fig. 9). The actual value of responses was in perfect correlation with the precited values, which are cited in Table 4. Under these conditions, all the system suitability parameters are in accordance with the limits as shown in Table 5.
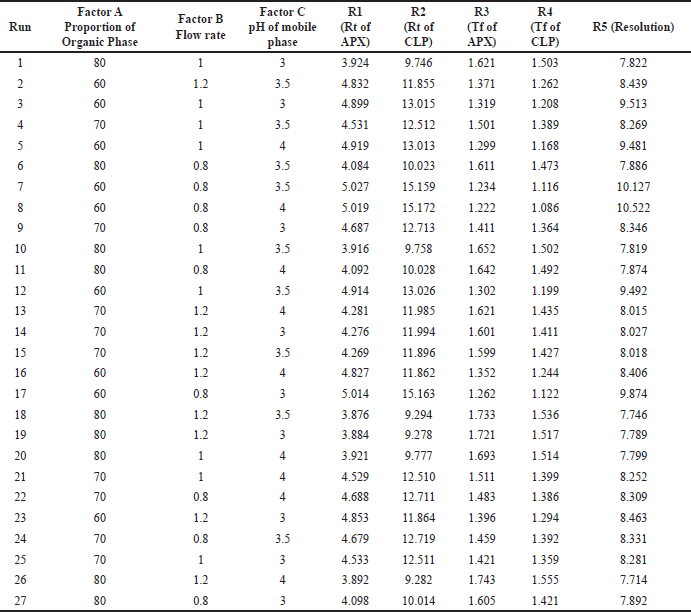 | Table 3. Matrixes of factorial experimental design with responses. [Click here to view] |
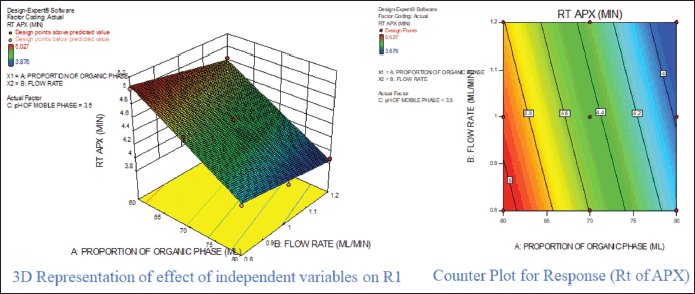 | Figure 3. Effect of independent variable on retention of APX. [Click here to view] |
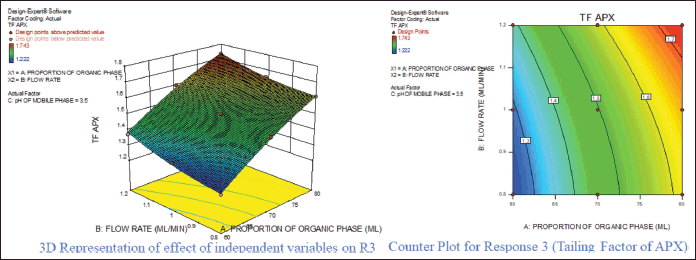 | Figure 4. Effect of independent variable on tailing factor of APX. [Click here to view] |
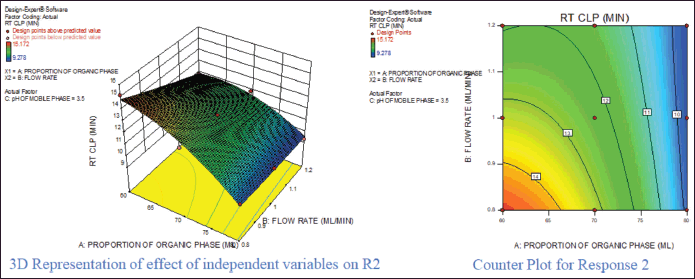 | Figure 5. Effect of independent variable on retention of CLP. [Click here to view] |
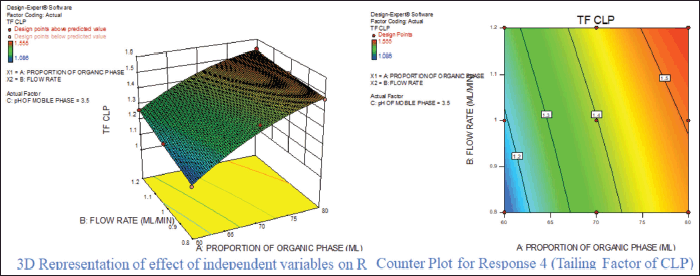 | Figure 6. Effect of independent variable on tailing factor of CLP. [Click here to view] |
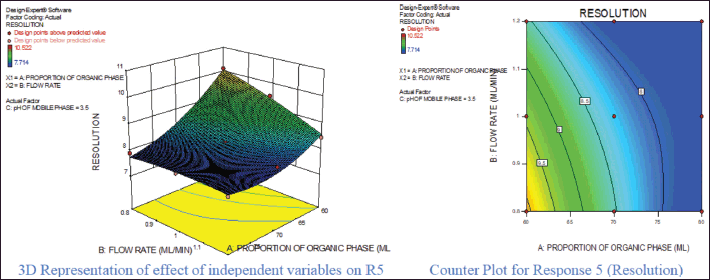 | Figure 7. Effect of independent variable on resolution. [Click here to view] |
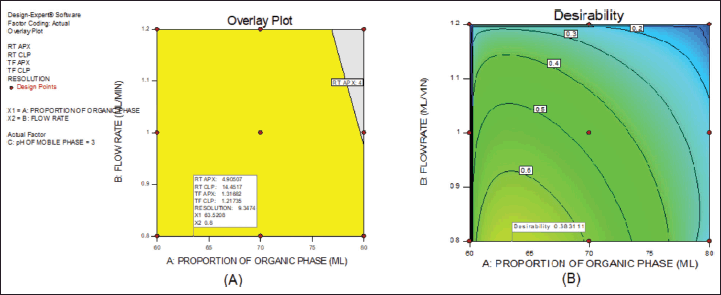 | Figure 8. Desirability plot. [Click here to view] |
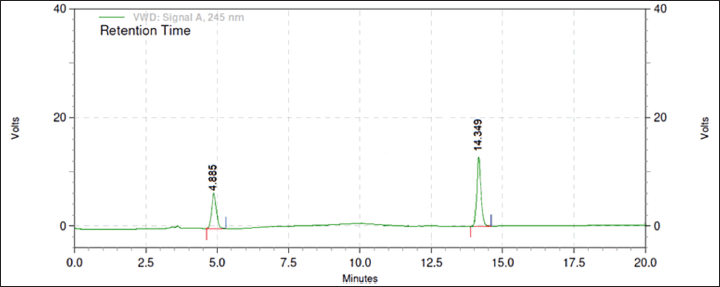 | Figure 9. Chromatogram under optimized conditions. [Click here to view] |
 | Figure 10. Overlain chromatogram of linearity. [Click here to view] |
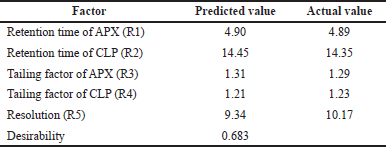 | Table 4. Comparison between predicted and actual values of dependent variables. [Click here to view] |
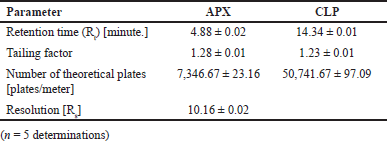 | Table 5. System suitability parameters under optimized chromatographic conditions. [Click here to view] |
Method validation
The devised approach was linear throughout the concentration range of APX (1.25–3.75 μg/ml) and CLP (37.5–112.5 μg/ml), with correlation coefficients (r2) of 0.9989 and 0.9988, respectively (Fig. 10). This demonstrated that all the responses were within the required acceptable limit, demonstrating a good degree of similarity between the predicted and observed data for the accuracy experiments at 50%,100%, and 150% levels, with the % recovery being within 98–102. Intermediate accuracy and repeatability tests were performed, and the percentage RSD values were determined to be less than 2%. Table 6 provides an overview of the approach validation parameters.
Quantification from binary mixture
When the newly developed and validated procedure was applied to a mixture containing 2.5 μg/ml of APX and 75 μg/ml of CLP, no interference from the placebo components was observed and the amount found for APX was 2.49 + 0.02 μg/ml (99.47 + 0.83 %w/w) and for CLP it was 74.94 + 0.39 μg/ml (99.92 + 0.52 %w/w)
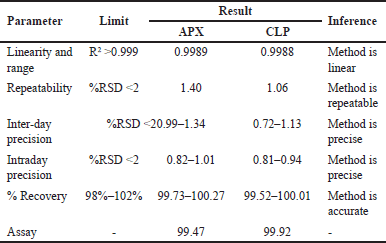 | Table 6. HPLC validation summary for quantification of APX and clopidogrel. [Click here to view] |
CONCLUSION
A Robust and reliable RP-HPLC technique for APX and CLP was successfully developed using Design Expert 10 software with a desirability of 0.683, which indicates the best possible separation. The precited conditions indicated a mobile phase containing 63.5% methanol having a 3.0 pH and flow rate of 0.8 ml/minute. When the method was operated with predicted conditions, all the responses were in perfect accordance with the predicted values. The method was finally successfully validated as per ICH Q2R2 guidelines and applied for quantification of APX and CLP from the binary mixture with % assay of 99.47 and 99.92%, respectively. As there is no HPLC method available to analyze this novel combination, based on method development expertise and risk assessment results, the QbD approach demonstrated outstanding linearity, accuracy, precision, and robustness for determination. However, the present developed method does not justify its applicability for the study of the stability of the mentioned components in the mixture as it has not been studied which is also the future plan of the current research.
ACKNOWLEDGMENT
The authors would like to thank Alembic Pharmaceutical Pvt. Ltd. for giving a free sample of APX and Sunij Pharma Pvt. Ltd., Vatva, Ahmedabad, Gujarat, for supplying a free sample of CLP for this study. The authors would like to thank the administration of Smt. S.M. Shah Pharmacy College for providing outstanding research resources.
AUTHOR CONTRIBUTIONS
All authors made substantial contributions to conception and design, acquisition of data, or analysis and interpretation of data; took part in drafting the article or revising it critically for important intellectual content; agreed to submit to the current journal; gave final approval of the version to be published; and agree to be accountable for all aspects of the work. All the authors are eligible to be an author as per the international committee of medical journal editors (ICMJE) requirements/guidelines.
FINANCIAL SUPPORT
There is no funding received or to report for presented work.
CONFLICTS OF INTEREST
The authors have no financial or other conflicts of interest to disclose.
ETHICAL APPROVALS
The present research work does not involve any experimental animal, animal parts, or human subjects.
DATA AVAILABILITY
All data generated and analyzed are included in this research article.
PUBLISHER’S NOTE
This journal remains neutral with regard to jurisdictional claims in published institutional affiliation.
REFERENCES
1. Monks K, Molnar I, Rieger HJ, Bogati B, Szabo E, Quality by design: multidimensional exploration of the design space in high performance liquid chromatography method development for better robustness before validation. J Chromatogr A. 2011;1232:218–30. CrossRef
2. Orlandini S, Pinzauti S, Furlanetto S. Application of quality by design to the development of analytical separation methods. Anal Bioanal Chem. 2013;405:443–50. CrossRef
3. Mehta B, Joshi H. Shah U, Patel P. Implementation of QbD Principles for Simultaneous Quantitative Expression of Olmesartan Medoxomil, Telmisartan and Hydrochlorothiazide by RP-HPLC. J Pharm Res Int. 2021;33(41A):50–61. CrossRef
4. Budovich A, Zargarova O, Nogid A. Role of apixaban (eliquis) in the treatment and prevention of thromboembolic disease. P T. 2013;38(4):206–31.
5. Wi?niewski A, Filipska K, The Phenomenon of Clopidogrel high on-treatment platelet reactivity in ischemic stroke subjects: a comprehensive review. Int J Mol Sci. 2020;21(17):6408. CrossRef
6. Lopes RD, Heizer G, Aronson R, Vora AN, Massaro T, Mehran R, et al. Antithrombotic therapy after acute coronary syndrome or PCI in atrial fibrillation. N Engl J Med. 2019;380(16):1509–24. CrossRef
7. Mahendra B, Harika Sundari K, Vimalakkannan T. Method developed for the determination of apixaban by using U.V. spectrophotometric. Int J Res Pharm Chem Anal. 2019;1(3):83–7. CrossRef
8. Landge SB, Jadhav SA, Dahale SB, Solanki PV, Bembalkar SR, Mathad VT, Development and validation of stability indicating RP-HPLC method on core shell column for determination of degradation and process related impurities of apixaban—an anticoagulant drug. Am J Anal Chem. 2015;6(6):539–50. CrossRef
9. Haque A, Soundharya R, Venu J, Monika ML, Bakshi V. Method development and validation of Apixaban using RP-HPLC method and its stress stability studies. Int J Chem Pharm Anal. 2017;5(1):1–11.
10. Subramanian VB, Katari NK, Dongala T, Jonnalagadda SB. Stability-indicating RP-HPLC method development and validation for determination of nine impurities in apixaban tablet dosage forms. Robustness study by quality by design approach. Biomed Chromatogr. 2020;34(1):e4719. CrossRef
11. Gouveia F, Bicker J, Santos J, Rocha M, Alves G, Falcão A, et al. Development, validation, and application of a new HPLC-DAD method for simultaneous quantification of apixaban, dabigatran, edoxaban and rivaroxaban in human plasma. J Pharm Biomed Anal. 2020;181:113109. CrossRef
12. Lagoutte-Renosi J, Le Poupon J, Girard A, Montange D, Davani S. A simple and fast HPLC-MS/MS method for simultaneous determination of direct oral anticoagulants apixaban, dabigatran, rivaroxaban in human plasma. J Chromatogr B Analyt Technol Biomed Life Sci. 2018;1100:43–9. CrossRef
13. Damle MC, Waghmare SS, Sinha PU. Development and validation of stability-indicating HPTLC method for determination of apixaban as bulk drug. Int J Pharm Pharm Sci. 2019;11:37–42. CrossRef
14. Hamdy MM, Korany MA, Ebied SA, Haggag RS. ICH and US-FDA validated HPTLC methods with greenness assessments for the assay of mixtures prescribed in stroke prophylaxis: application to pharmaceutical preparations and human plasma. J Planar Chromatogr Modern TLC. 2022;35(5):519–32. CrossRef
15. Zaazaa HE, Abbas SS, Abdelkawy M, Abdelrahman MM. Spectrophotometric and spectrodensitometric determination of Clopidogrel Bisulfate with kinetic study of its alkaline degradation. Talanta. 2009;78(3):874–84. CrossRef
16. Antypenko L, Gladysheva S, Vasyuk S, Development and validation of clopidogrel Bisulphate determination in bulk by UV spectrophotometric method. Scr Sci Pharm. 2016;3(2):17–22. CrossRef
17. Mitakos A, Panderi I. A validated LC method for the determination of clopidogrel in pharmaceutical preparations. J Pharm Biomed Anal. 2002;28(3–4):431–8. CrossRef
18. Vocilkova L, Opatrilova R, Sramek V. Determination of clopidogrel by chromatography. Curr Pharm Anal. 2009;5(4):424–31. CrossRef
19. Javed MK, Iqbal Z, Khan A, Khan A, Shah Y, Ahmad L, Development and validation of HPLC-UV method for the determination of clopidogrel in pharmaceutical dosage form and human plasma. J Liq Chromatogr Relat Technol. 2011;34(18):2118–29. CrossRef
20. Chaudhari PB, Pawar PD, Narkhede KP. Stability indicating spectrophotometric method for determination and validation of Clopidogrel bisulfate in tablet dosage form. Int J Res Ayur Pharm. 2010;1(2):418–23.
21. Srinivas A, Jayapaul B, Madhukar A, Kumar RV. Simple and sensitive analytical method development and validation of clopidogrel by RP-HPLC. Pharm Sci. 2012;1:5–7.
22. Silvestro L, Gheorghe M, Iordachescu A, Ciuca V, Tudoroniu A, Rizea Savu S, et al. Development and validation of an HPLC–MS/MS method to quantify clopidogrel acyl glucuronide, clopidogrel acid metabolite, and clopidogrel in plasma samples avoiding analyte back-conversion. Anal Bioanal Chem. 2011;401:1023–34. CrossRef
23. Liu G, Dong C, Shen W, Lu X, Zhang M, Gui Y, et al. Development and validation of an HPLC–MS/MS method to determine clopidogrel in human plasma. Acta Pharm Sin B. 2016;6(1):55–63. CrossRef
24. Agrawal H, Kaul N, Paradkar AR, Mahadik KR. Stability indicating HPTLC determination of clopidogrel bisulphate as bulk drug and in pharmaceutical dosage form. Talanta. 2003;61(5):581–9. CrossRef
25. Patel RB, Shankar MB, Patel MR, Bhatt KK. Simultaneous estimation of acetylsalicylic acid and clopidogrel bisulfate in pure powder and tablet formulations by high-performance column liquid chromatography and high-performance thin-layer chromatography. J AOAC Int. 2008;91(4):750–5. CrossRef
26. Sinha PK, Damle MC, Bothara KG. A validated stability indicating HPTLC method for determination of aspirin and clopidogrel bisulphate in combined dosage form. Eur J Anal Chem. 2009;4(2):152–60.
27. Tiwari PK, Jain A, Dubey BK, Pandey GK, Dhakad S, Analytical method development and validation for the simultaneous estimation of aspirin, clopidogrel and rosuvastatin in pharmaceutical dosage form. J Drug Deliv Ther. 2019;9(4-s):432–8. CrossRef