INTRODUCTION
When we discuss about sitagliptin (SITA), it is chemically a trizole derivative with pyrazin moeity which exerts its physiological action which is priliminary hypogyclemic action thorugh inhibition of dipeptidyl peptidase-4 system. This active chemical substance is used in combination with diet and exercise in type-2 diabetes either alone or combination with other oral hypoglycemic agents for having potential antidiabetic action (Zerilli and Pyon, 2007). On contrast, dapagliflozin propanediol mnohydrate (DAPA), is chemically an oxane deriavtive with triol moeity and having hypoglycemic action through supression of sodium-glucose cotransporter-2 system, which is again available in combination of other oral hydpogycemic agents oprating on different priciple for better gycemic control (Dhillon, 2019).
Extensive literature search on SITA highlights majorly UV spectroscopy (Pathade et al., 2011; Pritam et al., 2011), high performance liquid chromatography (HPLC) (Patel et al., 2014; Peraman et al., 2013; Ramalingam et al., 2014; Suneetha et al., 2020), LC-MS (Burugula et al., 2013; Reddy et al., 2015), and HPTLC (Manasa et al., 2015; Modi et al., 2013) as analytical methods for analysis from bulk and pharmaceutical dosage form. In similar way, detailed literature review revealed UV (Jani et al., 2015; Mante et al., 2017), HPLC (Deepan et al., 2017, 2018; Sanagapati et al., 2014; Usman et al., 2020), LC-MS (Aubry et al., 2010; El-Zaher et al., 2019), and HPTLC (Abdelrahman et al., 2020; Suma et al., 2019) method for determination of DAPA in bulk and pharmaceutical dosage form.
At present, several clinical trails and literature are sugegstive of better management of glycemic control in type-II diabetes with reduction in glycated haemoglobin when SITA and DAPA are administerd in a combination at a does level of 10 mg of DAPA and 100 mg of SITA (Jabbour et al., 2014; Medical Professionals reference, 2012). The literature survey revealed only one reverse phase high performance liquid chromatography (RP-HPLC) method for quantification of both the components which has serious limitation. Based on above-mentioned facts, it was decided to develop and validate a new, simple, precise and accurate, stability indicating RP-HPLC method for the determination of DAPA and SITA in synthetic mixture.
MATERIALS AND METHODS
Instruments and chemicals
AGILENT (Series 1260 infinity) HPLC unit equipped with autosampler having provision of UV-VIS detector and capable of quaternary gradient operation was used to process the samples, while OPENLAB sofftware was used to process and integrate the obtained chromatogram. The columns employed were INERTSIL ODS C18 and HIBAR ODS C18 having dimensions of 250 mm as length and 4.6 mm internal diameter. Mettler Toledo weighing balance was used to weigh accurate quantities of samples having sensitivity of 0.1 mg.
Both active components were received as gift samples from Cadila Healthcare Limited, Gujarat (Batch No: SA0010119 for SITA and GLI500119 for DAPA) while other solvents like Methyl alchohol, methyl nitrile, KH2PO4 buffer and water were of HPLC grade and procured from Merck life scieces private limited, Mumbai.
Optimization of separation conditions
Discrite intrinsic physico-chemical parameters of active components were studied but atmost priority was given to solubility and pKa value. Other instrumental parameters like flow rate and temperate were also studied to check effect on retention time of eluting components. Owning to the vast difference in polarity of components, ODS C18 column was fixed as stationary phase which encourages the retention of nonpolar and early elution of polar component. To get adequate separation in conjuction with system suitability parameters, various elution systems were studied.
Chromatographic conditions
Adequate separation was achived by utilizing methyl nitrile as organic phase in 25 parts and 75 parts of 0.02 M potassium dihydrogen phosphate buffer containing 1 ml triethylamine (TEA) having neutral pH adjusted by orthophosphoric acid (10%) as aqueous phase. The mixed elution system was screened through 0.45 µ membrane filter and was also utilized as dilution medium for components. The above-methioned elution system was allowed flow though INERTSIL ODS C18 column in isocratic mode at flow rate of 1 ml/minute with monitoring on 210 nm as wavelength where both components gave significant signal. Futhermore, suitability of this system was also assesed by system suitability parameters for which total five injections of fixed concentration was injected at 20 µl injector volume.
Forced degradation conditions
Acid and base hydrolysis
To check the stability with respect to hydrolysis by acidic condition, 5 mg of DAPA and 50 mg of SITA was tretaed with 5 ml of 0.1 N HCl and 4 ml of elution medium, the resulting mixture was refluxed at 60°C for half and hour which was followed by cooling of content and neutralization with 0.1 N NaOH. 0.2 ml of previous solution was further diluted to 10 ml with elution medium (Treated sample). In contrast, for base hydrolysis, 0.1 N NaOH was used as the treatment medium and 0.1 N HCl was used as the neutralizing medium. All other condition were same as that of acid hydrolysis. To compare the results, 0 hour sample and blank was prepared. 20 µl of 0 hour sample and treated sample was injected on to column and comparison was made to determined % degradation.
Oxidative hydrolysis
Effect of oxidative stress was imparted to both drug by use of 3% hydrogen peroxide. Here in this case, 5 mg of DAPA and 50 mg of SITA was tretaed with 5 ml of 3% H2O2 and 4 ml of elution medium, the resulting mixture was refluxed at 60°C for half and hour which was followed by cooling and again volume was adjusted upto the mark. 0.2 ml of the above solution was further diluted to 10 ml with elution medium (treated sample). In similar way, 0 hour sample and blank solution was prepared and were injected on to column to assess the % degrdation achieved.
Thermal hydrolysis
To asses impact of dry heat on the stability of DAPA and SITA, both componets in preweight quatity (10 and 100 mg, respectively) were exposed to dry heat in a hot air oven at 80°C for about half hour. Treated contents were diluted upto 10 ml with mobile phase and 0.1 ml of same solution was further raised to 10 ml which was injected at 20 µl volume on to column to assess % degradation.
Validation of optimized method
All validation parameters are studies as per ICH Q2R1 guidelines, execution procedure of each is discussed below.
Linearity and range
To study linearity and range, accurately weighed quantities of 5 mg DAPA and 50 mg SITA was diluted to 10 ml with elution medium to produce stock solution containing 500 µg/ml DAPA and 5,000 µg/ml of SITA. Various aliquotes were transferred to 10 ml volumetric flask and volume of each raised to 10 ml to give mixtures having concentration of 5 + 50 µg/ml to 15 + 150 µg/ml of DAPA and SITA, respectively. Each concentration was injected at 20 µl injector volume and response obtained was plotted against concentration to observe linear regression coefficient.
Repeatability
For adjudging repeatability of method, each concentration form range was injected for five times and each level is observed for relative standard deviation (RSD).
Limit of detection and quantitation (LOD/LOQ)
Detection limit as well as qunatification limit was calculated statistically by utlization of regression data from repeatability. Standard devidation of standard error (σ) and average of slope (S) were used to process LOD and LOQ.
Accuracy
As it refers to the % recovery of analyte in presence of exipients, it was practiced by spiking of placebo with standard at 50%, 100%, and 150% of target concentration. Each concentration was injected for three times and % recovery was calculated on the basis of onserved area at each spiking level (by utilization of linear regression analysis).
Method precision
This parameter was studies by injecting individual concentration that represents overall range are studies on same day and between days and for the same mixture of DAPA and SITA that represents overall range (8 + 2, 16 + 4, and 24 + 6 µg/ml) were analyzed on the same day at different time interval for intraday precision and different day for interday precision. Each oncentration was analyzed for three times and was monitored for RSD at each level.
Robustness
To study the effect of minor variations of method parameters on to the results, operation parameters like temperature, pH of mobile phase and flow rate was delibrately altered within acceptable range and effect of the same was observed on the system suitability parameters as retention time and % assay, which was also monitored for relative standard devidation.
Ruggedness
This parameters refers to the method repeatability and was studied by utilizing the diffent column having same specification and to be more precise HIBAR ODS C18 column was employed and difference in the area obtained from both was monitored through student t-test.
Assay of synthetic mixture
Weight accurately 10 mg of DAPA, 100 mg of SITA with placebo in 10 ml calibrated volumetric flask. Contents diluted up to 10 ml calibrated volumetric flask with methyl alcohol and filter the solution. 1 ml of master stock solution further dilute up to 10 ml with mobile phase. 1 ml filtrate diluted up to 10 ml with mobile phase (10 + 100 μg/ml). Resulting solution was chromatographed in triplicates and mean observed area was statistically transformed by linear regression equation to get toal % of DATA and SITA in synthetic mixture.
RESULTS AND DISCUSSION
Optimized chromatographic conditions
Initially trials were initiated using combination of methyl nitrile and water in equal proportion but distroted peak without any sort of separation were observed. As separation was not observed in the previous case, methyl alcohol was introduced in to the system but with the same only DAPA was detectd. In all the cases, flow rate was 1.2 ml/minute. All the results were monitored at wavelengths as 210, 224, and 267 nm. Due to previous observed problems, 0.02 M KH2PO4 (0.02 M) containing 1 ml TEA and pH adjusting to 7 by orthophosphoric acid in equal volumes was used as elution medium. Here, both the peak were detected but still were eluting closely to each other. So in the next trial the proportion of buffer was increased and flow rate was further reduced to 1 ml/minute. Even the solution of DAPA and SITA were also prepared in the mobile phase. When method was operated using later discussed chromatographic conditions, well resolved peak of DAPA and SITA was observed at 2.89 and 16.41 minutes, respectively (Fig. 1). The detection wavelength was kept at 210 nm as linearity and peak shape for both the components were perfact at this wavelength. All the system suitability paramerets were within United States Pharmacopoeia guidelines with RSD of less than 1. All the system suitability paramerets have been highlighted in Table 1. The newly developed method was found to be superior to reported method (Gupta and Mishra, 2021) by far degree as they had employed gradient elution with potassium phosphate monobasic buffer pH (3.0) as mobile phase A while methanol and acetonitrile in the ratio of (60:40 v/v) as a mobile phase B. The condition its self is too complex and the flow of elution was kept at 1.5 ml/minute which gives rise to too much column back pressure. Furthermore, the major con of the reported method is that, both DAPA and SITA have the same concentration range, which is quite contrary to the fixed combination dose, and hence the newly developed method outsmarts the reported method in all the segments.
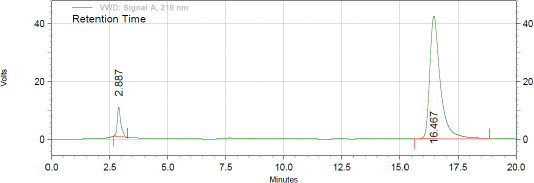 | Figure 1. Chromatogram of mixture of DAPA and SITA under optimized chromatographic conditions. [Click here to view] |
 | Table 1. System suitability parameters for optimized RP-HPLC method. [Click here to view] |
Forced degradation study
When optimized method was apllied for evaluating the stability and behaviour of active components by forced degradation study (acid hydrolysis, base hydrolysis, oxidative stress, and thermal stress), the optimized method was found to be stability indicating as it is able to separate all the degradation products in the presence of active ingridients. No degradation products found to interfere with estimation of DAPA and SITA in stressed samples (Figs. 2–4). Even the stress condition applied for the study were found to be optimim as, % degradation observed was predictive in nature (below 20%). % degradation observed for each condition is highlighted in Table 2.
Validation of analytical method
The proposed optimized RP-HPLC method was studied for validation parameters according to the ICH Q2R1 guidelines and each validation parameter was found to be in accordance with guidelines. Method was found to be linear with linear regression co-efficient of 0.9983 and 0.999 over the range of 5–15 µg/ml of DAPA and 50–150 µg/ml SITA, respectively (Figs. 5–7). Method was found to be robust and rugged as there is no significant change in results (retention time and % assay) by minor variation in method parameters, the same highlighted in Tables 3 and 4. Summary of all validation parameters is highlighted in Table 5. When optimized and validated method was applied for quantitative analysis of synthetic mixture containing DAPA and SITA (Fig. 8), the method gave accurate results with % of DAPA and SITA as 99.43 and 99.41, respectively.
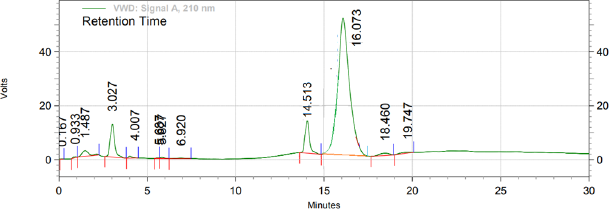 | Figure 2. Chromatogram of treated sample with 0.1 N Hydrochloric acid (acid hydrolysis). [Click here to view] |
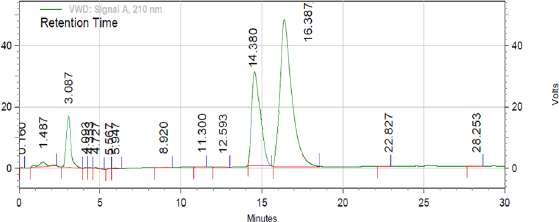 | Figure 3. Chromatogram of treated sample with 0.1 N NaOH (base hydrolysis). [Click here to view] |
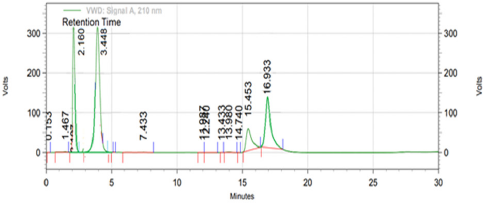 | Figure 4. Chromatogram of treated sample with 3% hydrogen peroxide (oxidative stress). [Click here to view] |
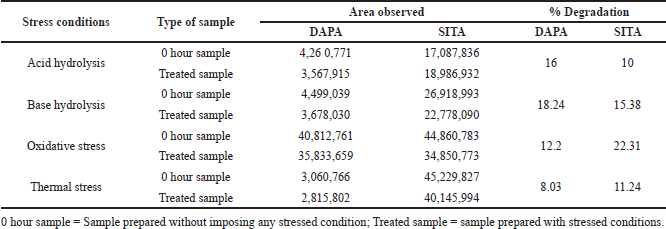 | Table 2. Summary of forced degradation studies. [Click here to view] |
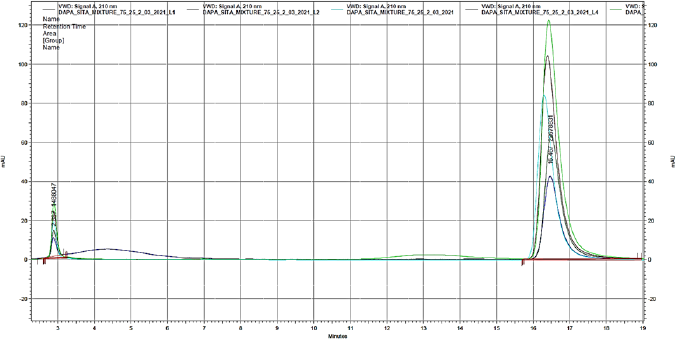 | Figure 5. Overlain chromatogram of mixtures representative of linearity study. [Click here to view] |
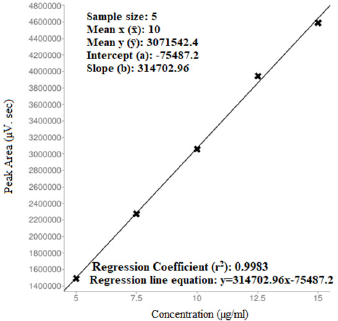 | Figure 6. Regression analysis of DAPA (For linearity studies). [Click here to view] |
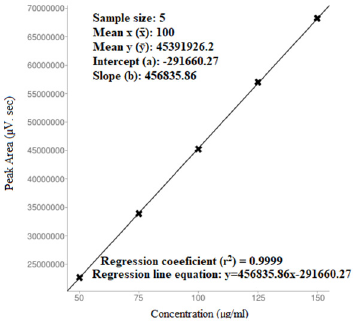 | Figure 7. Regression analysis of SITA (for linearity studies). [Click here to view] |
 | Table 3. Robustness data of optimized RP-HPLC method. [Click here to view] |
 | Table 4. Ruggedness of the developed RP-HPLC method. [Click here to view] |
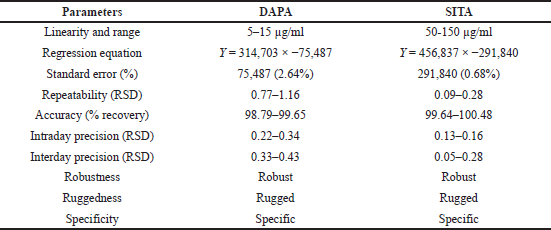 | Table 5. Summary of validation parameters. [Click here to view] |
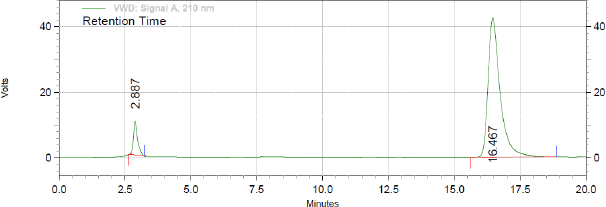 | Figure 8. Assay of synthetic mixture (DAPA and SITA, 10 and 100 μg/ml, respectively). [Click here to view] |
CONCLUSION
As the proposed combination of DAPA and SITA is in clinical phase III, no analytical method is available yet for simultaneous quantitative expression of both the components from synthetic mixture. The proposed stability indicating RP-HPLC method not only separates and quantify the components from synthetic mixture with at most accuracy but also gives idea about the stability of mentioned components under variety of conditions as per ICHQ1 guidelines. It can be concluded that both the components are highly susceptible to oxidative stress and base hydrolysis, and hence formulation of both can be made and packaging material can be employed in such a way that it can be protected from exposure to atmospheric oxygen and exposure to moisture. Finally, method was successfully validated as per ICHQ2R1 guidelines and applied for determination of DAPA and SITA from synthetic mixture.
ACKNOWLEDGMENT
The authors are thankful to Cadila Healthcare Limited, Gujarat for providing gift sample (API) for the development of the method. The authors are thankful to the management of Navjyoti Analytics and research laboratory and Smt. S.M. Shah Pharmacy College, Amsaran, Mahemdabad, Gujarat, India for providing guidance and needed facilities for this work.
FUNDING
There is no funding to report.
CONFLICTS OF INTEREST
The authors report no financial or any other conflicts of interest in this work.
ETHICAL APPROVALS
This study does not involve experiments on animals or human subjects.
DATA AVAILABILITY
All data generated and analyzed are included within this research article.
PUBLISHER’S NOTE
This journal remains neutral with regard to jurisdictional claims in published institutional affiliation.
AUTHOR CONTRIBUTIONS
From execution of research point of view, Pinak Patel is responsible for designing of overall experiment, data acquisition, communication with team members, and preparation of manuscript along. Yesha Patel, Jigna Bhatt, and Binny Mehta are responsible for in depth review of literature and preparing each chemicals/solution and data analysis. Krunal Detholia has a specific role to play for statistical analysis the raw data
REFERENCES
Abdelrahman AE, Maher HM, Alzoman NZ. HPTLC method for the determination of metformin hydrochloride, saxagliptin hydrochloride, and dapagliflozin in pharmaceuticals. Curr Anal Chem, 2020; 16(5):609–19. CrossRef
Aubry AF, Gu H, Magnier R, Morgan L, Xu X, Tirmenstein M, Wang B, Deng Y, Cai J, Couerbe P, Arnold M. Validated LC–MS/MS methods for the determination of dapagliflozin, a sodium-glucose co-transporter 2 inhibitor in normal and ZDF rat plasma. Bioanalysis, 2010; 2(12):2001–9. CrossRef
Burugula L, Mullangi R, Pilli NR, Makula A, Lodagala DS, Kandhagatla R. Simultaneous determination of sitagliptin and simvastatin in human plasma by LC-MS/MS and its application to a human pharmacokinetic study. Biomed Chromatogr, 2013; 27(1):80–7. CrossRef
El-Zaher AA, Hashem HA, Elkady EF, Allam MA. A validated LC-MS/MS bioanalytical method for the simultaneous determination of dapagliflozin or saxagliptin with metformin in human plasma. Microchem, 2019; 149(104017):001–8. CrossRef
Deepan T, Dhanaraju MD. Stability indicating HPLC method for the simultaneous determination of dapagliflozin and saxagliptin in bulk and tablet dosage form. Curr Issues Pharm Med Sci, 2018; 31(1):39–43. CrossRef
Deepan T, Rao MB, Dhanaraju MD. Development of validated stability indicating assay method for simultaneous estimation of metformin and dapagliflozin by RP-HPLC. Eur J Research Appl Sci, 2017; 9(4):189–99.
Dhillon S. Dapagliflozin: a review in type 2 diabetes. Drugs, 2019; 79(10):1135–46. CrossRef
Gupta A, Mishra SK. A novel analytical method for simultaneous quantification of dapagliflozin and sitagliptin by reverse phase high performance liquid chromatography. J Med Pharma All Sci, 2021; 10 I3(1169):2861–65. CrossRef
Jabbour SA, Hardy E, Sugg J, Parikh S, Study 10 Group. Dapagliflozin is effective as add-on therapy to sitagliptin with or without metformin: a 24-week, multicenter, randomized, double-blind, placebo-controlled study. Diabetes Care, 2014; 37(3):740–50. CrossRef
Jani BR, Shah KV, Kapupara PP. Development and validation of UV spectroscopic method for simultaneous estimation of dapagliflozin and metformin hydrochloride in synthetic mixture. IJRDPL, 2015; 4(3):1569–76.
Manasa G, Balekari U, Panga S, Veeresham C. Simultaneous estimation of sitagliptin and metformin in pharmaceuticl formulation by HPTLC. Ethiop Pharm J, 2015; 31(1):63–8. CrossRef
Mante GV, Gupta KR, Hemke AT. Estimation of dapagliflozin from its tablet formulation by UV-spectrophotometry. Pharm Methods, 2017; 8(2):102–7. CrossRef
Modi DK, Parejiya PB, Patel BH. A simple and sensitive HPTLC method for simultaneous determination of metformin hydrochloride and sitagliptin phosphate in tablet dosage form. J Chem, 2013; 2013:001–4. CrossRef
Patel TR, Patel TB, Suhagia BN. Stability indicating RP-HPLC method for simultaneous estimation of simvastatin and sitagliptin in tablet dosage form. Indo Am J Pharm, 2014; 4(04):1993–9. CrossRef
Pathade P, Imran M, Bairagi V, Ahire Y. Development and validation of stability indicating UV spectrophotometric method for the estimation of sitagliptin phosphate in bulk and tablet dosage form. J Pharm Res, 2011; 4(3):871–3.
Peraman R, Gowra CS, Reddy YP, Peruru KK. Stability-indicating RP-HPLC method for simultaneous determination of metformin hydrochloride and sitagliptin phosphate in dosage forms. Chromatographia, 2013; 76(17):1153–62. CrossRef
Phase III study of dapagliflozin in combination with Sitagliptin for type 2 diabetes, 2021. Available via https://www.empr.com/home/news/drugs-in-the-pipeline/phase-3-study-of-dapagliflozin-in-combination-with-sitagliptin-for-type-2-diabetes/
Pritam J, Amar C, Bhargav D, Shani P, Santsaran P, Hiren S, Amol C. Development and validation of first order derivative UV-Spectrophotometric method for determination of Sitagliptin in bulk and in formulation. Int J Drug Dev and Res, 2011; 3(4):194–9.
Ramalingam P, Bhaskar VU, Reddy YP, Kumar KV. Stability-indicating RP-HPLC method for the simultaneous determination of sitagliptin and simvastatin in tablets. Indian J Pharm Sci, 2014; 76(5):407–14.
Reddy S, Ahmed I, Ahmad I, Mukhopadhyay A, Thangam S. Development and validation of a method for simultaneous estimation of metformin and sitagliptin in human plasma by LC–MS-MS and its application in a bioequivalence study. J Chromatogr Sci, 2015; 53(9):1549–56. CrossRef
Suneetha A, Mounika V, Sajid SM. Development and validation of stability indicating RP-HPLC method for the simultaneous estimation of sitagliptin and ertugliflozin in bulk and tablet dosage forms. Asian J Pharm Anal, 2020; 10(2):81–5. CrossRef
Sanagapati M, Lakshmi DK, Reddy NG, Sreenivasa S. Development and validation of stability-indicating RP-HPLC method for determination of dapagliflozin. J Adv Pharm Res, 2014; 4(3):350–4.
Suma BV, Deveswaran R, Premnath SH. A new high-performance thin layer chromatographic method development and validation of dapagliflozin in bulk and tablet dosage form. Int J Pharm Pharm Sci, 2019; 11:58–63. CrossRef
Usman MR, Ahmad S, Deore C, Shaikh T, Jain B, Imran M. Stability indicating RP-HPLC method for determination of saxagliptin and dapagliflozin in bulk and tablet dosage forms. J Pharm Sci Res, 2020; 12(4):499–506.
Zerilli T, Pyon EY. Sitagliptin phosphate: a DPP-4 inhibitor for the treatment of type 2 diabetes mellitus. Clin Ther, 2007; 29(12):2614–34. CrossRef