INTRODUCTION
Ranitidine drug is for the gastrointestinal diseases, its IUPAC name is N-(2-[(5-[(Dimethylamino)methyl]furan-2-yl)methylthio]ethyl)-N?-methyl-2-nitroethene-1,1-diamine (Mitchard et al., 1987). Ranitidine drug exists in the ranitidine HCl salt for formulation, the dosage forms of ranitidine were tablets and capsules, their strengths were 75, 150, and 300 mg. Hence, the maximum daily dosage for ranitidine HCl is 300 mg/day; the N-Nitrosodimethylamine (NDMA) limit will be 0.32 ppm: Ranitidine blocks the histamine H2 receptor, it can decrease the acid secretions in the stomach, which in turn control the formation of ulcers in stomach. It is also treat for heartburn, erosive esophagitis, and zollinger Ellison syndrome (https://www.rxlist.com/zantac-side-effects-drug-center.htm). The ranitidine HCl exists as two polymorphs as reported so far, the melting point of form I is 134°C–140°C and form II is 140°C–144°C (Wu et al., 2000). The synthetic route of ranitidine HCl involves the dimethyl amine, which is a key starting material for the ranitidine compound Figure 1 and also it is precursor for NDMA impurity formation during the synthesis (Choi and Valentine, 2002; https://www.who.int/medicines/publications/drugalerts/InformationNoteNitrosamine-impurities_Nov2019; Krasner et al., 2013; Liu et al., 2014; Mitch and Schreiber, 2008; Mitch and Sedlak, 2004; Sharma et al., 2011).
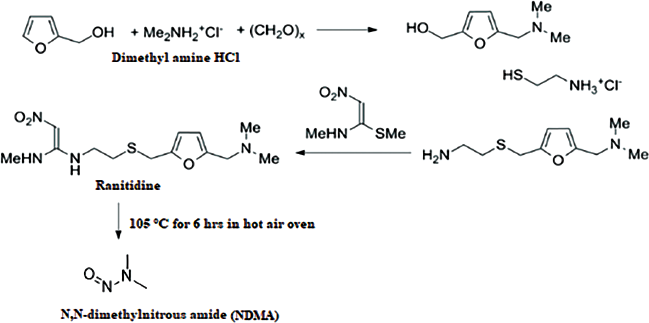 | Figure 1. Synthetic scheme of ranitidine. [Click here to view] |
NDMA is potential carcinogen, which is forming from synthesis of drug substance as byproduct and also forming from the presence of NaNO2/HNO3 and secondary amines (e.g. dimethyl amines, diethyl amine etc.,), which should be controlled in the medication of the human beings. Hence, robust and sensitive analytical method should require controlling the nitroso amine impurities in drugs (http://www.edqm.eu/sites/default/files/omcl-method-determination-ndma-valsartan-cvuaseptember2018.pdf,2018; https://www.agilent.com/cs/library/posters/public/Agilent_ASMS_2019_ThP762_Poster.pdf.2019; Lim et al., 2020; Shaikh et al., 2020; USFDA, 2020a, 2020b). Many chromatography and mass spectrometric methods are available to quantify the NDMA in drug substance and drug product (Health Canada, 2020; Singapore Health Sciences Authority, 2019; The General European OMCL Network, 2020a, 2020b; USFDA, 2018, 2020c, 2020d, 2020e; US Environmental Protection Agency, 2004). But no analytical method have fully validated such specificity, robustness, rugged ness and also for degradation/stress study for NDMA production form ranitidine HCl as drug substance (form-I and form-II) and drug product. The author has proposed stress study for ranitidine drug substance (form-I and form-II), drug product (tablets and capsules), and it was shown the NDMA determination in each stress conditions. The full length validation has been performed for NDMA in ranitidine drug substance (form-I and form-II), ranitidine drug product (tablets and capsules) along with different strengths.
MATERIALS AND METHODS
Materials
The NDMA, N-Nitrosodiethylamine (NDEA), N-Nitroso-N-methyl-4-aminobutyric acid/N-Nitrosodibutylamine (NMBA), N-Nitrosodibutylamine (NDBA) N-Nitrosodiisopropylamine (NDIPA), and N-Nitrosoisopropylethylamine standards were purchased from PS3 Laboratories LLP, Hyderabad, India. Millipore Milli Q purification system was used from Bangalore, India. Analytical reagent grade, methanol, sodium hydroxide, hydrochloric acid, and hydrogen peroxide were purchased from Rankem (Mumbai, India). Millipore Milli Q purification system purchased from Bangalore, India
Equipment
Waters I-class flow through needle ultra-performance liquid chromatography (UPLC) connected with AB-Sciex 4500 mass and the data evaluation monitor with analyst 1.6.3 software.
Method
UPLC method conditions
Chromatographic separation achieved from mobile phase A: 0.1% formic acid in water, mobile phase B: 100% methanol, column: ACE C18-AR 3 µm, 150 × 4.6 mm, gradient (time/% mobile phase B): 0/3, 3/3, 15/15, 15.1/100, 17/100, 17.1/3, 22/3, flow: 0.8 ml/minute, injection volume: 50 µl, run time: 22 minutes, column temperature: 40°C, detection: photo diode array (205–300), diluent: water, retention time: about 6.8 minutes.
Mass conditions
Mass response achieved by scan type of multiple reaction monitoring (MRM) pair [Q1 Mass (Da):75 Q3:58.2, dwell time in mseconds]: 200, polarity: positive atmospheric chemical ionization (APCI), duration: 22.00 minutes, curtain gas: 30 l, nebulizer Current (NC): 2 V, temperature: 350°C, ion source gas: 55, charged aerosol detector: medium, declustering potential (DP): 50 V, entrance potential (EP): 10 V, collision energy (CE): 18, and collision cell exit potential (CXP): 9. The mass diversion with time and position were (time in minute/position of mass or waste) 2.3 minute/A to mass, 8.0 minute/B to waste, 15.0 minute/B to waste, 15.1 minute/B to mass, 20.0 minute/B to mass.
 | Table 1. System suitability injection sequence. [Click here to view] |
Preparation of standard and sample solutions
Preparation of NDMA stock-1 solution. Weigh about 50.0 mg of NDMA standard into a 50 ml volumetric flask containing 10 ml of methanol, dissolve by cyclomix, make up to the mark with methanol and cyclomix.
Preparation of stock-2 solution. Transfer 0.5 ml of stock-1 into a 50 ml volumetric flask containing 10 ml of water, make up to the mark with water and cyclomix.
Preparation of calibration curve solutions. Prepare linearity solutions ranging from 0.03 to 20 ppm (i.e., 0.03, 1.0, 5.0, 10.0, and 20.0 ppm) with respect to analyte concentration.
Preparation of test sample solution for drug substance. Weigh about 75 mg of Ranitidine HCl test sample and transfer into 5 ml volumetric flask, dissolve by water and sonication, make up to the mark with water and cyclomix.
Preparation of test sample solution for drug product (tablet). Crush the appropriate number of tablets to obtain target concentration of 15 mg/ml of drug substance in water and transfer into volumetric flask (50 ml), add appropriate volume of water and mix for about a minute by using vertex mixture. Shake the sample for 40 minutes using rotatory shaker.
After extraction centrifuge, the sample for 15 minutes at 4,000 rpm, filter the supernatant by using a 0.22 µm syringe filter, discard first 1 ml, and transfer the filtered sample into a vial for liquid chromatography-mass spectrometry (LC-MS) analysis.
Preparation of test sample solution for drug product (capsule). Take the appropriate quantity of capsule powder to obtain target concentration of 15 mg/ml of API in water and transfer into volumetric flask (50 ml), add appropriate volume of diluent and mix for about a minute by using vertex mixture. Shake the sample for 40 minutes using the rotatory shaker.
After extraction centrifuge the sample for 15 minutes at 4,000 rpm, filter the supernatant by using a 0.22 µm syringe filter, discard first 1 ml, and transfer the filtered sample into a vial for LC-MS analysis.
Procedure. Equilibrate the LC-MS system with the mobile phase. Inject the prepared solutions into the LC-MS system as given in Table 1 and the typical standard chromatogram was shown in Figure 2.
Data evaluation. Integrate the NDMA peak only in standard and test sample.
System suitability evaluation. The correlation coefficient of the linearity solution should not be less than 0.99.
Result reporting. I. If the area of NDMA in test sample is observed less than the area of 1 ppm linearity solution then calculate the content by using three point linearity standards, i.e., 0.03, 1 and 5 ppm.
II. If the area of NDMA in test sample is observed more than the area of 1 ppm linearity solution then calculate the content by using five point linearity standards, i.e., 0.03, 1, 5, 10, and 20 ppm.
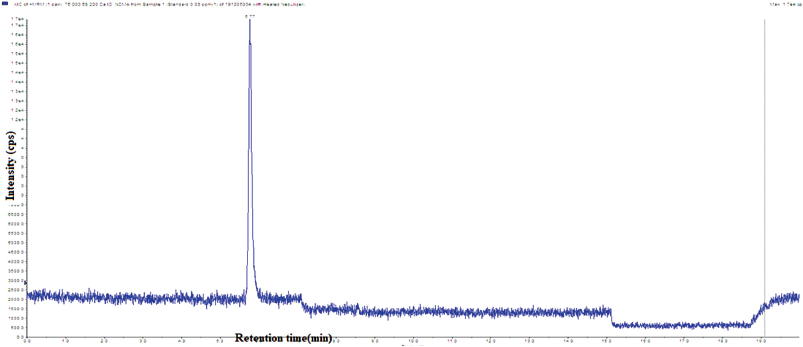 | Figure 2. System suitability total ion chromatogram of NDMA. [Click here to view] |
For drug substance. Calculate the content of NDMA using the straight line equation Y = mX + C (linearity) for each test solution and report the value of NDMA content.
Content of NDMA ( ppm) = (Y – C / m) × (75/Wt)
where,
Y = Area of test sample
C = Intercept
m = Slope
Wt = Weight of test sample taken in mg.
Drug product (tablets). Calculate the content of NDMA using the straight line equation Y = mX + C (linearity) for each test solution and report the value of NDMA content.
Content of NDMA ( ppm) = (Y – C / m) × ( Weight equivalent of tablets /Wt taken)
where,
Y = Area of test sample
C = Intercept
m = Slope
Wt = Weight of test sample taken in mg.
Drug product (capsules). Calculate the content of NDMA using the straight line equation Y = mX + C (linearity) for each test solution and report the value of NDMA content.
Content of NDMA ( ppm) = (Y – C / m) × ( Weight equivalent of capsules /Wt taken)
where,
Y = Area of test sample
C = Intercept
m = Slope
Wt = Weight of test sample taken in mg
RESULTS AND DISCUSSION
LC-MS method development
The objective of the method development includes the selection of different stationary phase columns for separations of NDMA impurity from the ranitidine drug substance as well as excipients and low level detection of NDMA in presence of ranitidine drug substance and drug product. The following trials have been conducted to achieve defined objective. The objective of development trial 1 was to solubilize the ranitidine drug substance as well as the drug product. The ranitidine was freely soluble in water, and also freely soluble in methanol due to HCl salt. This was very suitable for the LC separation of NDMA in presence of ranitidine HCl. The tablets and capsules were not soluble in presence of separate water and methanol but drug substance was soluble. Hence, the water was selected for diluent, the solvent study has been screened to understand the NDMA peak retention in C18 column, only water and hexa fluoro isopropanol can have best retention in C18 column. The objective of trial 2 was to select the stationary phase to separate the NDMA along with other nitroso impurities in presence of drug substances and drug product (ranitidine HCl along with excipients). The stationary phase from polar to non-polar column was screened for the defined separation; the NDMA was separated from remaining in ACE 18 column. The objective of the trial 3 was to fix the sample concentration to achieve the 0.01 ppm limit ofa quantitation (LOQ) with more than 3 S/N. The 0.01 ppm response was observed with 20, 30, 40, and 50 mg ml−1 sample concentration, but the % recovery was not with in the regulatory requirement [as per United States of Pharmacopeia (USP), the % recovery should be 70–130], finally the chosen 15 mg ml−1 where % recovery was achieved. The objective of the trial 4 was to select the mobile phase and gradient. Best separation was achieved by ACE 18 column with mobile phase A as 0.01% formic acid water and mobile phase B as acetonitrile and water ratio as 50:50% v/v with gradient of Time/% mobile phase B as 0/8, 5/8, 8/20, 10/100, 15/100, 15.1/8, and 20/8.
Mass parameters optimization
The objective of the mass optimization was to establish the DP, EP, CE, and CXP for the NDMA as well as the source parameters, initially the electro spray ionization source was chosen for mass checking, the NDMA response was poor and many adducts were observed and then change to APCI source. The protonated mass number of NDMA was. 75.4 m/z. The observed DP, EP for NDMA was 75.4 and 50, respectively. The product ions of precursor were 58.0 at 8 CE and 19 CXP. The source parameters were set as curtain gas as 30, NC as 2, GS1 (nebulizing gas) as 55. The observed MRM pair was 75 → 58.2.
LC-MS method optimization
The objective of the method optimization was to demonstrate the limit of detection LOD and LOQ and check the recovery at LOQ in drug substance (form I and form II) as well as the drug product (tablets and capsules). The mobile phase B was changed from the mixer of water and acetonitrile to 100% methanol for separating the tablets having peaks and the chosen injection volume for this study was 50 µl to achieve the 0.01 ppm. The diverter parameters for mass and sample procedure was set for better recovery of NDMA in presence of excipients and degradation peaks. The finalized method evaluated procedure was followed as per Procedure Section.
Method validation
The final developed and optimized method has been validated against the International Council for Harmonisation (ICH) Q2 (R1) and USP general chapter for compendial method validation <1225> (USP General Chapter <1225>). The method validation was performed by considering the specificity, precision, linearity, robustness, and ruggedness. The validation results were accepted by major regulatory bodies in the world.
Specificity
The specificity of developed method was proved by injecting NDEA, NMBA, NDIPA, NDBA and NIEPA along with NDMA. The other nitroso impurities were not co-eluting with the NDMA impurity. The stress study/degradation study has been performed to prove the method specificity.
Forced degradation study sample preparation
Taken 1.5 g equivalent powder of ranitidine in 100 ml volumetric flask containing 50 ml of diluent, sonicated for 20 minutes with intermediate shaking by maintaining temperature below 25°C. After sonication, added degradation solutions as mentioned below for exposure. Added neutralizing solution and made up to the mark with diluent (100 ml). Centrifuged the sample at 4,000 rpm for 10 minutes. The thermal degradation sample was injected in system after attaining to room temperature (below 25°C).
Degradation solutions
Acid stress—5 ml of 1 N HCl at 60°C for 5 hours.
Peroxide stress—5 ml of 1% H2O2 on bench top for 2 hours.
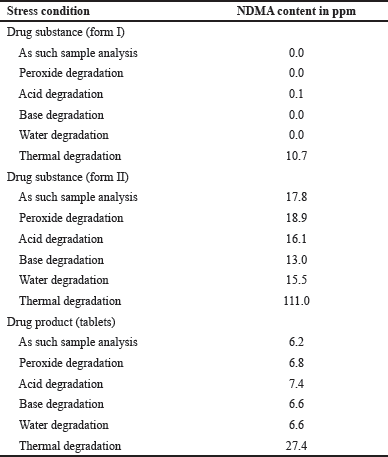 | Table 2. Degradation study of ranitidine. [Click here to view] |
Water stress—5 ml of water at 60°C for 5 hours.
Thermal sample—Samples were exposed at 105°C for 6 hours.
Base stress—5 ml of 1 N NaOH at 60°C for 5 hours.
The NDMA formation was observed only in the thermal samples of drug substance and drug product (forms I, form II, capsules, and tablets). The specificity results were captured in the Table 2.
Precision
Method precision has been performed by injecting six different measurements same drug substance as well as drug product with NDMA spiking 10 ppm in drug substance and 0.2 ppm in the drug product. The obtained results were less than 3% relative standard deviation (RSD). The typical method precision total ion chromatogram (TIC) and UV chromatogram of drug substance were captured in Figure 3.
Accuracy/recovery
Accuracy has been performed by three measurements of same drug substance as well as drug product with NDMA spiking 10 ppm in drug substance and 0.2 ppm in the drug product, the accuracy has been calculated against the test sample. The obtained results were less than 72.3%–98.6%. The typical accuracy TIC and UV chromatogram of spiked at 0.2 ppm of tablet and capsule were shown in Figures 4 and 5.
Linearity
Linearity is the range of the analyte that can be detected in the test sample. Linearity of the developed method has been done from 0.03 to 20 ppm. The different geographical samples are falls in the range of the linearity of the method. The correlation coefficient for the linearity was 0.9998. The calibration graph was captured in b.
LOD and limit of quantification
LOD is lowest amount of analyte present in the sample, it can be detected. LOQ is the lowest amount of analyte present in the sample, it can be quantified and it should be accurate and precise at that level. The LOQ and LOQ has been established by using the S/N method. The S/N ratios of LOD and LOQ met the ICH guidelines. The LOD and LOQ ion chromatogram was captured in Figures 7 and 8, and results were captured in Table 3.
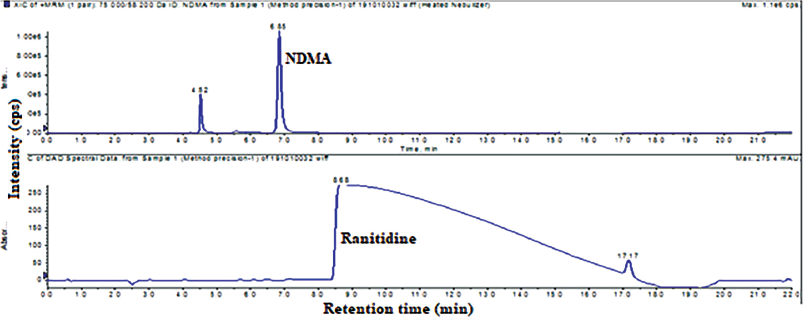 | Figure 3. Typical method precision total ion chromatogram and UV chromatogram of NDMA and ranitidine HCl drug substance. [Click here to view] |
 | Figure 4. Typical method precision total ion chromatogram and UV chromatogram of NDMA and ranitidine HCl drug product (tablets). [Click here to view] |
 | Figure 5. Typical method precision total ion chromatogram and UV chromatogram of NDMA and ranitidine HCl drug product (capsules). [Click here to view] |
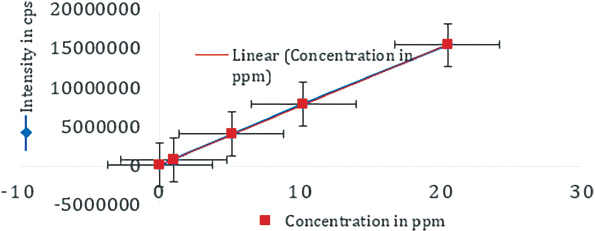 | Figure 6. Linearity plot of NDMA. [Click here to view] |
 | Table 3. Results of LOD and LOQ. [Click here to view] |
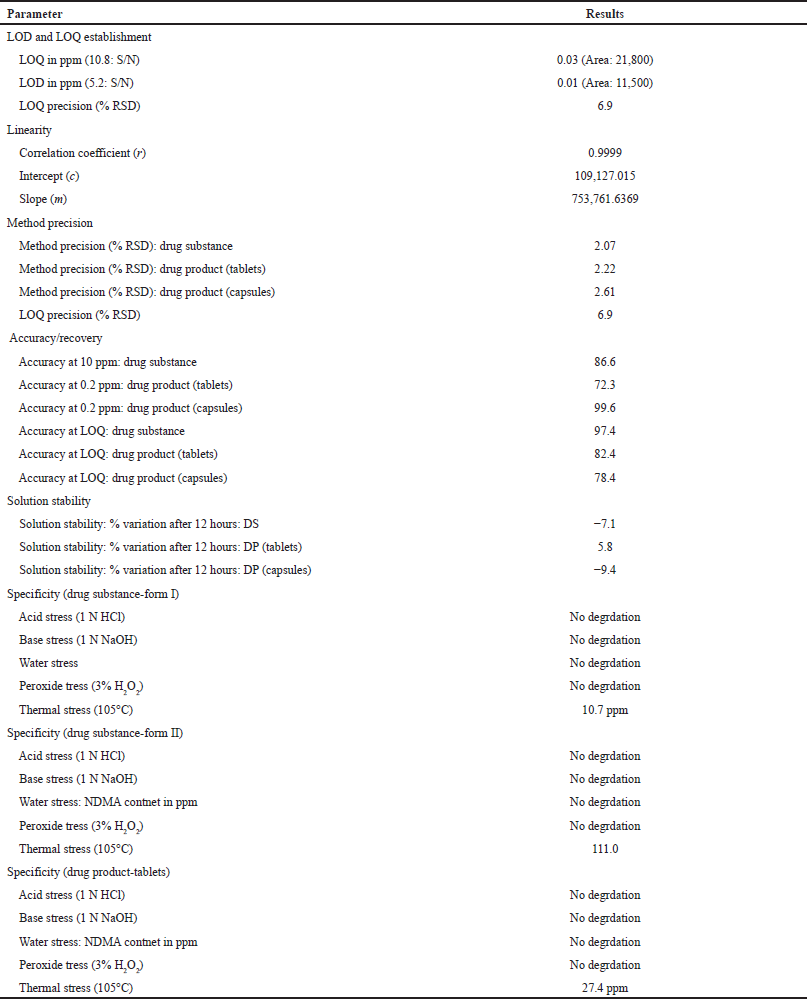 | Table 4. Summary of validation. [Click here to view] |
 | Figure 7. The total ion chromatogram of LOD solution. [Click here to view] |
 | Figure 8. The total ion chromatogram of LOQ solution. [Click here to view] |
Precision and accuracy at LOQ
Injected the blank, precision at six LOQ solutions single time into LCMS. Recorded the peak area of NDMA and calculated the % RSD for the area from precision at LOQ solutions. The LOQ recovery was performed by injecting the three spiked solutions against the blank solution.
Solution stability
The solution stability for NDMA standard and spiked sample was established up to the 12 hours. The solutions were injected into LC-MS at zero hour (initial) and after 12 hours. At each interval the NDMA content was recorded and the difference with respect to NDMA obtained at initial interval was calculated. The obtained results were within 10% variation.
Selectivity
Injected actual quantity of placebo present in capsules and tablets in to the LC-MS/MS instrument as per method of analysis and also injected diluent. The validation summary was captured in Table 4.
CONCLUSION
From the above data of method development and validation, it is concluded that the method which is designed to determine NDMA content in Ranitidine drug substance and drug product found to be precise, accurate, and linear. LOQ of the NDMA impurity was found to be 0.03 ppm. The method found to be precise and accurate at LOQ level. LOD of the NDMA impurity found to be 0.01 ppm. Solution stability of test sample solution was established up to 12 hours in room temperature, and it was found stable and specific with placebo. The degradation study was performed to understand the NDMA formation from ranitidine drug substance and drug product. The NDMA formation from ranitidine drug substance and drug product was found under thermal degradation. This LC-MS/MS method can be employed for regular analysis, based on the development and validation of NDMA in drug substance and drug product as well as stress study of ranitidine drug substance and drug product by LC-MS/MS.
AUTHOR CONTRIBUTIONS
All authors made substantial contributions to conception and design, acquisition of data, or analysis and interpretation of data; took part in drafting the article or revising it critically for important intellectual content; agreed to submit to the current journal; gave final approval of the version to be published; and agree to be accountable for all aspects of the work. All the authors are eligible to be an author as per the international committee of medical journal editors (ICMJE) requirements/guidelines.
FUNDING
There is no funding to report.
CONFLICTS OF INTEREST
The authors report no financial or any other conflicts of interest in this work.
ETHICAL APPROVALS
This study does not involve experiments on animals or human subjects.
DATA AVAILABILITY
All data generated and analyzed are included within this research article.
PUBLISHER’S NOTE
This journal remains neutral with regard to jurisdictional claims in published institutional affiliation.
REFERENCES
Choi J, Valentine RL. Formation of N-nitrosodimethylamine (NDMA) from reaction of monochloramine: a new disinfection by product. Water Res, 2002; 36:817–24. CrossRef
USP General Chapter <1225>. General Information (1225) Validation of compendial procedures. First SupplementtoUSP43-NF38, November 1, 2019.
Health Canada. Determination of N-Nitrosodimethylamine (NDMA) and N-Nitrosodiethylamine (NDEA) by GC-MS-MS (direct injection) in Sartan finished products and drug substances. 2020. Available via https://www.canada.ca/en/health-canada/services/drugs-health-products/compliance-enforcement/information-healthproduct/drugs/angiotensin-receptor-blocker.html (Accessed 10 April 2020).
ICH Q2 (R1). International Conference on Harmonisation of technical requirements for registration of pharmaceuticals for human use. ICH harmonised tripartite guideline validation of analytical procedures: text and methodology Q2 (R1), step4, 2005. Geneva, Switzerland, 2005.
Krasner SW, Mitch WA, McCurry DL, Hanigan D, Westerhoff P. Formation, precursors, control, and occurrence of nitrosamines in drinking water: a review. Water Res, 2013; 47:4433–50. CrossRef
Lim HH, Oh YS, Shin HS. Determination of N nitroso dimethylamine and N-nitroso methyl ethylamine in drug substances and products of sartans, metformin and ranitidine by precipitation and solid phaseextraction and gas chromatography–tandem mass spectrometry. J Pharm Biomed Anal, 2020; 189:113460. CrossRef
Liu YD, Selbes M, Zeng C, Zhong R, Karanfil T. Formation Mechanism of NDMA from ranitidine, trimethylamine, and other tertiary amines during chloramination: a computational study. Environ Sci Technol, 2014; 48:8653–63. CrossRef
Mitch WA, Schreiber IM. Degradation of tertiary alkylamines during chlorination/chloramination: implications for formation of aldehydes, nitriles, halonitroalkanes, and nitrosamines. Environ Sci Technol, 2008; 42:4811–7. CrossRef
Mitch WA, Sedlak DL. Characterization and fate of N-nitrosodimethylamine precursors in municipal wastewater treatment plants. Environ Sci Technol, 2004; 38:1445–54. CrossRef
Mitchard M, Harris A, Mullinger BM. Ranitidine drug interactions-a literature review. Pharmacol Ther, 1987; 32:293–325. CrossRef
Sharma N, Singh RAO S, Reddy PS, Malleswara Reddy A. A validated stability-indicating liquid-chromatographic method for ranitidine hydrochloride in liquid oral dosage form. Sci Pharm, 2011; 79:309–22. CrossRef
Shaikh T, Gosar A, Sayyed H. Nitrosamine impurities in drug substances and drug products. J Adv Pharm Pract, 2020; 2:48–57.
Singapore Health Sciences Authority. Determination of n-nitroso dimethylamine (NDMA) in metformin products by HRAM-GCMS. 2019. Available via https://www.hsa.gov.sg/,2019
The General European OMCL Network. DI-GC-MS. 2020a. Available via https://www.edqm.eu/sites/default/files/31 pv 163 nitrosamine in sartans en draft swissmedic v2.pdf (Accessed 10 April 2020).
The General European OMCL Network. HS GC-MS method for the determination of NDMA and NDEA in Sartan. 2020b. Available via https://www.edqm.eu/sites/default/files/medias/fichiers/Sartans/de-by-gc-ms.pdf (Accessed 10 April 2020).
US Environmental Protection Agency. Method 521: determination of nitrosamines in drinking water by solid phase extraction and capillary column gas chromatography with large volume injection and chemical ionization tandem mass spectrometry (MS/MS). EPA/600/R-05/054, 2004. Available via http://www.epa.gov/nerlcwww/m 521.pdf, 2004
USFDA. RapidFire-MS/MS method, a method that can detect NEIPA, NDIPA, NDBA, and NMBA. 2020a. Available via https://www.fda.gov/media/125477/download (Accessed 10 April 2020).
USFDA. LC-HRMS method, a method that can detect NDMA, NDEA, NEIPA, NDIPA, NDBA, and NMBA. 2020b. Available via https://www.fda.gov/media/125478/download (Accessed 10 April 2020).
USFDA. Liquid chromatography-high resolution mass spectrometry (LC-HRMS) method for the determination of NDMA in ranitidine drug substance and drug product. 2020c. Available via https://www.fda.gov/media/130801/download (Accessed 10 April 2020).
USFDA. Liquid chromatography-high resolution mass spectrometry (LC-HRMS) method for the determination of NDMA in metformin drug substance and drug product. 2020d. Available via https://www.fda.gov/media/134914/download (Accessed 10 April 2020).
USFDA. GC/MS headspace method for detection of NDMA in Valsartan drug substance. 2018. Available via https://www.fda.gov/downloads/Drugs/DrugSafety/UCM618053.pdf, 2018
USFDA. Combined Direct Injection N-Nitrosodimethylamine (NDMA), N-Nitrosodiethylamine (NDEA), N-Nitrosoethylisopropylamine (NEIPA), N-Nitrosodiisopropylamine (NDIPA), and N-Nitrosodibutylamine (NDBA) Impurity Assay by GC-MS/MS. 2020e. Available via https://www.fda.gov/media/123409/download (Accessed 10 April 2020).
Wu V, Rades T, Saville DJ. Stability of polymorphic forms of ranitidine hydrochloride. Pharmazie, 2000; 255:508–12.
https://www.rxlist.com/zantac-side-effects-drug-center.htm
https://www.who.int/medicines/publications/drugalerts/InformationNoteNitrosamine-impurities_Nov2019.pdf?ua=1
http://www.edqm.eu/sites/default/files/omcl-method-determination-ndma-valsartan-cvua-september2018.pdf,2018
https://www.agilent.com/cs/library/posters/public/Agilent_ASMS_2019_ThP762_Poster.pdf, 2019