INTRODUCTION
Diosmin is a monomethoxy flavone, a monooxy flavone, a rutinoside, a disaccharide derivative, and a dihydroxy flavanone. It is a bioflavonoid that may be produced from hesperidin or extracted from different plants [1]. It is used to treat hemorrhoids and capillary fragility, particularly chronic venous insufficiency (CVI) [2]. Hesperidin is a disaccharide derivative, a member of 3′-hydroxy flavanones, a dihydroxy flavanone, a monomethoxy flavanone, a flavanone glycoside, a member of 4′-methoxy flavanones, and a rutinoside. It is functionally related to hesperidin. Hesperidin is a flavan-on glycoside found in citrus fruits [3]. Hesperidin is most frequently used to treat blood vessel disorders including hemorrhoids, varicose veins, and impaired circulation (venous stasis), either by itself or in combination with other citrus bioflavonoids (such as diosmin) [4]. Structures of diosmin and hesperidin are shown in Figure 1 [5,6].
Method development can be an extended process that requires researchers’ valuable time. The processes tend to be created utilizing the one factor at a time (OFAT) method, which entails adjusting one variable at a time until the desired result is achieved. This process of method development is systematic, but it takes time [7]. A quality by design (QbD) technique uses statistical design of experiments (DOE) to create a “design space” for a robust procedure. The design space defines the experimental region in which changes to technique parameters have no significant effect on the results [8].
analytical quality by design (AQbD) begins with a systematic knowledge of the underlying interaction(s) among the many variables involved in the analysis, followed by early risk assessment studies to identify anticipated essential critical process parameters [9]. Following that, factor screening studies are conducted to determine the influential variables, which are then used to optimize the procedure to yield the desired chromatographic solution [10]. There are very few analytical techniques are reported for estimating diosmin and hesperidin [11,12]. However, no QbD-based reverse phase-high performance liquid chromatography (RP-HPLC) technique for diosmin and hesperidin has been disclosed to date. As a result, the present study was designed for simultaneous QbD-based RP-HPLC estimation of diosmin and hesperidin. The main focus of the goal of the study was to use QbD concepts to create a more scientific and risk-based strategy. for identifying the critical variables for optimizing a stability-indicating HPLC method for diosmin and hesperidin.
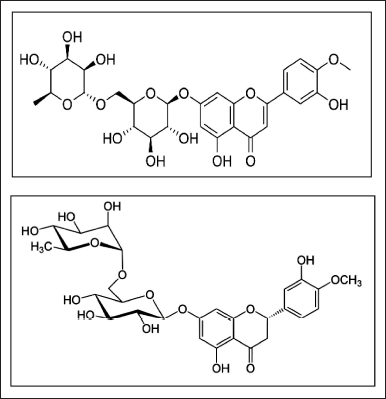 | Figure 1. Structures of diosmin and hesperidin. [Click here to view] |
MATERIALS AND METHODS
Instrumentation and software
Software: Design Expert software 12.0 version.
HPLC (WATERS—2695) with photodiode array detector detector.
Materials
Diosmin and hesperidin were provided by Biocon. All other reagents and chemicals were used HPLC grade procured from Rankem.
Preparation of solutions
Preparation of standard solution
5 mg of hesperidin and 45 mg of diosmin working standards were carefully weighed and placed in a 10 ml sterilized volumetric flask. The solvent has been added and sonicated until completely dissolved. The volume was then brought up to the required level using the same diluent (stock resolution). Pipetted 1 ml of the above solutions into a volumetric flask with a 10 ml capacity, then added diluent to the mark (50 ppm of hesperidin, 450 ppm of diosmin).
Sample solution preparation
As per the label claim, the composition of diosmin and hesperidin is, respectively, 450 and 50 mg. 52 mg of hesperidin and diosmin sample was precisely weighed and placed into a 10 ml sterilized volumetric flask. The solvent was added, sonicated for up to 30 minutes, centrifuged for 30 minutes to complete dissolution, and then added diluent to the desired volume. After that, the solution was filtered using a 0.45-μ injection filter. 1 ml of the above solution was pipetted into a 10 ml volumetric flask and added diluents to make it the final concentration of 50 ppm of hesperidin and 450 ppm a of diosmin.
Method optimization by applying DOE
The DOE was made using Design-Expert version 12.0 software. (Stat-Ease Inc., Minneapolis, MN, USA). Central composite design (CCD) was used to optimize the method with two variables, and three responses were identified as ideal conditions for the method. 13 experimental runs were obtained.
Method operable design region (MODR) establishment
After completing the intended experimental runs in accordance with the CCD, the data were analyzed using regression models and factor-response relationships to produce the MODR. Depending on the provided aim or objective of each critical quality attribute (CQA) on the basis of desirability, the created MODR was used to forecast the optimal chromatographic conditions.
Validation of the optimized method
According to International Conference on Harmonisation (ICH) Q2 (R1) requirements, the RP-HPLC method was validated with different parameters such as system compatibility, linearity, LOD, limit of quantitation (LOQ), intra-day precision, inter-day precision, accuracy, and robustness of the presented approach was all thoroughly validated [13,14].
Forced degradation (FD) studies
As per limit of detection (LOD) (Q1A and Q1B) guidelines, FD studies were carried out by exposing the sample to relevant stress conditions like hydrolysis, acid degradation, alkali degradation, oxidation, reduction, thermal, and photolytic degradation were analyzed by HPLC [15].
RESULTS AND DISCUSSION
Preliminary trails
Better separation was observed by using acetonitrile: KH2PO4 in the ratio of 55:45 at 222 nm trails were mentioned in Table 1.
Method optimization by QbD
Factors
Based on these preliminary trials, independent and dependent variables were selected. Independent variables are mobile phase composition and pH, dependent variables are plate count of peak 1, resolution, and tailing factor of peak 1 shown in Table 2.
 | Table 1. Preliminary Trails. [Click here to view] |
 | Table 2. Analytical Target Profile. [Click here to view] |
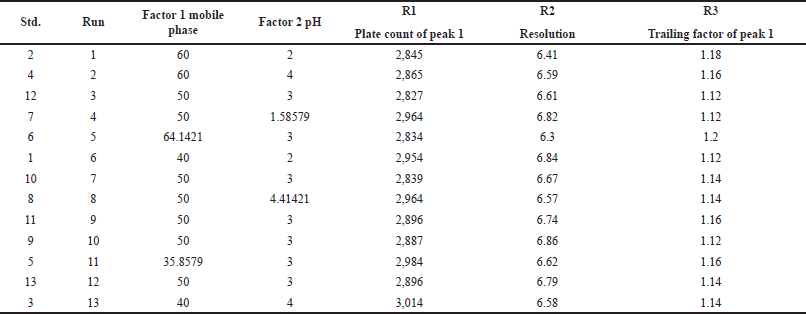 | Table 3. QbD runs given by CCD. [Click here to view] |
Experimental runs obtained from CCD
13 experimental runs were obtained from CCD using a 23 factorial design. Out of 13 runs, the sixth run was chosen for optimization. Results are shown in Table 3.
Analysis of variance (ANOVA) for quadratic model
The responses were optimized by ANOVA (Table 4).
Based on this statistical expression p-value is less than the F-value, which shows an insignificant effect for lack of fit. The p-value should be less than 0.2 it shows a significant effect on the model. Fit statistics represent the adjusted and predicted R2 values the difference between these two values is less than 0.2.
The residual plots represent the relationship between factors and responses. In R1 (Fig. 2A) the plate count was increased by reducing the mobile phase and increasing the pH. Figure 2B indicated that resolution was increased when decreasing the mobile phase and pH. In R3 (Fig. 2C) the tailing factor was decreased when decreasing the mobile phase and pH.
Based on the Desirability, the optimized chromatographic conditions were selected. The highest desirability showed as 0.869.
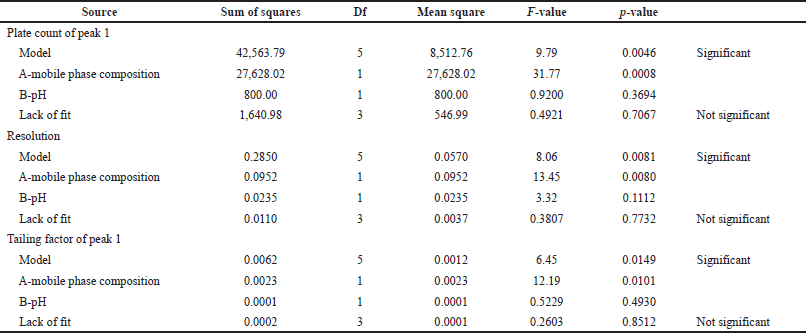 | Table 4. Statistical parameters of ANOVA. [Click here to view] |
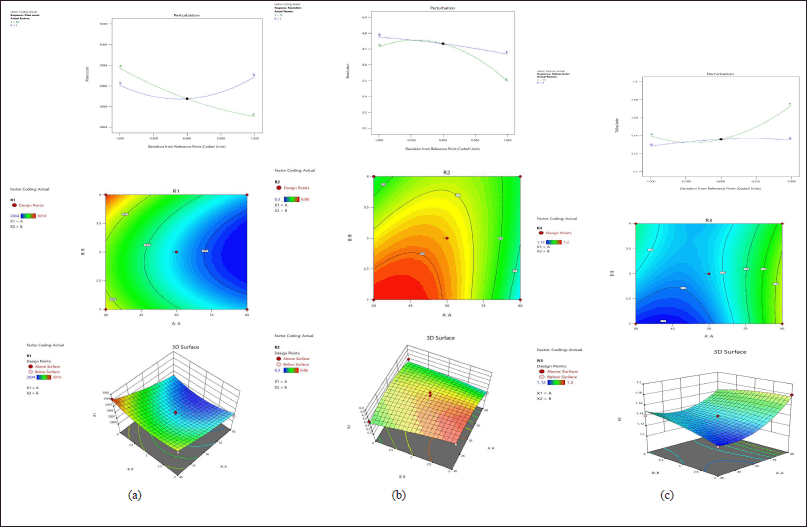 | Figure 2. (A) Perturbation, counter plot, 3D response surfaces effect on R1. (B) Perturbation, counter plot, 3D response surfaces effect on R2. (C) Perturbation, counter plot, 3D response surfaces effect on R3. [Click here to view] |
Analytical method validation
The optimized method was validated by different parameters like system suitability, linearity, range, LOD, LOQ, accuracy, precision, and specificity [16]. Summary of validation parameters results is shown in Table 6.
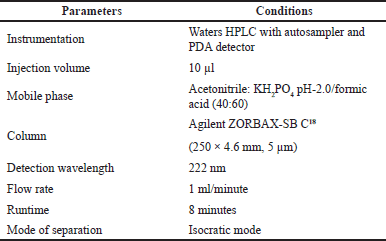 | Table 5. Optimized chromatographic conditions. [Click here to view] |
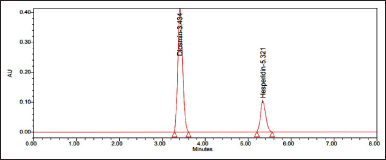 | Figure 3. Optimized chromatogram. [Click here to view] |
System suitability
According to ICH criteria, all system-relevant parameters have been satisfied and were under the limitations.
Specificity
Any interfering peaks are not observed in blank and placebo chromatograms. Hence, this method was said to be specific.
Precision
System precision
Six replicates of standard solutions were injected into the HPLC.
The % relative standard deviation (RSD) of diosmin and hesperidin was found to be 0.18% and 0.33% respectively which indicates the method was precise.
Method precision
The percentage RSD over the areas of six standard injections was within the limits.
Linearity
Linearity was taken in six concentrations starting from 25% to 150% which covers the wide concentration range. The area under the curve for diosmin and hesperidin was determined in the range of 112.5–675 and 12.5–75 μg/ml respectively. The correlation coefficient of diosmin and hesperidin was found to be 0.99975 and 0.99968 respectively. Calibration curves of diosmin and hesperidin are shown in Figure 4.
LOD and LOQ (μg/ml)
LOD for diosmin and hesperidin was found to be 0.405 and 0.045 μg/ml respectively.
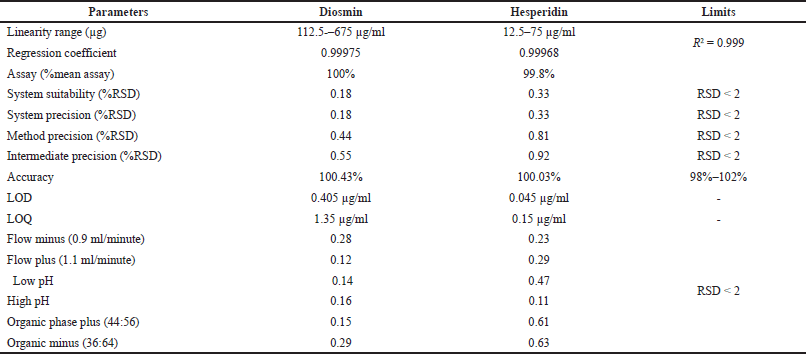 | Table 6. Summary of validation parameters. [Click here to view] |
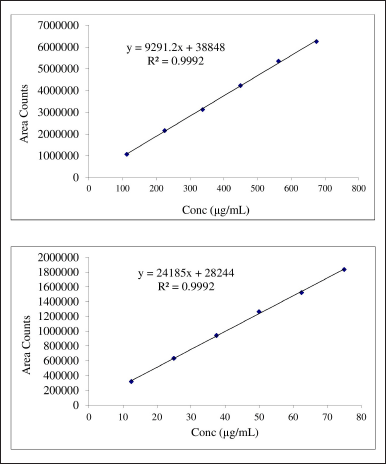 | Figure 4. Calibration curves for diosmin and hesperidin. [Click here to view] |
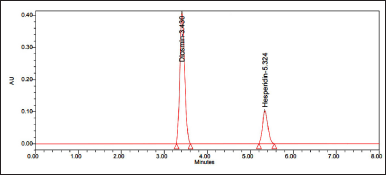 | Figure 5. Chromatogram of sample. [Click here to view] |
LOQ for diosmin and hesperidin was found to be 1.35 and 0.15 μg/ml respectively.
Accuracy
The conventional addition procedure was used to create three levels of accuracy samples. Triplicate injections were administered for accuracy, and the mean %recovery for diosmin and hesperidin appeared 100.43% and 100.03%, subsequently.
Robustness
In all conditions, the %RSD was less than 0.2. Hence, this method was robust.
Assay
10 ml of the sample was injected into the chromatographic system, measuring the areas for hesperidin and diosmin peaks. Sample chromatograms are shown in Figure 5.
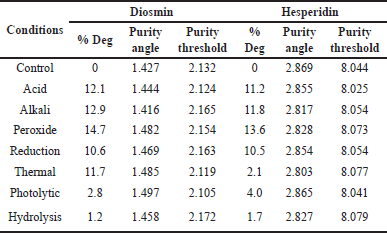 | Table 7. FD results for diosmin and hesperidin. [Click here to view] |
Degradation studies
Insignificant degradation was not found throughout the study under stress conditions. The highest degradation was observed in peroxide conditions. The purity angle was found to be less than the threshold angle in all degradation conditions. FD results are shown in Table 7.
CONCLUSION
The current work presents the development and validation of an AQbD-assisted RP-HPLC technique. Preliminary trials were performed using HPLC, optimized chromatographic conditions were obtained by using response surface methodology with CCD 23 factorial design. Two factors were selected as mobile phase composition and pH and three responses i.e. plate count, resolution, and tailing factor were optimized using statistical ANOVA. Out of 13 experimental runs, the sixth run was chosen for optimization. Residual plots reveal the interrelationship effects of factors and responses. All the validated parameters were found within acceptable limits. The present developed and validated approach was linear, precise, reliable, accurate, robust, and rugged. Hence, this method was used for routine analysis.
AUTHOR CONTRIBUTIONS
All authors made substantial contributions to conception and design, acquisition of data, or analysis and interpretation of data; took part in drafting the article or revising it critically for important intellectual content; agreed to submit to the current journal; gave final approval of the version to be published; and agree to be accountable for all aspects of the work. All the authors are eligible to be an author as per the International Committee of Medical Journal Editors (ICMJE) requirements/guidelines.
FINANCIAL SUPPORT
There is no funding to report.
CONFLICTS OF INTEREST
The authors report no financial or any other conflicts of interest in this work.
ETHICAL APPROVALS
This study does not involve experiments on animals or human subjects.
DATA AVAILABILITY
All data generated and analyzed are included in this research article.
PUBLISHER’S NOTE
This journal remains neutral with regard to jurisdictional claims in published institutional affiliation.
REFERENCES
1. DrugBank.org [Internet]. India: precision medicine in the genomic era. [updated 2021 Apr 16; cited 2023 Jul 18]. Available from: https://go.drugbank.com/drugs/DB08995
2. National Center for Biotechnology Information. PubChem compound summary for CID5281613, diosmin. [cited 2023 Jul 20]. Available from: https://pubchem.ncbi.nlm.nih.gov/compound/Diosmin
3. DrugBank.org [Internet]. India: your guide to quality drug data. [updated 2021 Apr 30; cited 2023 Jul 18]. Available from: https://go.drugbank.com/drugs/DB04703
4. National Center for Biotechnology Information. PubChem compound summary for CID 10621, hesperidin. [cited 2023 Jul 20]. Available from:https://pubchem.ncbi.nlm.nih.gov/compound/Hesperidin
5. Wikipedia. [cited 2023 Jan 17]. Available from: https://en.wikipedia.org/wiki/Diosmin
6. Wikipedia. [cited 2023 May 2]. Available from: https://en.wikipedia.org/wiki/Hesperidin
7. Garg NK, Sharma G, Singh B, Nirbhavane P, Katare OP. Quality by design (QbD)-based development and optimization of a simple, robust RP-HPLC method for the estimation of methotrexate. J Liq Chromatogr Relat Technol. 2015;38(17):1629–37. CrossRef
8. Subramanian VB, Katari NK, Dongala T, Jonnalagadda SB. Stability-indicating RP-HPLC method development and validation for determination of nine impurities in apixaban tablet dosage forms. Robustness study by quality by design approach. Biomed Chromatogr. 2020;34(1):4719. CrossRef
9. Yahya BA, Bawazir AS, Sangshetti JN, Baig SS, Shaikh SS. QbD-based development and validation of an efficient RP-HPLC method for estimation of abiraterone acetate in bulk, tablet, and in-house-developed nano-formulation. Anal Chem Lett. 2021;11(1):112–30. CrossRef
10. Jaybhave AR, Shindhe M, Mogal R, Narkhede S, Jadhav A. QbD approach to analytical RP-HPLC method development and validation of tenofovir disoproxil fumarate in dosage form. J Pharm Sci Res. 2021;13(7):381–6. CrossRef
11. Mishra G, Srivastava VK, Tripathi A. Analytical method development and validation for assay of diosmin and hesperidin in combined tablet dosage form by RP-HPLC. Int J Phar Life Sci. 2013;4:2834–9.
12. Piponski M, Stoimenova TB, Topkoska M, Stefov S, Piponska M, Serafimovska GT. Development and validation of a fast and simple RP-HPLC method for the determination of diosmin and hesperidin in combined tablet dosage form. Maced J Chem Chem Eng. 2018;37(2):127–34. CrossRef
13. Guideline ICH. Validation of analytical procedures: text and methodology. Q2 (R1). Geneva, Switzerland: European Medicine Agency; 2005. vol. 1, no. 20, 05 p.
14. Guideline IH. Quality risk management. Q9, Geneva, Switzerland: European Medicine Agency; Current step 2005. vol. 4, 408 p.
15. Iram F, Iram H, Iqbal AZ, Husain A. Forced degradation studies. J Anal Pharm Res. 2016;3(6):73. CrossRef
16. Guideline IH. Pharmaceutical development. Q8 (2R). Geneva, Switzerland: European Medicine Agency; 2009. As revised in August.