INTRODUCTION
Cancer is uncontrolled cell growth followed by an invasion of surrounding tissues and spread (metastatic) to other body parts. The main characteristic of cancer cells is the loss of control over their growth and development (Senapati et al., 2018). Several methods of curing cancer have been attempted, including surgery, irradiation, immunotherapy, and chemotherapy, but each has its weaknesses, so the success rate is still low. These problems encourage the need for efforts to find new anticancer agents that are more specific and sensitive (Mansoori et al., 2017).
Breast cancer is one of the most common cancers affecting women in both developed and developing countries. Based on the 2011 data by the Mutebi et al. (2020), the number of female deaths due to breast cancer worldwide reached 508,000. Based on these data, it is known that the number of cancer patients in developing countries is higher than that in developed countries, namely 58% (Bustos et al., 2022). Cases of breast cancer in Indonesia rank highest in the category of cancer suffered by women, reaching 26 cases per 100,000 people (Hermawan et al., 2021).
Currently, available chemotherapeutic agents have several limitations, such as an inadequate incidence of resistance, side effects, and efficacy (Dardiotis et al., 2019). As a result, therapy inefficiencies occur, so developing more effective and efficient chemopreventive agents is necessary. Chemoprevention is an agent that can inhibit the development of cancer cells, suppress the growth of abnormal cells into cancer, and reverse the stages of the carcinogenic process (Landis-Piwowar and Iyer, 2014). Chemopreventive agents may reduce cancer risk by inhibiting the initiation of preneoplastic lesions by carcinogens or reversing cancer progression (Orlikova et al., 2011; Steward and Brown, 2013).
In addition, some commercial drugs used to treat breast cancer have side effects that are harmful to the body, such as the risk of stroke and blood clots (Hermawan et al., 2021; Shiozawa et al., 2018). Therefore, it is necessary to develop drug compounds that are safe and effective in inhibiting the growth of breast cancer cells. Breast cancer is known to have a close relationship with chronic cytotoxicity, and in-cell cytotoxicity is controlled by T47D cells. Inhibition of this cell type has the potential for the development of anti-breast cancer drugs (Stewards and Brown, 2013). Several strategies for the discovery of new anticancer agents have been carried out, including the isolation of active compounds from natural materials, the search for antimetabolite compounds to specifically inhibit the growth of cancer cells, and the synthesis of organic compounds known to have anticancer activity. Several compounds from the class of flavonoids and terpenoids have been known to have antitumor activity (Panche et al., 2016). Chalcone and flavones belong to the flavonoid family and have been extensively studied as therapeutics, especially as anti-tumor drugs (Goldie, 2001). They are of interest because of their activity and having a “high therapeutic index.” They are considered “the new era of medicines” due to their capacity as antitumor, antibacterial, and anti-inflammatory agents (Ouyang et al., 2021).
Several chalcone and flavone derivatives have been reported to have antifungal, antibacterial, anticancer, antitumor, anti-inflammatory, antimutagenic, and hypoallergenic properties (Hayashi et al., 2000; Zhou et al., 2022).
Several chalcone compounds with substitutional hydroxyl groups (n′-hydroxychalcones) and flavones have been studied and shown to have cytotoxic activity. The cytotoxic activity of chalcone and flavone compounds against cancer cells is influenced by the position and type of substituents attached to their chemical framework. Some literature reports that the hydroxy and methoxy groups attached to the A and B rings of chalcone and flavone compounds can influence their cytotoxic activity against cancer cells. Chalcone compounds with hydroxyl groups at positions C-2’ and C-4’ in ring A (Fig. 1a) were also reported to be more active in inhibiting the growth of breast cancer cells with an IC50 of 17.3 µM (Hermawan et al., 2021).
In addition, previous studies reported that the flavones apigenin with the three OH group and the flavones luteolin with the four OH groups had better anticancer activity than the flavanone naringenin and flavanone eriodiktiol by giving each an IC50 value of 12.12, 4.57, 47.89, and 45.95 µM against breast cancer cells (Nam et al., 2004). Previous studies have also studied the anticancer activity of flavone compounds containing hydroxy and methoxy groups attached to rings A and B (Fig. 1b) (Reshma et al., 2017). The results of the study reported that at least two hydroxy or methoxy groups attached to the benzene ring of flavone compounds would provide anticancer activity, and anticancer activity will increase with the increasing number of hydroxy and methoxy groups attached. The synthesis of the phenyl ring at position B of 4-chloro-2′,4′-dihydroxychalcone and 2′,5′-dihydroxychalcone, as well as the replacement of the OH group at position B of the flavones apigenin and luteolin with 2-pyridyl, has never been carried out through scientific investigations. However, research conducted by Andy Eko (2022) (nonpublished article) regarding the synthesis of the hydroxy chalcone derivative, namely, the compound 1-(2,5-dihydroxyphenyl)-3-pyridine-2-yl-propenone, has been successfully carried out (Wibowo et al., 2021a). The compound 1-(2,5-dihydroxyphenyl)-3-pyridine-2-yl-propenone can be a candidate starting material for further synthesizing its derivative compounds as flavones.
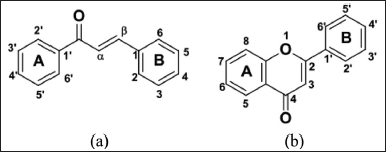 | Figure 1. Differences in structure and numbering: (a) chalcone and (b) flavones. [Click here to view] |
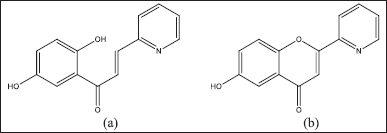 | Figure 2. Differences in structure: (a) 1-(2,5-dihydroxyphenyl)-3-pyridine- 2-yl-propenone and (b) prediction of its derivatives such as flavone compounds. [Click here to view] |
A solvatochromic analysis is needed to determine the initial success indicators in synthesizing 1-(2,5-dihydroxyphenyl)-3-pyridine-2-yl-propenone and its derivatives such as flavone compounds. In carrying out the analysis and identification as well as distinguishing the characteristics of the two compounds, it is necessary to know and understand the features of the molecular structure and its properties. Compound 1-(2,5-dihydroxyphenyl)-3-pyridine-2-yl-propenone is a chalcone flavonoid derivative formed by the substitution of OH and pyridine groups with polyethylene linked chains (Fig. 2a). In contrast, its derivatives are flavones cyclized on conjugated double bonds α and β (Fig. 2b).
In analyzing the compound 1-(2,5-dihydroxyphenyl)-3-pyridine-2-yl-propenone and its derivatives, such as a flavone compound, it is influenced by several factors, such as the presence of a distinctive functional group and branched chains of compounds derived from flavonoids that differentiate the chalcone derivatives, namely, the compound 1-(2,5-dihydroxyphenyl)-3-pyridine-2-yl-propenone and its derivatives such as flavone compounds. Determination and identification of the compound 1-(2,5-dihydroxyphenyl)-3-pyridine-2-yl-propenone and its derivatives, such as flavone compounds, based on the structure and position of the constituent atoms can be carried out by the solvatochromic method via a UV-Vis absorption spectrophotometer (Wibowo et al., 2018). When an atom or molecule absorbs light, the energy causes the electrons in the outermost shell to be excited to a higher energy level. The type of excitation depends on the wavelength of the absorbed light (Zayed et al., 2018). Ultraviolet and visible light will cause electrons to be excited to higher orbitals. The system responsible for the absorption of light is called a chromophore (Zhou et al., 2022).
To test the structural stability of 1-(2,5-dihydroxyphenyl)-3-pyridine-2-yl-propenone and its derivatives, such as flavone compounds, a solvatochromic test was carried out using the UV-Vis spectrophotometer method. Then, to ensure that there is a structural change, an FT-IR analysis will be carried out. This study was intended to determine whether there was a change in the structure of the compound 1-(2,5-dihydroxyphenyl)-3-pyridine-2-yl-propenone to its derivatives, such as a flavone compound (during the synthesis process), under acidic and alkaline conditions in ethanol and dimethyl sulfoxide (DMSO).
MATERIALS AND METHODS
Tools and materials
Among the tools used are a 20 ml volumetric flask, a 5 ml flask, a stainless spatula, a UV-Vis spectrophotometer, and a Shimadzu fourier transform infra red-8300. Then, to carry out the in vitro test of T47D cells, researchers used a liquid nitrogen tank, fluorescence microscope, phase contrast microscope, fluorescence microscope, water bath, centrifuge, CO2 incubator, incubator, enzyme-linked immunosorbent assay (ELISA) reader, hemocytometer (Neubauer), sterile conical tube, scraper, tissue culture flask, ampoule, plate, laminar airflow, pH meter, 96-well microplate, micropipette, vortex, electric balance, Eppendorf tube, pipette, and tip.
The solvents needed are all types of proanalysis, namely, ethanol (99.9%) and DMSO (99.9%). The receptor used is the compound 1-(2,5-dihydroxyphenyl)-3-pyridine-2-yl-propenone (Wibowo et al., 2021b), and derivatives of these receptors, which are thought to be flavone compounds. Meanwhile, the material needed to perform the in vitro test for T47D is the cancer cell line T47D grown in Dulbecco’s Modified Eagle’s medium high glucose (Gibco, CA, USA) media. The growth medium contains 10% growth factor and 20% fetal bovine serum (Sigma Chem. MA. St. Louis, MO), ethidium bromide, RNA-seq, DMSO, sodium carbonate (E. Merck), 0.2 Pm filter paper, distilled water, fungison, penicillin, streptomycin antibiotics (Sigma Chem. CO. St. Louis, MO), HEPES, trypsin (Sigma Chem. CO. St. Louis, MO), phosphate buffer saline (PBS), Microtetrazolium (MTT) receptor compound 1-(2,5-dihydroxyphenyl)-3-pyridine-2-yl-propenone (Wibowo et al., 2021b), and sodium dodecyl sulfate 10% in 0.01 N HCl.
Analysis of the effect of acidity and degree of solvent
The UV-Vis spectrophotometer recorded in the wavelength range from 200 to 400 nm in ethanol and DMSO solvents at 1-(2,5-dihydroxyphenyl)-3-pyridine-2-yl-propenone receptors under acidic, alkaline, acidic, and netural conditions, respectively. Furthermore, to determine the constituent groups of the compound structure, FT-IR analysis was carried out. UV and IR spectrum measurements were recorded at 25°C. A total of 1 mg of the compound (molecular weight 241) was dissolved in 10 ml of 95% ethanol. The absorbance measurement was carried out after the solution was diluted with a dilution factor of 1,000 times. Compound 1-(2,5-dihydroxyphenyl)-3-pyridine-2-yl-propenone and its derivatives in the form of flavones can weigh as much as 0.01 g each in 5 ml of solvent. pH measurements were carried out under acidic (pH = 3), alkaline (pH = 11), and neutral (pH = 6–7) conditions.
T47D in vitro test using MTT assay
The growth of cell lines from storage in liquid nitrogen for cytotoxicity tests was carried out using the following work procedures: cytotoxicity tests as anticancer in this study used cell lines T47D. The steps taken before the cytotoxic test include growing cell lines in liquid nitrogen. Frozen cells from liquid nitrogen were left at room temperature until partially thawed, then put in a 15 ml conical tube with 10 ml of washing medium, and then shaken until homogeneous. After that, centrifuge 750 g for 7 minutes. The taken pellet is added to the culture medium; then, the cells are put in the flask. All of these activities were carried out aseptically in laminar airflow. The cells were then incubated at 37°C with a 5% CO2 flow.
The cytotoxicity test of the compound synthesized using the MTT assay was carried out following the following work procedure: if the cells have grown to fill the flask, the media on the T47D cells is taken, washed with sufficient PBS. Furthermore, the cells were removed from the wall of the flask (scapper) using 0.5 ml of 0.05% trypsin. The flask was shaken gently until all the cells were released. The cell suspension was incubated 2–5 minutes in a CO2 incubator at 37°C. Then the cell suspension was put in a 15 ml conical tube and added with 5 ml of culture medium. The number of cells was counted with a hemocytometer, suspended in culture media until a cell density of 1.5 × 10⁴ was obtained as much as 100 µl in each well. Then incubated for 12–24 hours at 37°C in a CO2 incubator. Cytotoxicity test was carried out in 96 well plates. Samples were dissolved in culture media containing 0.05% DMSO. Each well was added 100 µl of sample with various concentrations using three repetitions. The remaining wells were used for positive controls containing cells without additional samples, and negative controls containing only culture medium. Then incubated 12–24 hours at 37°C in a CO2 incubator. The media was then taken, and 110 pl of culture medium containing MTT was added to each well. The cultures were incubated for 4 hours at 37°C in a CO2 incubator. Then 100 pl of formazan solvent was added, shaken gently with a shaker for 5 minutes. Followed by incubation 12–24 hours at room temperature in the dark. Absorption was read with an ELISA reader at a wavelength of 595 nm.
For the cytotoxicity test, the number of viable cells was counted and compared to controls, taking into account the effect of variations in sample levels on cell death. Cytotoxicity analysis used probit analysis to determine the IC50 value of each compound against each cell. The IC50 value is the antilog value when the probit value is 50. The probit analysis is obtained from converting the viability percentage to the probit value; the viability percentage is calculated by the following equation:
(1)
RESULTS AND DISCUSSION
The receptors 1-(2,5-dihydroxyphenyl)-3-pyridine-2-yl-propenone and their flavone derivatives are dissolved in a solvent based on increasing the polarity of solvents such as DMSO and ethanol in an acidic medium and an alkaline condition with receptor concentrations of 1-(2,5-dihydroxyphenyl)-3-pyridine-2-yl-propenone (4.15 × 10⁻² mmol) and its derivatives such as flavones (4.18 × 10⁻² mmol) and then diluted 10 times.
Effect of the degree of acidity on color change of receptor chromophore 1-(2,5-dihydroxyphenyl)-3-pyridine-2-yl-propenone
The 1-(2,5-dihydroxyphenyl)-3-pyridine-2-yl-propenone receptor gives a pale yellow, neutral yellow color in acidic conditions, whereas in alkaline conditions, it gives a brown color (Fig. 3). In ethanol, acid receptors give a pale-yellow color, neutral conditions are yellow, and bases give a pale brown color (Fig. 3).
The difference in color in the DMSO solvent, which is sharper than the receptor color in the ethanol solvent, indicates that the compound is more soluble in DMSO. Meanwhile, the sharper color change with an increasing pH value indicates a bathochromic shift. The related explanation will be presented in the following sub-discussion. Figures 4 and 9 are taken from the original images of our research results, not taking and plagiarizing from other people’s articles and research.
Effect of solvent on UV spectrum shift 1-(2,5-dihydroxyphenyl)-3-pyridine-2-yl-propenone
The 1-(2,5-dihydroxyphenyl)-3-pyridine-2-yl-propenone receptor solvatochromic test was then confirmed with a UV-Vis spectrophotometer to determine the maximum wavelength of the receptor in each solvent. Based on the UV-Vis spectra (Fig. 8), it can be seen that the receptor for 1-(2,5-dihydroxyphenyl)-3-pyridine-2-yl-propenone has a different maximum wavelength in each solvent (Table 1). The highest value of the maximum wavelength (λ max) is 365 nm in DMSO solvent and 345 nm in ethanol under acidic, neutral, and alkaline conditions.
Based on the UV-Vis solvatochromic spectra (Fig. 5), it can be seen that there is a difference in the maximum wavelength of the 1-(2,5-dihydroxyphenyl)-3-pyridine-2-yl-propenone receptor in each solvent (DMSO and ethanol). The difference in solvent polarity causes a wavelength shift; the more polar the solvent, the greater the wavelength shift toward bathochromic. The effect of the solvent on the maximum wavelength value at the 1-(2,5-dihydroxyphenyl)-3-pyridine-2-yl-propenone receptor was studied by comparing the UV-Vis absorption spectra, where the resulting wavelength was affected by the use of the solvent.
The highest maximum wavelength value (λmax) was found in the polar solvent DMSO under alkaline conditions (365 nm), and the lowest maximum wavelength value (λmax) was found in the semipolar ethanol solvent under alkaline conditions (325 nm). The maximum wavelength in ethanol is smaller than that in DMSO solvent because ethanol solvent has lower solubility than DMSO, so the receptor molecules in the solution are few (compound interactions with solvents in receptors are shown in Figure 6). This results in minimal interaction between the receptor and the solvent molecule. Meanwhile, DMSO is a very polar aprotic solvent that can completely dissolve the receptor, so there is an interaction between the solvent molecule and the receptor molecule. This event causes a change in the absorption area of light energy (Fig. 6). The following is the prediction of compound interactions in DMSO and ethanol solvents.
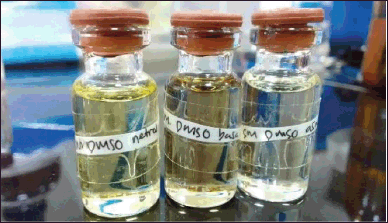 | Figure 3. Color change of the chromophore on 1-(2,5-dihydroxyphenyl)-3-pyridine-2-yl-propenone under DMSO solvent conditions, from left to right: neutral, alkaline, acidic. [Click here to view] |
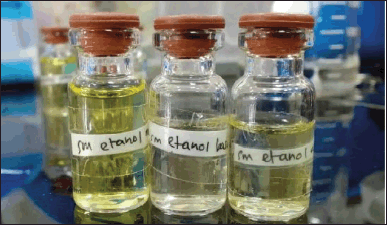 | Figure 4. Color change of the chromophore on 1-(2,5-dihydroxyphenyl)-3-pyridine-2-yl-propenone in ethanol solvent conditions, from left to right: neutral, alkaline, acidic. [Click here to view] |
Effect of receptor pH in solvent on maximum wavelength shift
The 1-(2,5-dihydroxyphenyl)-3-pyridine-2-yl-propenone receptor has two maximum wavelengths of 314 and 236 nm, respectively. However, at different pH conditions, these receptors experience a shift in wavelength. This is due to differences in the structures of the compounds due to the influence of the degree of acidity in the solvent.
Receptor pH variation was carried out by adding HCl or NaOH to the 1-(2,5-dihydroxyphenyl)-3-pyridine-2-yl-propenone receptor solution until the desired pH value was obtained. The pH value used is between a pH value of 3 for acidic conditions and a pH value of 13 for alkaline conditions. The UV-Vis spectra of receptor solutions at various pHs are presented in Figure 7.
From Figure 7, it is known that there is a shift in the maximum wavelength with variations in different pH values. In the variation of pH 3, the maximum wavelength is in the area of 261 nm; in the variation of pH 6 (neutral), it is in the maximum wave that is at 314 and 236 nm; in the variation of pH 13, the maximum wavelength is in the area of 365 nm. This difference in maximum wavelength indicates differences in ion receptors present in the solution that are affected by varying pH. If it is assumed that the peak intensity provides information about the receptor in solution, then the peak intensity of the receptor in neutral conditions, as shown in Figure 7, will vary depending on the pH of the solution. Assuming that there is a correlation between the peaks at wavelengths of 314 and 236 nm and the number of receptors present in the solution, it can be said that the receptor solution has two Ka values. From this explanation, it can be concluded that the receptor solution, which also functions as an acid-base indicator, is a diprotic acid that can give two H+ in solution (in both DMSO and ethanol solvents) through the ionization process. In general, the occurrence of the ionization process at the receptor as diprotic acid is expressed by the following equation, which is a diprotic acid that can give two H+ in solution (both DMSO and ethanol solvents) through the ionization process.
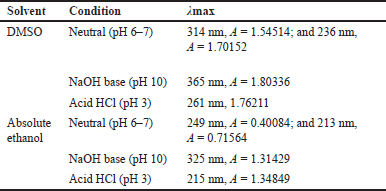 | Table 1. λmax values in DMSO and ethanol solvents in neutral, alkaline, and acidic conditions. [Click here to view] |
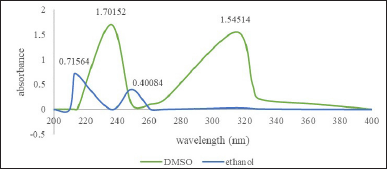 | Figure 5. UV-Vis spectra of receptor 1-(2,5-dihydroxyphenyl)-3-pyridine-2-yl-propenone in DMSO and ethanol. [Click here to view] |
H2Y ? HY– + H+
HY– ? Y2– + H+
In its form as an indicator, the equation can be stated as follows:
H2In ? HIn– + H+
HIn– ? In2– +H+
In general, the release of H+ will decrease the assumed K value as the pH of the solution increases. The greater the pH value, the lower the K value. Based on the dissolution of the receptor in acidic conditions, the following is the calculation of the K value of the receptor.
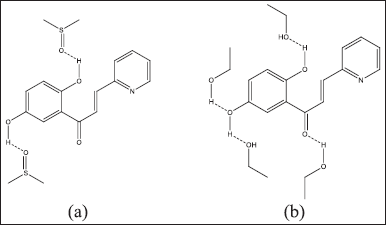 | Figure 6. Differences in solvent interactions with 1-(2,5-dihydroxyphenyl)-3-pyridine-2-yl-propenone in solvents: (a) DMSO and (b) ethanol. [Click here to view] |
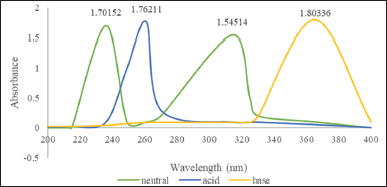 | Figure 7. UV-Vis spectra of 1-(2,5-dihydroxyphenyl)-3-pyridine-2-yl-propenone receptors at various pH in DMSO solvents. [Click here to view] |
[H+] = × [M acidic solvent]
10−3 = × 0.05 M
= 5 × 10⁻⁵
K1 = 7.1 × 10⁻³
Then for K2,
[H+] = × [M acidic solvent]
10−13 = × 0.05 M
= 5 × 10⁻¹⁸
K2 = 2.2 × 10⁻⁹
Based on the results of calculating the K value, it can be seen that the K2 value is smaller than K1, which proves that the greater the pH value, the lower the K value. At lower pH values, protonated receptor species such as H2In and HIn− will be more abundant than In2−. Meanwhile, at a higher pH, In2− species begin to form. Therefore, it can be assumed that with a decrease in the pH of the solution, the equilibrium will shift toward the formation of H2In, and at a certain pH value, an equilibrium will be formed when H2In, HIn−, and In2− are also present in one amount at each equilibrium.
Based on the equation and Figure 7 regarding the spectrum of UV-Vis receptors at various pHs, it can be assumed that in a solution of pH 3, H2In species are dominant, but HIn− species have started to form. Meanwhile, at pH 6 (neutral), the concentration of H2In species began to decrease because the concentration of HIn− increased in the receptor solution, which was formed through the first stage of the ionization process. An increase in pH decreases the concentration of H2In, but an increase in pH raises the concentration of HIn−. The existence of these two species is related to the formation of intensity peaks as seen at 261 nm, namely, at pH 3, there is only one peak; then at 365 nm intensity, namely, at pH 13, there is also only one peak; in solution 6, there are two intensity peaks at 314 nm and 236 nm. The formation of these two intensity peaks indicates that the concentration of H2In is no longer dominant and has been replaced by HIn species, with peaks starting to appear at pH 13 (365 nm). Based on the correlation between the presence of receptor species and the pH of the solution, it can be assumed that in a solution with a pH of 3, an equilibrium occurs between H2In and HIn−. Whereas at pH 6–7, the absorbance is almost the same, so it can be assumed that at pH 6–7, the receptor is in equilibrium between HIn− and In2−. From this explanation, it can be concluded that the peak intensity at a wavelength of 261 nm is associated with the presence of HIn− and HIn− species, while the intensity peak at the receptor wavelength is related to the presence of HIn− and In2− species. Besides that, an increase in the intensity of the peak under alkaline conditions indicates the start of the second stage of the ionization process with the formation of In2− in solution. With increasing pH, the concentration of In2− increases, but the concentration of HIn− decreases. This can be seen by increasing the intensity of the peak at 365 nm along with the increased pH of the solution. Changes in the pH of the solution indicating the presence of H2In, HIn−, and In2− species can be correlated with changes in the structure of the 1-(2,5-dihydroxyphenyl)-3-pyridine-2-yl-propenone receptor, as shown in Figure 8. This can be seen by the increase in peak intensity at 365 nm along with the increased pH of the solution.
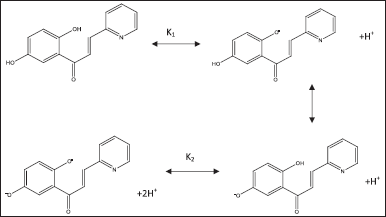 | Figure 8. Ionization of 1-(2,5-dihydroxyphenyl)-3-pyridine-2-yl-propenone [Click here to view] |
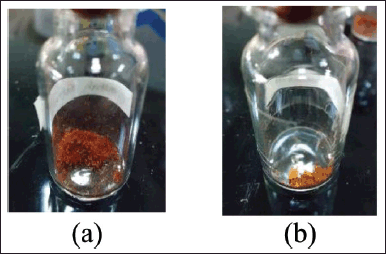 | Figure 9. Appearance of the compound: (a) 1-(2,5-dihydroxyphenyl)-3-pyridine-2-yl-propenone; (b) its derivatives (flavones). [Click here to view] |
From Figure 8, it can be seen that there is a change in the structure of the 1-(2,5-dihydroxyphenyl)-3-pyridine-2-yl-propenone receptor. The hydroxyl group that binds to the benzene ring, 1-(2,5-dihydroxyphenyl)-3-pyridine-2-yl-propenone releases H+ as the pH of the solution rises. However, it is possible that the carbonyl and pyridinyl groups do not ionize because the electron density in this region is very high, making it difficult to release H+. From Figure 8, it can be seen that in 1-(2,5-dihydroxyphenyl)-3-pyridine-2-yl-propenone, it is possible for two dissociation processes to occur.
Differences in receptor structure for 1-(2,5-dihydroxyphenyl)-3-pyridine-2-yl-propenone receptors and their derivatives in the form of flavones
Figures 4 and 9 are taken from the original images of our research results, not taking and plagiarizing from other people’s articles and research. In the process of synthesizing the 1-(2,5-dihydroxyphenyl)-3-pyridine-2-yl-propenone derivative carried out in Andy Eko Wibowo’s research, it will be used as a starting material to synthesize its derivatives, such as flavone compounds. The results of the UV-Vis spectrophotometer analysis showed that there was a difference in the spectra between the two, and this indicates the formation of a new compound. To analyze the structure of the compound, the magnitude of this absorption can be predicted by determining the parent group as follows:
Figure 10 shows the UV spectrum of 1-(2,5-dihydroxyphenyl)-3-pyridine-2-yl-propenone receptor derivative as a flavone (still under prediction). The absorption spectrum shows a peak at 309.5 nm. The electronic spectrum of flavone receptors was recorded in solvents with different polarities and hydrogen bonding abilities. Meanwhile, the absorption spectra for 1-(2,5-dihydroxyphenyl)-3-pyridine-2-yl-propenone showed two peaks (bands I and II). Band I can be detected in the range of 260 nm and band II at 309.5 nm. As shown in Figure 10, the compound has two chromophores: the first belongs to the 1-(2,5-dihydroxyphenyl)ethanone system, and the other belongs to the 3-(pyridine-2-yl)-acrylaldehyde system. As for the derivative compound, it only has one chromophore, which is suspected to be a 1-(2,5-dihydroxyphenyl)ethanone chromophore.
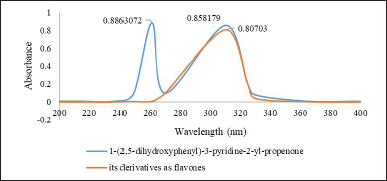 | Figure 10. Differences in the UV-Vis spectrum of 1-(2,5-dihydroxyphenyl)-3-pyridine-2-yl-propenone with its derivatives such as flavones. [Click here to view] |
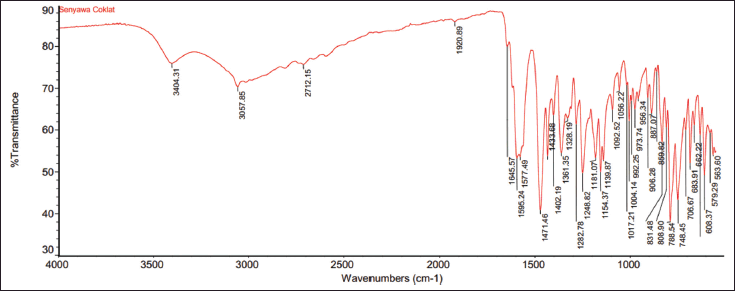 | Figure 11. IR spectrum of derivative compounds as flavones. [Click here to view] |
Structural identification of derivative compounds as flavones
Receptors suspected of being new compounds (derivatives such as flavone) were analyzed using FT-IR instruments to determine the structure of the constituent groups.
To determine the clear differences between the flavone and chalcone derivatives, the FT-IR results were compared with the IR spectra of the compounds 1-(2,5-dihydroxyphenyl)-3-pyridine-2-yl-propenone.
The presence of aromatic rings (phenyl and pyridyl) connected to each other by conjugated α, β carbonyls distinguishes 1-(2,5-dihydroxyphenyl)-3-pyridine-2-yl-propenone from its derivatives such as flavone compounds. Figure 11 shows the IR spectra of compounds synthesized by derivatives as flavone compounds, showing a wide OH absorption band at wave number 3,412 cm−1. The presence of the OH group is also strengthened by the presence of the CO band at 1,282.78 cm-1, whereas in the compound 1-(2,5-dihydroxyphenyl)-3–pyridine–2-yl-propenone (Wibowo et al., 2021b) at 1,285 cm−1. The bands that appear at 1,577.49 and 1,471.46 cm−1 are characteristic of stretching vibrations of aromatic C=C bonds, and the bands with weak intensity at around 3,057.85 cm−1 are aromatic and olefinic CH stretching vibrations.
However, there is something special about the compound 1-(2,5-dihydroxyphenyl)-3-pyridine-2-yl-propenone that distinguishes it from its flavone derivatives. Based on Figure 11, the IR spectrum of the derivative compound in the form of flavones has a wide absorption band at a wavelength of 2,712.15 cm−1, indicating the presence of hydrogen bonds in the carboxylic OH, and a sharp, strong band at a wavelength of 1,139.87 cm−1 indicating the presence of bond vibrations in the CO ether, whereas, in a study conducted by Wibowo (2013), the band that appeared at 1,651 cm−1 was a conjugated carbonyl ketone absorption band. As a result, it is suspected that the α,β conjugated ketone carbonyls do not exist in the structure of the derivative compound as a flavone; otherwise, the vibration of the CO ether bond indicates that the conjugated bond forms a cyclic on the OH group in the meta position.
This indicates a different structure between the chalcone compound (1-(2,5-dihydroxyphenyl)-3-pyridine-2-yl-propenone) and the flavone compound. However, both have almost the same type and characteristics because they are included in the class of derivative flavonoid compounds. Therefore, the importance of knowing the properties and characteristics of a compound in understanding, differentiating, and identifying it in synthesizing flavonoid derivative compounds is an indicator of success in analyzing the success of the synthesis of organic compounds in a study.
Cytotoxic activity in T47D cancer cells using the MTT assay method
The cytotoxicity test results showed that the compound 1-(2,5-dihydroxyphenyl)-3-pyridine-2-yl-propenone has cytotoxicity against T47D cells. Based on the findings, a direct relationship existed between changes in functional groups in the compound 1-(2,5-dihydroxyphenyl)-3-pyridine-2-yl-propenone and the death rate of T47D cells was expressed in IC50 (lethal concentration). This is because the OH group on the receptor, which is easily deprotonated, can determine the cytotoxic activity of the compound, considering that the O and H bonds in the OH group can rotate and bind to body cells as inhibitors in T47D cancer cells. In this case, the OH groups act as proton donors and body cells as hydrogen acceptors released by receptor compounds. Table 2 shows the cell viability value of the cytotoxic activity of receptor compounds.
The compound 1-(2,5-dihydroxyphenyl)-3-pyridine-2-yl-propenone is declared nontoxic if the result of the calculation using the viability formula for the percentage of living cells is >60%. Based on Table 2, the compounds 1-(2,5-dihydroxyphenyl)-3-pyridine-2-yl-propenone with concentrations of 125 and 62.5 ug/ml showed weak toxicity to T47D cancer cells. However, on the contrary, that compound with a concentration of >125 ug/ml and a viability value of >60% showed toxicity in T47D cancer cells.
 | Table 2. MTT assay test results. [Click here to view] |
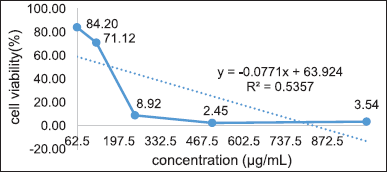 | Figure 12. Linear regression of T47D cell viability for 24 hours. [Click here to view] |
The toxicity test was assessed based on the percentage of cell viability and the IC50 value obtained from three repetitions of the percentage of viability measurements. They were then subjected to probit analysis with a linear regression equation, as shown in Figure 12. Then, the concentration of that receptor, which inhibits cell growth by 50% (IC50), is 180.59 ug/ml. IC50 > 150 indicates weak toxicity to T47D cancer cells.
CONCLUSION
1-(2,5-Dihydroxyphenyl)-3-pyridine-2-yl-propenone receptor showed darker color changes with increasing acidity, whereas different solvents showed a bathochromic shift in the aprotic solvent, namely, DMSO. UV-Vis spectrum analysis of the receptor 1-(2,5-dihydroxyphenyl)-3-pyridine-2-yl-propenone and its derivatives such as flavones showed a difference in the maximum wavelength with the number of 2 peaks (260 and 309.5 nm, respectively) and 1 peak (309.5 nm). Based on the analysis of the target receptor’s IR spectrum, derivative compounds such as flavones were successfully formed; absorption bands indicated the presence of missing structural groups at a wavelength of 1,651 cm−1 (specific groups in the starting material compound), and the appearance of new absorption bands (2,712.15 and 1,139.87 cm−1) showed a specific group of flavone derivatives.
ACKNOWLEDGMENTS
The authors would like to thank the Research and Innovation Institute of the Muhammadiyah University of Yogyakarta and the PP Muhammadiyah Education and Development Council (Diktilitbang) for guiding the writing of articles.
AUTHOR CONTRIBUTIONS
All authors made substantial contributions to conception and design, acquisition of data, or analysis and interpretation of data; took part in drafting the article or revising it critically for important intellectual content; agreed to submit to the current journal; gave final approval of the version to be published; and agree to be accountable for all aspects of the work. All the authors are eligible to be an author as per the international committee of medical journal editors (ICMJE) requirements/guidelines.
FINANCIAL SUPPORT
Thanks are expressed to those who assisted in procuring the financial supporting our research: the Scientific Research Institute (LRI) Muhammadiyah University of Yogyakarta, the Muhammadiyah Central Leadership Diktilitbang Council 2023, and the Ministry of Education, Culture, Research and Technology of the Republic of Indonesia.
CONFLICTS OF INTEREST
The authors report no financial or any other conflicts of interest in this work.
ETHICAL APPROVALS
This study does not involve experiments on animals or human subjects.
DATA AVAILABILITY
All data generated and analyzed are included in this research article.
PUBLISHER’S NOTE
This journal remains neutral with regard to jurisdictional claims in published institutional affiliation.
REFERENCES
Bustos L, Echiburú-Chau C, Castro-Alvarez A, Bradshaw B, Simirgiotis MJ, Mellado M, Parra C, Cuellar M. Cytotoxic effects on breast cancer cell lines of chalcones derived from a natural precursor and their molecular docking analysis. Molecules, 2022; 27(14):1–10; doi:10.3390/molecules27144387
Dardiotis E, Aloizou AM, Markoula S, Siokas V, Tsarouhas K, Tzanakakis G, Libra M, Kyritsis AP, Brotis AG, Aschner M, Gozes I, Bogdanos DP, Spandidos DA, Mitsias PD, Tsatsakis A. Cancer-associated stroke: pathophysiology, detection and management (Review). Int J Oncol, 2019; 54(3):779–96; doi:10.3892/ijo.2019.4669
Goldie JH. Drug resistance in cancer: a perspective. Cancer Metastasis Rev, 2001; 20(1–2):63–8; doi:10.1023/A:1013164609041
Hayashi A, Gillen AC, Lott JR. Effects of daily oral administration of quercetin chalcone and modified citrus pectin on implanted colon-25 tumor growth in balb-c mice. Altern Med Rev, 2000; 5(6):546–552.
Hermawan A, Ikawati M, Jenie RI, Khumaira A, Putri H, Nurhayati IP, Angraini SM, Muflikhasari HA. Identification of potential therapeutic targets of naringenin in breast cancer stem cell inhibition by bioinformatics and in vitro studies. Saudi Pharm J, 2021; 29(1):12–26; doi:10.1016/j.jsps.2020.12.002
Landis-Piwowar KR, Iyer NR. Cancer chemoprevention: current state of the art. Cancer Growth Metastasis, 2014; 7:CGM.S11288; doi:10.4137/cgm.s11288
Mansoori B, Mohammadi A, Davudian S, Shirjang S, Baradaran B. The different mechanisms of cancer drug resistance: a brief review. Adv Pharm Bull, 2017; 7(3):339–48; doi:10.15171/apb.2017.041
Mutebi M, Anderson BO, Duggan C, Adebamowo C, Agarwal G, Ali Z, Bird P, Bourque JM, DeBoer R, Gebrim LH, Masetti R, Masood S, Menon M, Nakigudde G, Ng’ang’a A, Niyonzima N, Rositch AF, Unger-Saldaña K, Villarreal-Garza C, Dvaladze A, El Saghir NS, Gralow JR, Eniu A. Breast cancer treatment: a phased approach to implementation. Cancer, 2020; 126(S10):2365–78.
Nam NH, Hong DH, You YJ, Kim Y, Bang SC, Kim HM, Ahn BZ. Synthesis and cytotoxicity of 2,5-dihydroxychalcones and related compounds. Arch Pharm Res, 2004; 27(6):581–8. doi:10.1007/BF02980153
Orlikova B, Tasdemir D, Golais F, Dicato M, Diederich M. Dietary chalcones with chemopreventive and chemotherapeutic potential. Genes Nutr, 2011; 6(2):125–47; doi:10.1007/s12263-011-0210-5
Ouyang Y, Li J, Chen X, Fu X, Sun S, Wu Q. Chalcone derivatives: role in anticancer therapy. Biomolecules, 2021; 11(6):1–36; doi:10.3390/biom11060894
Panche AN, Diwan AD, Chandra SR. Flavonoids: an overview. J Nutr Sci, 2016; 5; doi:10.1017/jns.2016.41
Reshma MV, Jacob J, Syamnath VL, Habeeba VP, Dileep Kumar BS, Lankalapalli RS. First report on the isolation of 2,3,4-trihydroxy-5-methylacetophenone from palmyra palm (Borassus flabellifer Linn.) syrup, its antioxidant and antimicrobial properties. Food Chem, 2017; 228:491–6; doi:10.1016/j.foodchem.2017.02.043
Senapati S, Mahanta AK, Kumar S, Maiti P. Controlled drug delivery vehicles for cancer treatment and their performance. Signal Transduct Targeted Ther, 2018; 3(1):1–19; doi:10.1038/s41392-017-0004-3
Shiozawa R, Inoue Y, Murata I, Kanamoto I. Effect of antioxidant activity of caffeic acid with cyclodextrins using ground mixture method. Asian J Pharm Sci, 2018; 13(1):24–33; doi:10.1016/j.ajps.2017.08.006
Steward WP, Brow K. Cancer chemoprevention: a rapidly evolving field. Br J Cancer, 2013; 109(1):1–7; doi:10.1038/bjc.2013.280
Wibowo AE. Sintesis dan Uji Aktifitas Antiinflamasi Senyawa 1-(2,5-dihidroksifenil)-(3-piridin-2-Il)-propenon. Thesis, Universitas Muhammadiyah, Yogyakarta, Indonesia, 2013
Wibowo AE, Hatala RR, Edang, AM. Antimicrobial test of 1-(2.5-dihydroxi phenyl)-(3-pyridine-2-Il)-propanone compound in Enterococcus faecalis and Escherichia coli bacteria using a well diffusion method. J Fundam Appl Pharm Sci, 2021a:72–80. doi:10.18196/jfaps.v1i2.10983
Wibowo AE, Susidarti RA, Puspitasari I. Synthesis and anti-inflammatory activity of 1-(2,5-Dihydroxyphenyl)-3-pyridine-2-yl-propenone (AEW-1) compound. Indones J Pharm, 2021b; 32(2):209–20; doi:10.22146/ijp.1263
Wibowo AE, Susidarti RA, Puspitasari I, Sudarmanto BSA. Desain Molekul Senyawa Turunan Kalkon sebagai Anti-Inflamasi. Deepublish, Yogyakarta, Indonesia, 2018.
Zayed MEM, El-Shishtawy RM, Elroby SA, Al-Footy KO, Al-amshany ZM. Experimental and theoretical study of donor-π-acceptor compounds based on malononitrile. Chem Cent J, 2018; 12(1):1–10; doi:10.1186/s13065-018-0394-5
Zhou Q, Zhao, S, Gan, L, Wang Z, Peng S, Li Q, Liu H, Liu X, Wang Z, Shi Q, Estill J, Luo Z, Wang X, Liu E, Chen Y. Use of non-steroidal anti-inflammatory drugs and adverse outcomes during the COVID-19 pandemic: a systematic review and meta-analysis. EClin Med, 2022; 46:101373; doi:10.1016/j.eclinm.2022.101373