
INTRODUCTION
Oxidative stress originates from a disparity between free radicals and antioxidants, leading to cellular damage. Excessive production of free radicals can harm biological molecules such as lipids, proteins, and DNA and disrupt redox signaling. This damage contributes to the development of a wide range of diseases, including metabolic, cardiovascular, and neurodegenerative disorders and cancers [1].
A key consequence of oxidative stress is the formation of advanced glycation end-products (AGEs), which result from non-enzymatic reactions between amino acids and glucose. AGEs can further amplify reactive oxygen species (ROS) production and impair antioxidant defenses, promoting the onset and progression of various diseases [2]. Compounds that can scavenge free radicals or inhibit glycation reactions are, therefore, considered to have broad therapeutic potential. Natural antioxidants, including flavonoids, phenolics, alkaloids, and terpenes, have demonstrated antiglycation activity, suggesting their potential role in mitigating oxidative stress- and AGEs-related diseases [2,3].
Mitragyna speciosa (Korth.) Havil., commonly known as kratom, is classified within the Rubiaceae family. Recently, kratom use has gained considerable attention. The most appealing aspect of kratom is its analgesic properties [4]. In traditional medicine, kratom has also been widely used for managing diabetes [5]. Supporting this ethnomedical use, oxidative stress is known to play a significant role in type 2 diabetes mellitus (T2DM), where long-term hyperglycemia enhances free radical production and contributes to the formation of AGEs [6]. Apart from its well-known analgesic effects, kratom also exhibits various pharmacological activities, including antioxidant, antibacterial, anti-inflammatory, and antidepressant effects [7]. The bioactive compounds in kratom, particularly mitragynine (MG) and 7-hydroxymitragynine (7-OH-MG), both indole alkaloids, have been identified as the primary molecules responsible for its analgesic effects [8–10].
Despite reports on the antioxidant and antidiabetic properties of kratom, including its ability to scavenge DPPH and ABTS radicals [11], increase glucose transporter activity in muscle cells [12], inhibit alpha-glucosidase [13], and control blood glucose levels in diabetic rats [14], the specific mechanisms and substances responsible for these effects remain unclear. Moreover, research on kratom’s impact on oxidative stress-related conditions is limited, with most studies primarily focusing on methanol extracts and chemical assays. To address these gaps, the present study uniquely evaluates a range of kratom extracts, specifically aqueous (KW), methanol (KM), and alkaloid (KA) extracts separately, along with its major alkaloid, MG. This design allows for a broader investigation into the contributions of both alkaloid and non-alkaloid constituents. The study investigates their antioxidant and antiglycation effects using both chemical assays (DPPH, ABTS, and FRAP assays, BSA-glucose and BSA-methylglyoxal (MGO) models) and the HepG2 liver cell model, which has been relatively underexplored in the existing literature. Furthermore, Pearson correlation analysis between MG content and antioxidant activities was conducted to explore the hypothesis that the bioactivities of kratom may arise not only from MG but also from other bioactive compounds present in kratom. Through this integrated approach, this study aims to provide a clearer understanding of the potential mechanisms or bioactive substances through which kratom may help prevent or mitigate oxidative stress-related complications, thereby contributing novel insights to the field.
MATERIALS AND METHODS
Chemicals and reagents
All the chemicals, if not otherwise specified, were obtained from Sigma-Aldrich (St. Louis, USA). Low-glucose Dulbecco’s Modified Eagle Medium (DMEM), fetal bovine serum (FBS), and 3-(4,5-dimethylthiazol-2-yl)-2,5-diphenyl-tetrazolium bromide (MTT) were purchased from Thermo Fisher Scientific (Waltham, USA). Gallic acid, 2′,7′-dichlorofluorescein diacetate (DCFH-DA), and hydrogen peroxide solution (30%) were obtained from Merck (Darmstadt, Germany). Solvents were of analytical grade. Methanol, ethanol, chloroform, acetonitrile, and glacial acetic acid were purchased from RCI Labscan Limited (Bangkok, Thailand).
Plant materials
Fully expanded kratom leaves were collected from Surat Thani Province, Thailand. A voucher specimen [Wungsintaweekul, J. N6/006 (PSU)] has been stored at the Prince of Songkla University Herbarium (PSU Herbarium), situated at the Division of Biological Science, Faculty of Science, Prince of Songkla University, Thailand.
Preparation of kratom extracts and isolated MG
Kratom leaves were dried at 50°C and then powdered for extract preparation. Three kratom extracts were prepared using different solvents and extraction methods and are hereafter referred to as the aqueous extract (KW), methanol extract (KM), and alkaloid extract (KA). Unless otherwise specified, the term “kratom extracts” refers collectively to these three preparations. KW was prepared by boiling kratom powder (400 g) in water (1 l) for 60 minutes. The filtrates from three separate extractions were combined and lyophilized to yield 68.6 g of KW. KM was obtained by sonicating kratom powder (100 g) in methanol (1 l) for 30 minutes, followed by 16 hours of maceration at room temperature. This process was repeated five times, and the combined extract was concentrated and dried using a rotary evaporator, yielding 14.2 g of KM. KA was prepared using 102 g of kratom powder through an acid–base extraction method, with slight modifications from the procedure outlined by Keawpradub [15]. The resulting yield of KA was 0.18 g. All extracts were stored at 4°C until used.
MG (purity ≥ 90%) was isolated using silica gel column chromatography as described by Keawpradub [15].
To prepare the sample stock solution, KW was dissolved in sterile water at 10 mg/ml, whereas KM, KA, and MG were dissolved in DMSO at the same concentration. They were stored at −20°C until use. In all experiments, the samples were diluted with the appropriate solvents before use.
HPLC analysis of MG in kratom extracts
The MG content in kratom extracts, including KW, KM, and KA, was analyzed using a previously reported HPLC method [16]. Briefly, the analysis was conducted on a Shimadzu Prominence-i LC-2030C 3D Plus system equipped with a VertiSepTM USP C18 HPLC column (4.6 × 250 mm, 5 µm) (Nonthaburi, Thailand), an autosampler, and a diode array detector. The mobile phase consisted of 20 mM ammonium acetate (pH 6.0) and acetonitrile in a 35:65 ratio, employing isocratic elution at a flow rate of 1 ml/min. Chromatograms were recorded at a wavelength of 225 nm.
Determination of total phenolic content (TPC)
TPC was determined using the Folin–Ciocalteu method [17]. Each kratom extract (5 mg/ml, 0.5 ml) was mixed with 2.5 ml of 10% (v/v) Folin–Ciocalteu’s reagent. After standing at room temperature for 5 minutes, 2.5 ml of 7.5% (w/v) NaHCO3 was added to the mixture and incubated for 30 minutes. Methanol was used as a blank. Gallic acid (7.8–125 µg/ml) was used to prepare the standard curve. The absorbance was then measured at 765 nm. The results were expressed as mg of gallic acid equivalent per gram of kratom extract (mg GAE/ g extract). All experiments were performed in triplicate.
Determination of total tannin content (TTC)
TTC was determined using the gravimetric method [18]. Polyvinylpolypyrrolidone (PVPP) 100 mg was added into 1 ml of each kratom extract (5 mg/ml), where the TPC had previously been measured. The mixture was then stirred and allowed to stand at 4°C for 15 minutes. It was subsequently centrifuged at 3000 rpm for 10 minutes. The supernatant was analyzed for non-tannin phenolic content using the Folin–Ciocalteu method. The tannin content was calculated by subtracting the non-tannin phenolic content from the total phenolic content. The results were expressed as mg GAE/g extract. All experiments were performed in triplicate.
Determination of total flavonoid content (TFC)
The TFC was evaluated using the aluminum chloride method [19]. Each kratom extract (5 mg/ml) was appropriately diluted, and then 125 µl of each diluted extract was mixed with 75 µl of 5% NaNO2. After 6 minutes of incubation, 150 µl of 10% AlCl3 was added and allowed to stand at room temperature for 5 minutes. Subsequently, 750 µl of 1 M NaOH was mixed in, and distilled water was added to bring the total volume to 2.5 ml. The reaction mixture was incubated for 15 minutes at room temperature, and the absorbance was then measured at 510 nm. The TFC was calculated using a quercetin standard curve ranging from 2.5 to 50 µg/ml and expressed as mg of quercetin equivalents per gram extract (mg QE/g extract). All experiments were performed in triplicate.
Antioxidant activity assays
DPPH assay
An aliquot of 20 µl of each kratom extract and MG (0.31–5 mg/ml) was combined with 180 µl of 0.15 mM DPPH and allowed to react for 30 minutes at room temperature in the dark. The absorbance was read at 517 nm [20]. Gallic acid, at a concentration ranging from 5 to 50 µg/ml, was used for preparing standard curve. The percentage of inhibition was calculated using the following formula:
where Acontrol refers to the absorbance of the control, Asample is the absorbance of the test samples, and Ablank sample represents the absorbance of the sample without DPPH. The results were reported as IC50 values, which were derived from plotting the % inhibition against the concentration. All the samples were analyzed in triplicate.
ABTS radical scavenging assay
The ABTS solution was prepared by mixing 7 mM ABTS with 7.35 mM K2SO4 at a ratio of 2:1. The solution was then diluted with ethanol to obtain an absorbance of 0.7±0.02 at 734 nm. The 10 µl of each kratom extract and MG (5–100 µg/ml in methanol or water) were gently mixed with 190 µl of the ABTS solution in the 96-well plates. The mixtures were then incubated in the dark at room temperature for 6 minutes [21]. Trolox was used as the positive control. The ABTS scavenging activity was calculated using the following formula:
where Acontrol is the absorbance of the control, Asample is the absorbance of the test samples, and Ablank sample denotes the absorbance of the sample without the ABTS solution. The results were reported as IC50 values, calculated by plotting the % ABTS radical scavenging against the concentration. All the samples were analyzed in triplicate.
FRAP assay
FRAP reagent was prepared by mixing 300 mM acetate buffer (pH 3.6), 10 mM 2,4,6-tripyridyl-s-triazine (TPTZ) solution in 40 mM HCl, and 20 mM FeCl3 in a volume ratio of 10:1:1. Subsequently, 10 µl of each kratom extract and MG (10 mg/ml) or gallic acid (15.6–500 µM) were combined with 300 µl of FRAP reagent and thoroughly mixed [22]. The absorbance at 593 nm was then measured at 5, 15, 30, 45, and 60 minutes of incubation. The results were expressed as mM of gallic acid equivalents per gram extract (mM GAE/g extract). All the samples were analyzed in triplicate.
Antiglycation assays
BSA-glucose model
The antiglycation assay with the BSA-glucose model was conducted as described by Yagi et al. [21] with a slight modification. Briefly, each kratom extract, MG (1–100 µg/ml) or aminoguanidine (1–100 µg/ml) as a positive control, was combined with the reaction mixture containing BSA solution (50 mg/ml), 800 mM glucose, and 0.02% (w/v) sodium azide, in a volume of 20 µl each. Following a 14-day incubation at 37°C, the resulting pellets were washed with 5% trichloroacetic acid (TCA) (60 µl) and then dissolved in 10 mM PBS (pH 10, 60 µl). Fluorescence intensity was measured at excitation and emission wavelengths of 370 and 440 nm, respectively, using Varioskan™ LUX multimode microplate reader (Thermo Scientific, Vantaa, Finland). The percentage of AGEs inhibition was calculated as:
where Asample is the fluorescence of the reaction mixture with sample, and Acontrol is the fluorescence of the reaction mixture without sample. All the samples were analyzed in triplicate.
BSA-methylglyoxal (MGO) model
The BSA-MGO model assay was performed according to the published method [23]. AGEs were analyzed by mixing each sample (1–100 µg/ml) or aminoguanidine (1–100 µg/ml) with BSA solution (20 mg/ml) and 60 mM MGO, with a volume of 50 µl each. The mixture was then incubated at 37°C for 14 days. Sodium azide (0.02% w/v) was used as a preservative. Fluorescence intensity was measured at excitation and emission wavelengths of 340 and 420 nm, respectively. Each sample was analyzed in triplicate. The inhibition of AGEs formation was calculated using the same formula as previously described.
Cell culture experiment
Cell culture
HepG2 cells (ATCC® HB-8065™) were grown in low-glucose DMEM supplemented with 10% FBS and maintained at 37°C in a humidified atmosphere containing 5% CO2. The culture medium was changed every 2–3 days. Cells were sub-cultured upon reaching approximately 80%–90% confluence and subsequently used for further studies.
Cell viability assay
Cell viability assay was assessed using MTT assay [24]. HepG2 cells (2 × 10⁴ cells/well) were treated with various concentrations of kratom extracts and MG (1.56–500 µg/ml) for 24 hours. After washing with 10 mM PBS (pH 7.4), an MTT solution (0.5 mg/ml) was added to the wells. The absorbance of the resulting formazan was measured at a wavelength of 570 nm using SPECTROstar Nano microplate reader (BMG LABTECH, Ortenberg, Germany). All experiments were carried out in triplicate. The concentration of compounds that yielded at least 80% cell viability was considered non-cytotoxic.
Cytoprotective assay
Cytoprotective effect of kratom extracts and MG were assessed against H2O2-induced toxicity in HepG2 cells using an MTT assay [25]. Initially, HepG2 cells were incubated for 24 hours in the presence of H2O2 (0.5–5 mM) to determine the appropriate cytotoxic concentration of H2O2. Once the optimal concentration of H2O2 was obtained, the cells were pre-treated for 24 hours with non-cytotoxic concentrations of kratom extracts and MG and thereafter treated with H2O2 (1.5 mM) for an additional 6 hours. Each experiment was performed in triplicate using epicatechin (100 µM) as a positive control.
Intracellular ROS formation assay
Intracellular ROS levels were measured using the DCFH-DA assay [25]. HepG2 cells were seeded into 48-well plates at a density of 2.5 × 10⁴ cells/well. Following a 24-hour exposure to non-cytotoxic concentrations of kratom extracts and MG, the cells were rinsed with 10 mM PBS (pH 7.4) and then incubated with 10 µM DCFH-DA for 30 minutes at 37°C in the dark. After that, the cells were washed with ice-cold PBS and subsequently treated with 1.5 mM H2O2 in a serum-free medium for 1 hour. The cells were then washed, lysed, and centrifuged at 13000 ×g for 10 minutes at 4°C. Fluorescence intensity in the supernatant was measured at 485 nm for excitation and 530 nm for emission wavelengths. The results were normalized to protein concentration, as estimated by the Bradford assay (Bio-Rad, California, USA), and reported as a percentage of ROS formation relative to untreated cells. Each experiment was conducted in triplicate, with 100 µM epicatechin serving as a positive control.
Lipid peroxidation assay
MDA levels in HepG2 cells were measured using a thiobarbituric acid-reactive substance (TBARS) assay with modifications to the published method [25]. HepG2 cells were seeded into 6-well plates at a density of 2 × 10⁵ cells/well. The cells were pre-incubated with non-cytotoxic concentrations of kratom extracts and MG for 24 hours, followed by treatment with 1.5 mM H2O2 in a serum-free medium for 6 hours. The cells were then gently scraped and centrifuged at 12000 rpm for 10 minutes. The collected cell pellets were re-suspended in 25 mM Tris-HCl buffer (pH 7.4) and sonicated for 5 minutes. MDA levels were analyzed by combining the supernatant with a TBA solution, followed by heating at 90°C for 20 minutes, cooling on ice for 10 minutes, and then centrifuging at 12000 rpm for 10 minutes. The absorbance was measured at 532 nm. The results were normalized to protein concentration and expressed as nmol MDA equivalents per mg protein.
Statistical analysis
Data were presented as mean ± SEM or mean ± SD (n = 3), as indicated. Statistical analysis was performed using SPSS (version 25, USA). Differences in the means between two independent groups were examined with the independent samples t-test, while one-way analysis of variance (ANOVA), followed by Tukey’s HSD post hoc test, was used to compare differences among multiple treatment groups. A p-value < 0.05 was considered statistically significant. The correlation between MG content and antioxidant and antiglycation activities was assessed using Pearson’s correlation analysis.
RESULTS AND DISCUSSION
Phytochemical analysis of kratom extracts
Kratom, a medicinal plant widely utilized across Southeast Asia, has garnered global interest due to its diverse pharmacological activities. Traditionally, it has been used to treat various ailments, particularly pain, diarrhea, and diabetes. The primary active therapeutic substances in kratom are alkaloids, which are predominantly concentrated in its leaves [26,27]. Among these, MG is the most abundant indole alkaloid and has been suggested to be responsible for several pharmacological effects. Additionally, kratom leaves contain flavonoids, tannins, and triterpenoids, which also exhibit important pharmacological activities. However, it has been reported that the phytochemical profile of kratom, particularly its alkaloid content, varies depending on geographical location and climatic conditions, potentially influencing both its therapeutic efficacy and toxicity profile [16,27]. Given these variations, this study extracted kratom leaves using methanol and water and additionally prepared crude alkaloid extracts and purified MG. They were subjected to comparative analyses of their antioxidant, antiglycation, and cytoprotective properties. Additionally, phytochemical screening was performed to identify the chemical constituents present in each extract. The results revealed the presence of phenolics, flavonoids, tannins, and alkaloids in kratom extracts. As shown in Table 1, TPC was observed in higher amounts in KA compared to KM and KW, whereas TTC was more prominent in KM and KW (p < 0.05). The TFC was similar among the three extracts. These findings contrast with those reported by Parthasarathy et al. [28], which found that the methanolic extract exhibited the highest amounts of TPC and TFC compared to alkaloid and aqueous extracts. Additionally, in this study, the HPLC method was employed to standardize each kratom extract based on its MG content. The HPLC chromatogram displayed a peak corresponding to MG with a retention time of 13.9 minutes, as shown in Figure 1. Among the extracts, the highest amount of MG was found in KA, followed by KM and KW (Table 1). Notably, the acid–base extraction process yielded an MG concentration approximately three times higher than that of KM. The lower MG content in KW is likely due to its lipophilic nature and poor water solubility [29]. These findings suggest that KA is rich in both TPC and MG, while KM and KW contain lower levels of these compounds.
Table 1. Phytochemical constituents and MG content in kratom extracts.
| Kratom extracts | TPC* (mg GAE/g extract) | TTC* (mg GAE/g extract) | TFC* (mg QE/g extract) | MG* (mg/g extract) |
|---|---|---|---|---|
| KW | 65.69 ± 1.64a | 40.08 ± 2.91a | 11.01 ± 0.72a | 8.28 ± 0.32a |
| KM | 78.86 ± 7.91b | 35.18 ± 1.66a | 10.72 ± 0.83a | 76.46 ± 3.61b |
| KA | 129.40 ± 3.67c | 18.04 ± 2.76b | 11.25 ± 0.68a | 213.83 ± 17.53c |
* Data are presented as mean ± SD (n = 3). Different superscript within the column indicates significant difference (p < 0.05).
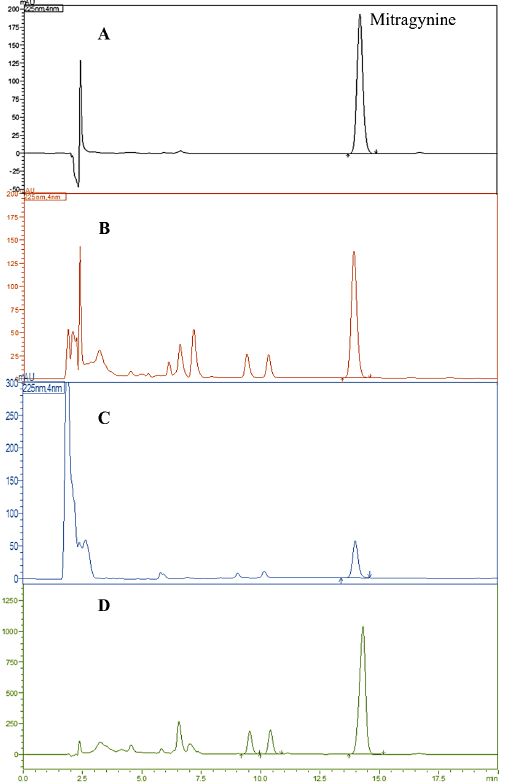 | Figure 1. HPLC chromatogram: (A) Mitragynine (MG); (B) Methanol extract (KM); (C) Aqueous extract (KW); (D) Alkaloid extract (KA). [Click here to view] |
Antioxidant activity of kratom extracts and MG
Preventing oxidative stress-induced cell damage is a promising strategy for managing chronic diseases and their complications. Oxidative stress leads to alterations in biological processes, including impaired cellular function, loss of structural integrity, and DNA damage, which can, in turn, promote further free radical production and perpetuate a cycle of cellular injury [30]. Traditional remedies, such as kratom, have been used in folk medicine for managing chronic diseases, including diabetes, and may offer valuable therapeutic insights [5]. To evaluate the antioxidant capacity of kratom extracts and MG, the DPPH, ABTS, and FRAP assays were used. As summarized in Table 2, it was found that MG exhibited the highest radical scavenging ability, followed by KA, KM, and KW, respectively. However, differences in the IC50 values between the two assays were observed, suggesting that all tested samples demonstrated greater efficacy in scavenging the ABTS radical compared to the DPPH radical. Compared to these assays, the FRAP assay evaluates antioxidant activity based on the reduction potential of metal ions in various substances. The FRAP reaction may exhibit variability depending on the incubation period [31]; in this study, absorbance was measured over a duration of 5 to 60 minutes. Figure 2 illustrates the antioxidant power of each kratom extract and MG. The results showed that KW and KM rapidly reduced Fe3+ to Fe2+ within 5 minutes of the reaction. KW expressed stronger activity than KM, with values of 127.92 ± 6.86 and 106.81 ± 3.44 mM GAE/g extract, respectively. Initially, KA and MG displayed limited antioxidant activity when incubated for 5 minutes; however, with prolonged incubation, their activity increased, nearly matching that of KW and KM after 30 minutes. As reported by Rahmawati [32], the alkaloid extract showed a lower FRAP value compared to crude methanol extract after 10 minutes of reaction. This may be attributed to the weakly basic properties of alkaloids, which may interfere with the redox reaction in the FRAP assay, as it is optimized for an acidic pH. Despite this, the FRAP assay in the present study suggests that kratom extracts and MG exhibited good reducing power. Overall, these antioxidant findings are consistent with previous studies demonstrating the antioxidant activity of kratom extracts and MG [13,28,33]. However, variations in IC50 values have been observed, which may reflect differences in extraction methods, assay conditions, or phytochemical composition.
Table 2. IC50 values of kratom extracts and MG in DPPH, ABTS, and antiglycation assays.
| Samples | DPPH (µg/ml) | ABTS (µg/ml) | Antiglycation* (µg/ml) |
|---|---|---|---|
| Gallic acid | 16.10 ± 0.34a | – | – |
| Trolox | – | 5.43 ± 0.10a | – |
| KW | 1225 ± 50.32b | 51.04 ± 2.63b | 30.05 ± 0.53b |
| KM | 992.26 ± 26.39c | 84.45 ± 4.67c | 4.98 ± 0.76a |
| KA | 850.43 ± 74.73d | 27.87 ± 3.14d | 44.99 ± 11.47b |
| MG | 677.50 ± 55.24e | 12.02 ± 0.43a | 43.39 ± 14.67b |
Gallic acid and trolox were used as positive controls for the DPPH and ABTS assays, respectively. Data are presented as mean ± SD (n = 3). Different superscripts within the column indicate significant difference (p < 0.05). * represents antiglycation activity determined by the BSA-glucose assay.
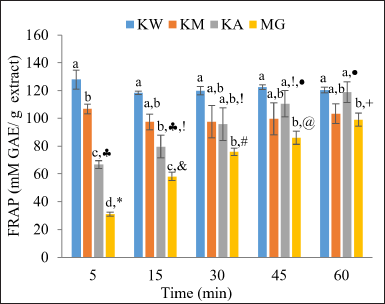 | Figure 2. FRAP assay results for KW, KM, KA, and MG at various time points from 5 to 60 minutes of incubation. Data are presented as mean ± SD (n = 3). Different symbols represent statistically significant differences between time points within the same sample group, and different alphabetic letters represent statistically significant differences between sample groups at the same time point (p < 0.05). KW = Aqueous extract; KM = Methanol extract; KA = Alkaloid extract; MG = Mitragynine. [Click here to view] |
Antiglycation activity of kratom extracts and MG
Free radicals play a crucial role in the glycation reaction and subsequent AGEs formation, which can contribute to the onset and progression of various diseases, including diabetes mellitus (DM), Alzheimer’s disease, cardiovascular, liver, and kidney diseases. It has been reported that high levels of AGEs are found in these patients, with further increases observed in those with complications. Therefore, targeting AGEs is a key strategy for the management of a broad range of chronic diseases and their complications [2]. Given that natural compounds possessing antioxidant properties have the potential to inhibit glycation or AGEs formation [34], this study examined the effect of kratom extracts and MG in both BSA-glucose and BSA-MGO models under identical conditions (2-week incubation, same concentration range) to allow direct comparison. In the BSA-glucose model, AGEs formation increases by 1.6-fold compared to the blank control group (Fig. 3A). Kratom extracts and MG exhibited dose-dependent inhibition of AGEs formation. Comparable to aminoguanidine, a prototype antiglycation drug that inhibits AGEs formation via scavenging reactive carbonyl groups, kratom extracts and MG showed higher antiglycation activity at the same tested concentration (Fig. 3B). Analysis of IC50 values revealed that KM exhibited the highest antiglycation activity, followed by KW, MG, and KA, respectively (Table 2). In contrast, the BSA-MGO model exhibited substantially higher AGEs formation (31.9-fold compared to the blank control, Fig. 3A) due to the high reactivity of MGO. While kratom extracts and MG demonstrated some inhibitory activity (Fig. 3C), the overall inhibition was much lower, and IC50 values could not be determined within the tested concentration range. This may be attributed to the rapid and highly reactive nature of MGO-mediated glycation, which may limit the effectiveness of test compounds at the concentrations used. These results suggest that kratom extracts and MG may primarily exert their antiglycation effects during the early stages of glycation, as represented by the BSA-glucose model, rather than at intermediate stages modeled by MGO. Although the BSA-MGO model remains useful for evaluating carbonyl trapping capacity, further optimization such as testing higher concentrations may be necessary to comprehensively evaluate the antiglycation potential of kratom in this model.
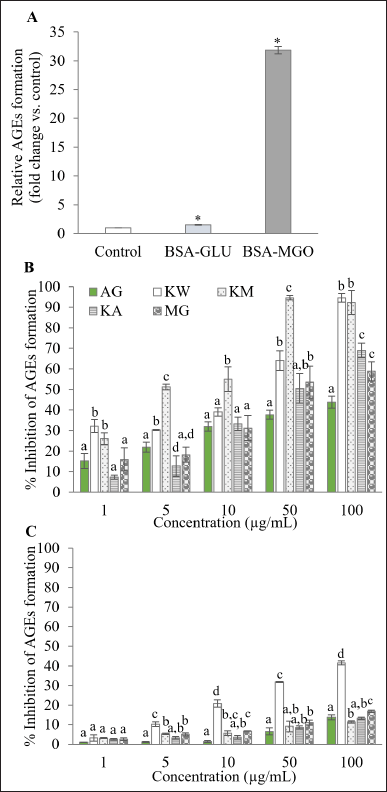 | Figure 3. Antiglycation assay: (A) Formation of AGEs after 2 weeks of incubation in the BSA-glucose and BSA-MGO assays. (B-C) Antiglycation activity of AG, KW, KM, KA, and MG at 1, 5, 10, 50, and 100 µg/ml in the BSA-glucose (B) and BSA-MGO (C) assays. Data are expressed as % inhibition relative to control and are presented as mean ± SD (n = 3). * indicates significant differences compared to the control group (p < 0.05) as determined by the independent samples t-test. Different alphabetic letters represent statistically significant differences between sample groups at the same concentration (p < 0.05). AG = Aminoguanidine; KW = Aqueous extract; KM = Methanol extract; KA = Alkaloid extract; MG = Mitragynine. [Click here to view] |
Currently, it has been reported that several natural products, including polyphenolic, flavonoids, terpenoids, alkaloids, and polysaccharides, exhibit antiglycation activity primarily through mechanisms such as scavenging free radicals and reducing highly reactive glycating agents, such as dicarbonyl compounds [34]. Considering the observed antioxidant activity, kratom extracts and MG may partially inhibit glycation through radical scavenging mechanisms. Therefore, kratom may be considered a promising AGE inhibitor.
Correlation between MG content and antioxidant and antiglycation activities
To further explore the contribution of MG content to antioxidant and antiglycation activities, Pearson’s correlation analysis was performed (Table 3). MG content showed a strong negative correlation with DPPH radical scavenging activity (r = –0.917, p = 0.001), suggesting its potential contribution to free radical scavenging. In contrast, correlations with ABTS or FRAP at either 5 minutes or 30 minutes were not statistically significant. A moderate, non-significant positive correlation was found between MG and antiglycation activity. This implies that MG may play a partial role in glycation inhibition. Moreover, ABTS and antiglycation activity showed a strong, significant negative correlation (r = –0.949, p < 0.001), suggesting that some compounds may possess both activities. Overall, MG appears to be more closely linked to radical scavenging than to ferric reducing or antiglycation capacity. The observed correlations support the notion that antioxidant and antiglycation mechanisms may involve distinct groups of phytochemical constituents.
Table 3. Pearson correlation coefficients between MG content and antioxidant activities (DPPH, ABTS, and FRAP) and antiglycation activity (BSA-glucose).
| MGa | DPPHb | ABTSc | FRAP5d | FRAP30e | Antiglycationf | |
|---|---|---|---|---|---|---|
| MG | 1 | |||||
| DPPH | −0.917** | 1 | ||||
| ABTS | −0.567 | 0.230 | 1 | |||
| FRAP5 | −0.461 | 0.721* | −0.448 | 1 | ||
| FRAP30 | −0.569 | 0.633 | −0.046 | 0.698* | 1 | |
| Antiglycation | 0.503 | −0.142 | −0.949** | 0.457 | −0.057 | 1 |
a MG content (mg/g extract); b IC50 of DPPH; c IC50 of ABTS; d FRAP at 5 minutes; e FRAP at 30 minutes; f IC50 of antiglycation assay (BSA-glucose model).
** Significant at the 0.01 level (2-tailed); * Significant at the 0.05 level (2-tailed).
Effect of kratom extracts and MG on viability in HepG2 cells
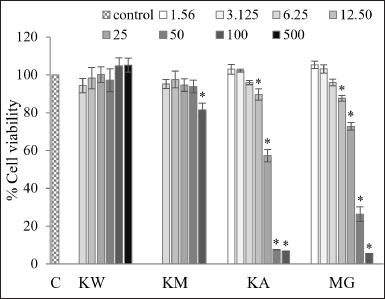
To assess cytotoxicity, HepG2 cells were treated with kratom extracts and MG for 24 hours, followed by the MTT assay. The results (Fig. 4) demonstrated that KW ranging from 6.25 to 500 µg/ml had no substantial toxic effect on cell viability which ranged from 94.37% ± 3.79% to 105.07% ± 3.68%. In addition, the KM (6.25–100 µg/ml) did not affect cell viability up to 50 µg/ml, with values ranging from 96.76% ± 3.31% to 100.48% ± 4.49%. KA and MG were tested at the same concentration range as KM (6.25–100 µg/ml); however, unlike KM, both KA and MG exhibited significant cytotoxicity at concentrations ≥12.5 µg/ml. KA and MG decreased cell viability with values between 6.77% ± 0.11% to 89.53% ± 3.00% and 5.46% ± 0.12% to 87.56% ± 1.45%, respectively. Therefore, the tested concentration of KA and MG was further reduced to 1.56 µg/ml. At this lower range (1.56–6.25 µg/ml), KA and MG had no significant cytotoxicity effect on cell viability. IC50 values were calculated to assess the cytotoxic potency. As KW and KM did not reduce cell viability below 50% even at the highest concentration tested, their IC50 values could not be determined. In contrast, the IC50 value for KA and MG was calculated as 26.37 ± 0.68 µg/ml and 35.31 ± 2.04 µg/ml, respectively. These findings suggest that KW and KM are likely non-cytotoxic or possess low cytotoxicity toward HepG2 cells, while KA exhibited the highest cytotoxicity among the tested samples. Regarding the obtained results, the working concentration ranges of tested samples for further experiments were as follows: 12.5–500 µg/ml for KW, 12.5–50 µg/ml for KM, and 1.56–6.25 µg/ml for KA and MG. When considered alongside the IC50 values, these findings indicate that KA and MG possess a narrow therapeutic window, as their cytotoxic concentrations are slightly higher than their effective working ranges.
 | Figure 4. HepG2 cell viability after 24-hour exposure to KW (6.25–500 µg/ml), KM (6.25–100 µg/ml), KA (1.56–100 µg/ml) and MG (1.56–100 µg/ml). Data are expressed as % cell viability relative to the untreated control and shown as mean ± SEM (n = 3). * indicates significant differences compared to the control group (p < 0.05). C = Control; KW = Aqueous extract; KM = Methanol extract; KA = Alkaloid extract; MG = Mitragynine. [Click here to view] |
These results align with previous findings indicating that at high doses of alkaloid extract and MG, over 11.3 µg/ml, they were cytotoxic, as assessed by the trypan blue exclusion method [35]. Several mechanisms underlying MG-induced cytotoxicity have been described. At high concentrations (75 µM), MG has been shown to induce cell cycle arrest at the G1 and S phases, activate caspase-dependent apoptosis, and disrupt membrane integrity in human SH-SY5Y neuronal cells [36]. Additionally, cytotoxicity of MG has been associated with the inhibition of cytochrome P450 (CYP450), particularly CYP2D6, and CYP3A4/5 [37,38]. A more recent study has demonstrated that MG exhibits moderate cytotoxicity toward HepG2 cells, with an IC50 value of approximately 42 µM while showing non-cytotoxic effects on normal human liver cells (HL-7702) at concentrations below 200 µM. In contrast, paynantheine, the second most abundant kratom alkaloid, exhibited only weak cytotoxicity against both HepG2 and HL-7702 cells [39]. These findings support the view that structural differences among kratom alkaloids contribute to their differential biological activities. Given that the KA contains multiple alkaloids beyond MG, it is possible that synergistic or additive effects among these constituents contribute to the observed cytotoxicity.
Effect of kratom extracts and MG on cytoprotective effect in HepG2 cells
The cytoprotective effect of kratom extracts and MG was performed against H2O2-induced cytotoxicity in HepG2 cells. The concentration of H2O2 which decreased cell viability to about 40%–60% was selected. HepG2 cell viability decreased with an increase in H2O2 concentration. Treatment with 1.5 mM H2O2 decreased cell viability to about 53.64% ± 3.90% in comparison to the control group; therefore, this concentration was selected for subsequent cytoprotective experiments (Fig. 5). Figure 6 illustrates the cytoprotective effects of kratom extracts and MG on HepG2 cells exposed to these treatments 24 hours before inducing cytotoxicity with H2O2. The results show that HepG2 cells treated with KW (12.5–500 µg/ml) exhibited a significant ability to prevent H2O2-induced cytotoxicity by increasing cell viability to about 80.91%–87.55% compared to H2O2 group (p < 0.05). This effect was similar to that of epicatechin, a positive standard, which at 100 µM increased cell viability to about 82.21% (Fig. 6A). On the other hand, KM (12.5–50 µg/ml), KA (1.56–6.25 µg/mlL), and MG (1.56–6.25 µg/ml) did not effective in protecting cells from H2O2-induced cytotoxicity (Fig. 6B–D). These results suggested that KW exhibits considerable cytoprotective activity in this context.
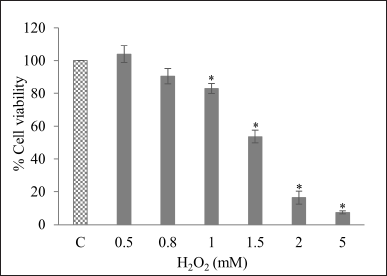 | Figure 5. HepG 2 cell viability after exposure to H2O2 (0.5–5 mM). Data are expressed as % cell viability relative to the untreated control and presented as mean ± SEM (n = 3). * indicates significant differences compared to the control group (p < 0.05) as determined by the independent samples t-test. C = Control; KW = Aqueous extract; KM = Methanol extract; KA = Alkaloid extract; MG = Mitragynine. [Click here to view] |
Effect of kratom extracts and MG on ROS formation in HepG2 cells
The effect of kratom extracts and MG on ROS production was evaluated using the fluorescent probe DCFH-DA, which is deacetylated to form DCFH2 and subsequently reacted with intracellular ROS to produce the fluorescent compound dichlorofluorescein (DCF). As shown in Figure 7, treatment with H2O2 led to a 1.7-fold increase in intracellular ROS compared to the control group (p < 0.05). However, when HepG2 cells were pretreated with kratom extracts or MG, ROS levels decreased relative to the H2O2-treated group. In the KW-treated group (Fig. 7A), the level of ROS significantly decreased (p < 0.05) in a concentration-dependent manner, with a reduction of 27.72%–98.45% compared to the H2O2 group. The positive control, 100 µM epicatechin, suppressed ROS by 37.16%. KM showed a slight decrease in ROS level at a concentration of 25 µg/ml by 20.78% compared to the H2O2 group (p < 0.05) (Fig. 7B). A significant decrease in ROS was observed in HepG2 cells treated with KA and MG by 21.52%–28.78% and 21.77%–37.32%, respectively (Fig. 7C, D). Additionally, it has been reported that both crude methanol and alkaloid extracts can significantly suppress ROS formation in RAW 264.7 macrophages treated with lipopolysaccharides (LPS) and H2O2 at concentrations of 100 and 25 ppm, respectively [32]. These results suggest that kratom extracts and MG effectively mitigate ROS production to varying degrees, reflecting differences in antioxidant potential among the tested samples.
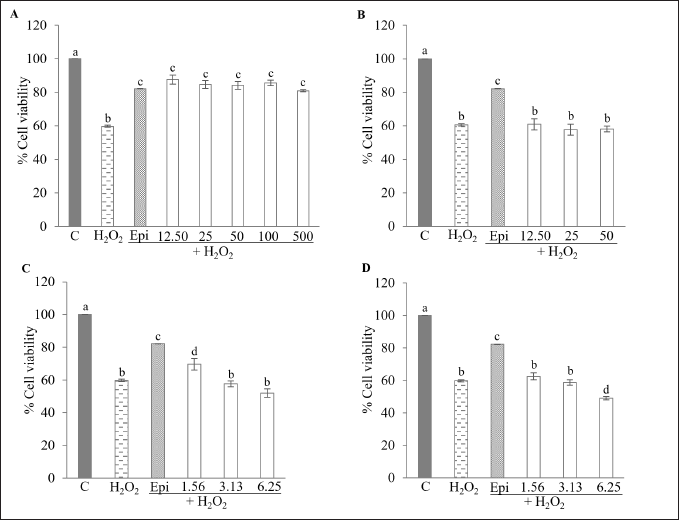 | Figure 6. Cytoprotective effect of KW, KM, KA, and MG against H2O2-induced cytotoxicity assay. HepG2 cells were treated with (A) KW (12.5–500 µg/ml); (B) KM (12.5–50 µg/ml); (C) KA (1.56–6.25 µg/ml); and (D) MG (1.56–6.25 µg/ml). Data are expressed as % cell viability relative to the untreated control and shown as the mean ± SEM (n = 3). Different alphabetic letters are significantly different (p < 0.05). C = Control; Epi = Epicatechin (100 µM); KW = Aqueous extract; KM = Methanol extract; KA = Alkaloid extract; MG = Mitragynine. [Click here to view] |
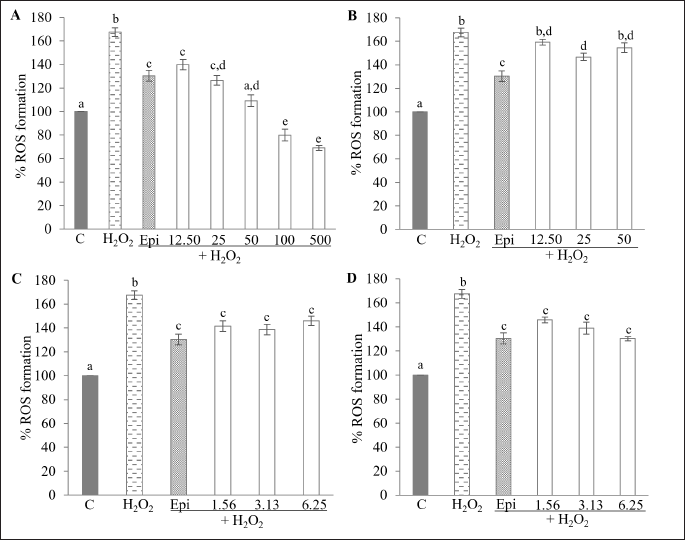 | Figure 7. Effect of KW, KM, KA, and MG on H2O2-induced ROS production in HepG2 cells. Cells were treated with (A) KW (12.5–500 µg/ml); (B) KM (12.5–50 µg/ml); (C) KA (1.56–6.25 µg/ml); (D) MG (1.56–6.25 µg/ml). Data are expressed as % ROS formation relative to the untreated control and shown as the mean ± SEM (n = 3). Different alphabetic letters are significantly different (p < 0.05). C = Control; Epi = Epicatechin (100 µM); KW = Aqueous extract; KM = Methanol extract; KA = Alkaloid extract; MG = Mitragynine. [Click here to view] |
Effect of kratom extracts and MG on lipid peroxidation in HepG2 cells
Lipid peroxidation is a process triggered by oxidative stress, in which polyunsaturated fatty acids (PUFAs) are attacked by ROS. MDA, a primary byproduct of lipid peroxidation, is commonly used as a biomarker to assess oxidative stress. Excessive MDA accumulation can lead to pathological diseases, including diabetes, liver disease, cardiovascular diseases, cancers, and neurodegenerative disorders [40]. Natural compounds that attenuate lipid peroxidation products may serve as promising agents for the prevention and treatment of lipid peroxidation-associated diseases [41]. As shown in Figure 8, HepG2 cells treated with H2O2 alone showed a significant increase in MDA levels, approximately 5.9–7.6 times higher than those in the control group (p < 0.05). Interestingly, pretreatment with various kratom extracts and MG substantially reduced MDA production in a dose-dependent manner. In the group treated with KW (25–500 µg/ml), MDA levels decreased significantly, with a 2.9–10.4-fold reduction compared to the H2O2-only group (p < 0.05) (Fig. 8A). Similarly, in cells treated with KM (12.5–50 µg/ml), MDA levels were reduced by 1.8–3.0 times relative to the H2O2 group (p < 0.05) (Fig. 8B). A comparable protective effect was observed in the KA- and MG-treated groups (1.56–6.25 µg/ml), which showed significant reductions in MDA levels compared to the H2O2 group (p < 0.05) (Fig. 8C, D). These findings are consistent with prior research indicating that kratom ethanolic extract can reduce MDA levels and improve oxidative stress biomarkers in diabetic mice [14]. The results from the HepG2 cell model highlight the potential of kratom as a treatment for oxidative stress-related conditions, supporting further investigation, particularly regarding its traditional use for T2DM management.
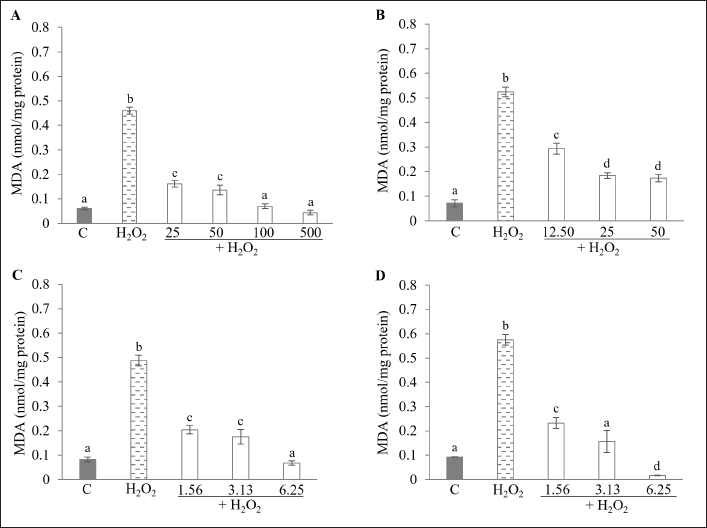 | Figure 8. Effect of KW, KM, KA, and MG on H2O2-induced lipid peroxidation in HepG2 cells. Cells were treated with (A) KW (25–500 µg/ml); (B) KM (12.5–50 µg/ml); (C) KA (1.56–6.25 µg/ml); (D) MG (1.56–6.25 µg/ml). Data are expressed as the mean ± SD (n = 3). Different alphabetic letters are significantly different (p < 0.05). C = Control; KW = Aqueous extract; KM = Methanol extract; KA = Alkaloid extract; MG = Mitragynine. [Click here to view] |
Based on the experimental results, kratom extracts and MG exhibited antioxidant, antiglycation, and cytoprotective effects against H2O2-induced oxidative stress in HepG2 cells. Among the tested samples, MG demonstrated the most potent radical scavenging activity, as indicated by the lowest IC50 in the DPPH and ABTS assays. KW and KM showed rapid metal ion reduction in the FRAP assay and strong antiglycation activity, reflecting their redox-modulating capabilities. However, cytotoxicity varied among the extracts. KA and MG were more cytotoxic than KW and KM. Notably, although KM, KA, and MG reduced ROS and lipid peroxidation at non-toxic concentrations, only KW could significantly reduce H2O2-induced cell death, suggesting the presence of additional cytoprotective mechanisms in this extract.
Previous phytochemical analyses have revealed that kratom leaves contain various flavonoids and polyphenols, including rutin, quercetin, epicatechin, procyanidin B2, and chlorogenic acid. These compounds are well-known for their antioxidant and cytoprotective effects [11,13]. The differences in antioxidant activities among the extracts may be attributed to variations in the composition and relative abundance of these compounds. KW stood out for its low toxicity and strong antioxidant activity, despite containing relatively low MG levels. In contrast, the higher cytotoxicity of KM and KA may be linked to increased concentrations of MG or other alkaloids, which can exert pro-oxidant or apoptotic effects depending on the cellular microenvironment [42,43]. This indicates that MG content alone does not predict bioactivity and that interactions among multiple phytochemicals likely contribute to the overall biological effects.
These findings underscore the importance of synergistic or antagonistic interactions between phytoconstituents. The combination of lipophilic and hydrophilic compounds, particularly phenolics, may result in additive, synergistic, or antagonistic antioxidant effects. These interactions depend on factors such as compound ratio, structural compatibility, redox potential, subcellular localization, and bioavailability [42,44].
Based on general structural considerations, the antioxidant potential of phytochemicals such as phenolics and alkaloids is often influenced by the presence and position of functional groups such as hydroxyl and methoxy moieties. These groups are known to facilitate free radical scavenging through mechanisms such as hydrogen atom transfer (HAT), single-electron transfer-proton transfer (SET-PT), and sequential proton loss electron transfer (SPLET) [45]. MG contains methoxy substituents and a polycyclic indole structure which may contribute to moderate radical-stabilizing properties [46]. However, its overall antioxidant capacity, as observed in the current assays, was lower than that of phenolic compounds such as gallic acid and quercetin [33].
Beyond direct antioxidant effects, many phytochemicals activate cellular signaling pathways such as the nuclear factor erythroid 2-related factor 2 (Nrf2)/antioxidant response element (ARE) axis, which regulates oxidative stress responses. Nrf2 activation results in its translocation into the nucleus, where it binds to AREs and promotes the expression of antioxidant and phase II detoxifying enzymes, including heme oxygenase-1 (HO-1), catalase, and superoxide dismutase. Polyphenols, such as phenolic acids, flavonoids, terpenes, and tannins, have been reported to modulate this pathway and influence its epigenetic regulation [47]. Some alkaloids have also been shown to inhibit NADPH oxidase, a key enzyme involved in ROS production, activate the Nrf2 pathway, and influence peroxisome proliferator-activated receptors levels [42]. Thus, the observed antioxidant effects may result not only from direct ROS scavenging but also from upstream modulation of oxidative stress responses. However, further validation involving gene expression assays is warranted.
From a clinical perspective, oxidative stress is implicated in numerous chronic diseases including T2DM, cardiovascular diseases, neurodegenerative disorders, and cancer [1]. Preclinical evidence supports the role of kratom and its major alkaloids, particularly MG, in modulating oxidative stress and associated pathways. MG has demonstrated antioxidant, anti-inflammatory, neuroprotective, lipolytic, and enzyme-inhibitory activities relevant to these conditions. For instance, MG inhibits acetylcholinesterase and α-glucosidase, which may provide therapeutic benefits for Alzheimer’s disease and diabetes, respectively. Moreover, clinical studies have suggested its lipid-lowering effects and potential utility in managing metabolic syndrome and cardiovascular diseases [48–50].
The safety profile of kratom extracts and MG have been evaluated in several in vivo studies. In diabetic rodent models, ethanolic extracts of kratom leaves administered at 100–400 mg/kg/day improved glucose tolerance and lipid profiles without notable toxicity [14]. Acute toxicity studies using aqueous extracts reported no toxic effects at doses up to 2,000 mg/kg body weight, classifying them as category 5 or unclassified under the GHS system. Sub-chronic toxicity studies further identified a no observed adverse effect level (NOAEL) of 1,000 mg/kg body weight, indicating a low toxicity profile for the extract [51]. For MG, oral administration at 1 and 10 mg/kg body weight for 28 days did not produce adverse effects in Sprague Dawley rats. However, a high dose of 100 mg/kg body weight induced hepatic stress without lethality [52].
Despite these promising findings, current clinical evidence remains limited, and safety concerns warrant careful consideration. MG has been associated with hepatotoxicity, neurotoxicity, and kratom-related fatalities, particularly at high doses or when used in combination with other substances [53]. Case reports have documented MG-induced cholestatic or mixed-pattern liver injury [54,55]. Forensic investigations have identified MG plasma levels exceeding 1,000 ng/ml in kratom-related deaths [56], while regular users showed a median plasma level of 90.86 ng/ml (range 14.7–380.7 ng/ml) [49]. The IC50 value for MG cytotoxicity observed in this study (35.31 µg/ml) is much higher than reported plasma levels, suggesting that the cytotoxic threshold in cell models does not directly reflect fatal exposures. This highlights the need for caution when extrapolating in vitro findings to in vivo contexts. Systemic toxicity may result from complex pharmacodynamic interactions, metabolite effects, or cumulative exposure. Moreover, due to frequent polydrug use and limited toxicology data, the direct contribution of MG to observed adverse events remains inconclusive [56,57].
Recent reviews have emphasized the complex and evolving safety profile of kratom. While many users report beneficial effects such as pain relief, mood enhancement, and self-management of substance use disorders, some studies indicate risks of dependence, withdrawal symptoms, and adverse events. Most reported side effects are mild and self-limiting, including nausea, dizziness, and constipation. However, severe adverse events are often associated with adulterated products or polydrug use. Notably, kratom appears to pose a lower risk of respiratory depression compared to classical opioids, possibly due to its partial µ-opioid receptor agonism and low β-arrestin recruitment. Nonetheless, interindividual variability, lack of standardized formulations and dosage regimens, along with product variability continue to complicate risk–benefit assessments. These findings underscore the need for rigorous quality control, well-defined dosing protocols, and close clinical monitoring to ensure the safe therapeutic use of kratom [56,57].
This study reveals that kratom extracts, particularly KW, exhibit promising antioxidant, antiglycation, and cytoprotective activities, which arise from both individual phytochemicals and their interactions. However, this study has certain limitations. First, the primary bioactive constituents of KW were not specifically identified. Future research should consider LC-MS/MS or GC-MS profiling to comprehensively characterize its chemical composition and identify the compounds responsible for the observed effects. Second, the use of HepG2 cells as the sole in vitro model may not fully represent the metabolic characteristics of normal hepatic tissue. HepG2 cells have low expression levels of key CYP450 enzymes, which can limit their response to xenobiotics and oxidative stress [58]. Nonetheless, findings from in vivo studies in diabetic rats have demonstrated consistent metabolic and antioxidant benefits of kratom extract [14], supporting the physiological relevance of the present results and offering preliminary translational insight into its therapeutic potential. Future investigations incorporating non-cancerous hepatic or metabolically relevant cell lines would further strengthen the biological relevance of these findings.
CONCLUSION
Kratom extracts, including KW, KM, KA, and their major alkaloid MG, exhibited antioxidant and antiglycation activities, as demonstrated by DPPH, ABTS, FRAP, BSA-glucose, and BSA-MGO assays. Pearson correlation analysis indicated that both alkaloid and non-alkaloid constituents contributed to these effects. Among the tested samples, KW demonstrated notable cytoprotective activity in HepG2 cells by reducing ROS and MDA levels while exhibiting low cytotoxicity. Overall, KW emerged as the most promising extract due to its multifaceted antioxidant and cytoprotective properties. Further studies are warranted to identify its active constituents, clarify underlying mechanisms, and evaluate safety and therapeutic potential in oxidative stress-related conditions.
LIST OF ABBREVIATIONS
ABTS 2,2′-azino-bis (3-ethylbenzthiazoline-6-sulphonic acid)
AGEs Advanced glycation end-products
BSA Bovine serum albumin
DCFH-DA 2′,7′-dichlorofluorescein diacetate
DMEM Dulbecco’s Modified Eagle Medium
DPPH 2,2-diphenyl-1-picrylhydrazyl
FBS Fetal bovine serum
FRAP Ferric reducing antioxidant power
GAE Gallic acid equivalents
KW Kratom aqueous extract
KM Kratom methanol extract
KA Kratom alkaloid extract
MDA Malondialdehyde
MG Mitragynine
MGO Methylglyoxal
MTT 3-(4,5-dimethylthiazol-2-yl)-2,5-diphenyl-tetrazolium bromide
ROS Reactive oxygen species
AUTHOR CONTRIBUTION
All authors made substantial contributions to the conception and design, acquisition of data, or analysis and interpretation of data; took part in drafting the article or revising it critically for important intellectual content; agreed to submit to the current journal; gave final approval of the version to be published; and agree to be accountable for all aspects of the work. All authors are eligible to be an author as per the International Committee of Medical Journal Editors (ICMJE) requirements/guidelines.
CONFLICTS OF INTEREST
The authors report no financial or any other conflicts of interest in this work.
ETHICAL APPROVALS
This study does not involve experiments on animals or human subjects.
DATA AVAILABILITY
All data generated and analyzed are included in this research article.
ACKNOWLEDGMENTS
This work was supported by the Thailand Science Research and Innovation (TSRI) (MRG6180289) and the Graduate School of Prince of Songkla University.
PUBLISHER’S NOTE
All claims expressed in this article are solely those of the authors and do not necessarily represent those of the publisher, the editors and the reviewers. This journal remains neutral with regard to jurisdictional claims in published institutional affiliation.
USE OF ARTIFICIAL INTELLIGENCE (AI)-ASSISTED TECHNOLOGY
The authors declares that they have not used artificial intelligence (AI)-tools for writing and editing of the manuscript, and no images were manipulated using AI.
REFERENCES
1. Forman HJ, Zhang H. Targeting oxidative stress in disease: promise and limitations of antioxidant therapy. Nat Rev Drug Discov. 2021;20(9):689–709. CrossRef
2. Zhang Y, Zhang Z, Tu C, Chen X, He R. Advanced glycation end products in disease development and potential interventions. Antioxidants. 2025;14(4):492. CrossRef
3. Muscolo A, Mariateresa O, Giulio T, Mariateresa R. Oxidative stress: the role of antioxidant phytochemicals in the prevention and treatment of diseases. Int J Mol Sci. 2024;25(6):3264. CrossRef
4. Brown PN, Lund JA, Murch SJ. A botanical, phytochemical and ethnomedicinal review of the genus Mitragyna korth: implications for products sold as kratom. J Ethnopharmacol. 2017;202:302–25. CrossRef
5. Nakaphan T, Teerachaisakul M, Puttum S, Sompimai K, Nootim P. Traditional use of kratom (Mitragyna speciosa Korth) among folk healers in Southern Thailand. J Thai Tradit Altern Med. 2016;14(3):274–85.
6. Nowotny K, Jung T, Höhn A, Weber D, Grune T. Advanced glycation end products and oxidative stress in type 2 diabetes mellitus. Biomolecules. 2015;5(1):194–222. CrossRef
7. Meireles V, Rosado T, Barroso M, Soares S, Gonçalves J, Luís Â, et al. Mitragyna speciosa: Clinical, toxicological aspects and analysis in biological and non-biological samples. Med Basel Switz. 2019;6(1):10035. CrossRef
8. Matsumoto K, Mizowaki M, Suchitra T, Takayama H, Sakai S, Aimi N, et al. Antinociceptive action of mitragynine in mice: Evidence for the involvement of supraspinal opioid receptors. Life Sci. 1996;59(14):1149–55. CrossRef
9. Matsumoto K, Horie S, Ishikawa H, Takayama H, Aimi N, Ponglux D, et al. Antinociceptive effect of 7-hydroxymitragynine in mice: discovery of an orally active opioid analgesic from the Thai medicinal herb Mitragyna speciosa. Life Sci. 2004;74(17):2143–55. CrossRef
10. Kruegel AC, Gassaway MM, Kapoor A, Váradi A, Majumdar S, Filizola M, et al. Synthetic and receptor signaling explorations of the Mitragyna alkaloids: Mitragynine as an atypical molecular framework for opioid receptor modulators. J Am Chem Soc. 2016;138(21):6754–64. CrossRef
11. Zailan NFZ, Sarchio SNE, Hassan M. Evaluation of phytochemical composition, antioxidant and anti-diabetic activities of Mitragyna speciosa methanolic extract (MSME). Malays J Med Health Sci. 2022;18(SUPP21):92–9. CrossRef
12. Purintrapiban J, Keawpradub N, Kansenalak S, Chittrakarn S, Janchawee B, Sawangjaroen K. Study on glucose transport in muscle cells by extracts from Mitragyna speciosa (Korth) and mitragynine. Nat Prod Res. 2011;25(15):1379–87. CrossRef
13. Limcharoen T, Pouyfung P, Ngamdokmai N, Prasopthum A, Ahmad AR, Wisdawati W, et al. Inhibition of α-glucosidase and pancreatic lipase properties of Mitragyna speciosa (Korth.) Havil. (kratom) leaves. Nutrients. 2022;14(19). CrossRef
14. Zhang P, Wei W, Zhang X, Wen C, Ovatlarnporn C, Olatunji OJ. Antidiabetic and antioxidant activities of Mitragyna speciosa (kratom) leaf extract in type 2 diabetic rats. Biomed Pharmacother. 2023;162:114689. CrossRef
15. Keawpradub N. Alkaloids from the fresh leaves of Mitragyna speciosa [Master’s thesis]. Bangkok: Chulalongkorn University; 1990.
16. Sengnon N, Vonghirundecha P, Chaichan W, Juengwatanatrakul T, Onthong J, Kitprasong P, et al. Seasonal and geographic variation in alkaloid content of kratom (Mitragyna speciosa (Korth.) Havil.) from Thailand. Plants. 2023;12(4):40949. CrossRef
17. Singleton VL, Orthofer R, Lamuela-Raventós RM. [14] Analysis of total phenols and other oxidation substrates and antioxidants by means of folin-ciocalteu reagent. In: Packer L, editor. Methods in enzymology [Internet]. San Diego, CA: Academic Press; 1999. pp. 152–78. CrossRef
18. Makkar H, Blummel M, Borowy N, Becker K. Gravimetric determination of tannins and their correlations with chemical and protein precipitation methods. J Sci Food Agric. 1993;61(2):161–5. CrossRef
19. Mohammad NI, Mohammad SHK, Syed Md AK, Mahmudul H, Ebrahim khan S, Imran BH, et al. Total phenol, total flavonoid content and antioxidant potential of methanol extract of Boehmeria platyphylla D Don leaves. World J Pharm Res. 2016;5(5):334–44. CrossRef
20. Gang Y, Eom T-Y, Marasinghe SD, Lee Y, Jo E, Oh C. Optimising the DPPH assay for cell-free marine microorganism supernatants. Mar Drugs. 2021;19(5):256. CrossRef
21. Yagi S, Drouart N, Bourgaud F, Henry M, Chapleur Y, Laurain-Mattar D. Antioxidant and antiglycation properties of Hydnora johannis roots. South Afr J Bot. 2013;84:124–7. CrossRef
22. Benzie IFF, Strain JJ. The ferric reducing ability of plasma (FRAP) as a measure of “antioxidant power”: the FRAP assay. Anal Biochem. 1996;239(1):70–6. CrossRef
23. Sugiura S, Minami Y, Taniguchi R, Tanaka R, Miyake H, Mori T, et al. Evaluation of anti-glycation activities of phlorotannins in human and bovine serum albumin-methylglyoxal models. Nat Prod Commun. 2017;12(11):1934578X1701201137. CrossRef
24. Mosmann T. Rapid colorimetric assay for cellular growth and survival: Application to proliferation and cytotoxicity assays. J Immunol Methods. 1983;65(1–2):55–63. CrossRef
25. Kong KW, Mat-Junit S, Aminudin N, Hassan FA, Ismail A, Abdul Aziz A. Protective effects of the extracts of Barringtonia racemosa shoots against oxidative damage in HepG2 cells. PeerJ. 2016;4:e1628. CrossRef
26. Grundmann O, Hendrickson RG, Greenberg MI. Kratom: History, pharmacology, current user trends, adverse health effects and potential benefits. Dis--Mon DM. 2023;69(6):101442. CrossRef
27. León F, Habib E, Adkins JE, Furr EB, McCurdy CR, Cutler SJ. Phytochemical characterization of the leaves of Mitragyna speciosa grown in U.S.A. Nat Prod Commun. 2009;4(7):907–10.
28. Parthasarathy S, Bin Azizi J, Ramanathan S, Ismail S, Sasidharan S, Said MIM, et al. Evaluation of antioxidant and antibacterial activities of aqueous, methanolic and alkaloid extracts from Mitragyna speciosa (Rubiaceae family) leaves. Mol Basel Switz. 2009;14(10):3964–74. CrossRef
29. Ramanathan S, Parthasarathy S, Murugaiyah V, Magosso E, Tan SC, Mansor SM. Understanding the physicochemical properties of mitragynine, a principal alkaloid of Mitragyna speciosa, for preclinical evaluation. Mol Basel Switz. 2015;20(3):4915–27. CrossRef
30. Sharifi-Rad M, Anil Kumar NV, Zucca P, Varoni EM, Dini L, Panzarini E, et al. Lifestyle, oxidative stress, and antioxidants: back and forth in the pathophysiology of chronic diseases. Front Physiol. 2020;11:694. CrossRef
31. Shahidi F, Zhong Y. Measurement of antioxidant activity. J Funct Foods. 2015;18:757–81. CrossRef
32. Rahmawati SI, Indriani DW, Ningsih FN, Hardhiyuna M, Firdayani F, Ahmadi P, et al. Dual anti-inflammatory activities of COX-2/5-LOX driven by kratom alkaloid extracts in lipopolysaccharide-induced RAW 264.7 cells. Sci Rep. 2024;14(1):28993. CrossRef
33. Goh TB, Koh RY, Mordi MN, Mansor SM. Antioxidant value and antiproliferative efficacy of mitragynine and a silane reduced analogue. Asian Pac J Cancer Prev APJCP. 2014;15(14):5659–65.
34. Song Q, Liu J, Dong L, Wang X, Zhang X. Novel advances in inhibiting advanced glycation end product formation using natural compounds. Biomed Pharmacother. 2021;140:111750. CrossRef
35. Saidin NA. Cytotoxicity of extract of Malaysian Mitragyna speciosa korth and its dominant alkaloid mitragynine [PhD thesis]. London: Imperial College London; 2008.
36. Saidin NA, Holmes E, Takayama H, Gooderham NJ. The cellular toxicology of mitragynine, the dominant alkaloid of the narcotic-like herb, Mitragyna speciosa Korth. Toxicol Res. 2015;4(5):1173–83. CrossRef
37. Kamble SH, Sharma A, King TI, Berthold EC, León F, Meyer PKL, et al. Exploration of cytochrome P450 inhibition mediated drug-drug interaction potential of kratom alkaloids. Toxicol Lett. 2020;319:148–54. CrossRef
38. Karunakaran T, Ngew KZ, Zailan AAD, Mian Jong VY, Abu Bakar MH. The chemical and pharmacological properties of mitragynine and its diastereomers: an insight review. Front Pharmacol. 2022;13:805986. CrossRef
39. Karunakaran T, Ganasan J, Rusmadi NN, Santhanam R, Mordi MN. In-vitro hepatotoxic activity of mitragynine and paynantheine isolated from the leaves of Mitragyna speciosa Korth. (Kratom). Nat Prod Res. 2024;2024:1–5. CrossRef
40. Ali J, Aziz MA, Rashid MMO, Basher MA, Islam MS. Propagation of age-related diseases due to the changes of lipid peroxide and antioxidant levels in elderly people: a narrative review. Health Sci Rep. 2022;5(3):e650. CrossRef
41. Greanious AM, Chikuse FF, Makoni P, Sibanda A, Ncube N, Dube D. Phytotherapeutics attenuation of oxidative stress, inflammation and lipid peroxidation in severe and chronic diseases. In: Atukeren P, editor. Accenting lipid peroxidation. Rijeka: IntechOpen; 2021]. CrossRef
42. Macáková K, Afonso R, Saso L, Mladenka P. The influence of alkaloids on oxidative stress and related signaling pathways. Free Radic Biol Med. 2019;134:429–44. CrossRef
43. Gjorgieva Ackova D, Maksimova V, Smilkov K, Buttari B, Arese M, Saso L. Alkaloids as natural NRF2 inhibitors: chemoprevention and cytotoxic action in cancer. Pharm Basel Switz. 2023;16(6):850. CrossRef
44. Chen X, Li H, Zhang B, Deng Z. The synergistic and antagonistic antioxidant interactions of dietary phytochemical combinations. Crit Rev Food Sci Nutr. 2022;62(20):5658–77. CrossRef
45. Chen J, Yang J, Ma L, Li J, Shahzad N, Kim CK. Structure-antioxidant activity relationship of methoxy, phenolic hydroxyl, and carboxylic acid groups of phenolic acids. Sci Rep. 2020;10(1):2611. CrossRef
46. Sengul I, Bingul M, Kandemir H, Kumar N, Black D. Synthesis, reactivity and biological properties of methoxy-activated indoles. In: Attanasi O, Gabriele B, Merino P, Spinelli D, editors. Targets in heterocyclic systems. Rome: Società Chimica Italiana; 2022. pp: 162–212.
47. Thiruvengadam M, Venkidasamy B, Subramanian U, Samynathan R, Ali Shariati M, Rebezov M, et al. Bioactive compounds in oxidative stress-mediated diseases: targeting the NRF2/ARE signaling pathway and epigenetic regulation. Antioxidants. 2021;10(12):1859. CrossRef
48. La-Up A, Saengow U, Aramrattana A. High serum high-density lipoprotein and low serum triglycerides in kratom users: a study of kratom users in Thailand. Heliyon. 2021;7(4):e06931. CrossRef
49. La-Up A, Wongrith P, Chaichan W, Aramrattana A, Saengow U. Association between kratom (Mitragyna speciosa) use and metabolic syndrome. Heliyon. 2022;8(5):e09468. CrossRef
50. Ramachandram DS, Chia S, Kow RR. Comparison of biochemical and safety parameters of regular kratom (Mitragyna speciosa Korth.) users at two different time periods. J Subst Use. 2023;28(1):20–5. CrossRef
51. Srimangkornkaew P, Suwannasaroj K, Sirimontaporn A. Acute and sub-chronic oral toxicity of kratom leaves aqueous extract in Wistar rats. Bull Dep Med Sci. 2024;66(2):186–207.
52. Sabetghadam A, Ramanathan S, Sasidharan S, Mansor SM. Subchronic exposure to mitragynine, the principal alkaloid of Mitragyna speciosa, in rats. J Ethnopharmacol. 2013;146(3):815–23. CrossRef
53. Prevete E, Kuypers KPC, Theunissen EL, Esposito G, Ramaekers JG, Pasquini M, et al. Clinical implications of kratom (Mitragyna speciosa) use: a literature review. Curr Addict Rep. 2023;10(2):317–34. CrossRef
54. Schimmel J, Dart RC. Kratom (Mitragyna Speciosa) liver injury: a comprehensive review. Drugs. 2020;80(3):263–83. CrossRef
55. Botejue M, Walia G, Shahin O, Sharma J, Zackria R. Kratom-induced liver injury: a case series and clinical implications. Cureus. 2021;13(4):e14679. CrossRef
56. Papsun D, Schroeder W, Brower J, Logan B. Forensic implications of kratom: Kratom toxicity, correlation with mitragynine concentrations, and polypharmacy. Curr Addict Rep. 2023;10(2):272–81. CrossRef
57. Henningfield JE, Grundmann O, Huestis MA, Smith KE. Kratom safety and toxicology in the public health context: Research needs to better inform regulation. Front Pharmacol. 2024;15:1403140. CrossRef
58. Arzumanian VA, Kiseleva OI, Poverennaya EV. The curious case of the HepG2 cell line: 40 years of expertise. Int J Mol Sci. 2021;22(23):135. CrossRef