INTRODUCTION
Strontium ranelate (STR) is popular and well-known for its role as an isoform of the antiosteoporotic agents utilized for the formation of new bone and inhibition of bone resorption. STR also activates calcium-sensing receptors, which convert pre-osteoblasts to osteoblasts, promoting bone synthesis, as demonstrated in previous studies. Given its role as a pharmaceutical compound, it is crucial to assess the stability and degradation of STR to ensure its quality throughout both its shelf-life and usage period. The stability issues APIs may cause the formation of impurities and if these impurities reach hazardous levels may result in safety concerns for the population. A comprehensive analysis of the degradation pathways of STR, along with the identification of undesirable impurities, is essential to ensure regulatory compliance and safeguard patient health [1,2].
Many prescription medicines possess varying stability chiefly due to the effect of light, temperature, humidity, and pH of their surrounding environment. Such factors can cause the degradation reactions to occur which may cause chemical changes that change the therapeutic values of the drug. The identification of these degradation pathways is a vitally important part of the drug development process because it offers information about possible degradation products and aids the formation of stable formulations. Specifically, improving chromatographic methods such as ultra-performance liquid chromatography (UPLC) and liquid chromatography-mass spectrometry (LC-MS), opens up the way for qualitative and quantitative determination of impurities with high selectivity and sensitivity [3–5].
Few methods for determining STR in API and pharmaceutical formulations have been reported in the literature which includes the spectrophotometric method, HPLC method, stability-indicating HPLC, HPTLC, and capillary electrophoresis method [6–11].
In this study, the degradation kinetics of STR under acidic, basic, oxidative, thermal, and photolytic conditions was estimated. The degradation products resulting from forced degradation under various stress conditions were characterized and quantified using UPLC and LC-MS, providing high resolution for the identification of pharmaceutical compounds. The findings from this study shall be useful in understanding the state of aggregation of STR and aid in the determination of its storage conditions hence helping the regulatory bodies in passing adequate measures to ensure that the drug is of quality and safety.
MATERIALS AND METHODS
Reagents and materials
The STR standard was received as a gift sample from MacLeods Labs Ltd., Daman, India. The marketed STR sachet (STRONAT, 2 gm/sachet, batch no. HPB402A) was purchased from a local pharmacy. For the HPLC analysis, HPLC grade methanol and acetonitrile and AR grade ammonium acetate and glacial acetic acid were purchased from Research Lab Fine Chem Industries, Mumbai, India.
Instrumentation
These UPLC analyses were done using a WATERS UPLC™ System with a quaternary pump, photodiode array (PDA) detector, and auto-injector and all operations were managed by Empower 2 Software. The column was an ACQUITY BEH C18 (1.7 μm, 100 mm × 2.1 mm ID), injection volume of 2 μl. UPLC-MS analysis was performed using Dionex UHPLC Ultimate 3,000 system connected to Bruker Impact II UHR-TOF Mass Spectrometer equipped with ESI-TOF Analyzer [12,13].
Preparation of standard solution
A standard stock solution was prepared by weighing 10 mg of STR into a 100 ml volumetric flask and dissolving the compound in methanol to make the concentration of 100 µg/ml. This solution was then diluted to a stock solution of 50 μg/ml for the determination of the organic impurities in the drug substance and formulated dosage form [14,15].
Preparation of sample solution
An average weight of 6 sachets of STR formulation was recorded and the powder equivalent to 10 mg of STR was accurately weighed and transferred into a 100 ml volumetric flask containing 60 ml of methanol. The powdered sample was dissolved in methanol using ultrasonic extraction for 5 minutes to ensure complete dissolution. The volume was made up to 100 ml with methanol. After making up the volume, the solution was filtered through Whatman filter paper No. 41 to remove any insoluble particles, ensuring a clear solution. The sample solution was suitably diluted to get the concentration of 50 μg/ml for further analysis [13,16].
Preparation of standard impurity solutions
As like standard drug solution preparation, standard impurities solution was also prepared of concentration 100 μg/ml by weighing 10 mg and dissolving it in 100 ml. The prepared solution was further diluted to get a working standard solution of concentration 10 μg/ml. With this working standard solution, the serial dilutions of 0.1 to 0.6 μg/ml.
Mixed standard solution and calibration curve
Samples of the standard stock solution of STR and impurities were taken and diluted in the right proportion to produce individual and mixed calibration standards. The calibration range for STR was determined as 10–60 µg/ml whereas for Impurity A (5-[bis (2-ethoxy-oxoethyl) amino]-4-cyno-2(methoxycarbonyl thiopheacetic acid ethyl ester) and Impurity B dimethyl 2,2`-((3-cyano-4-(2-methoxy-2-oxoethyl)-5- (methoxycarbonyl) thiophen-2-yl) azanediyl)diacetate. To establish the method for qualitative and quantitative analysis of these impurities, spiked samples with these known concentrations were prepared and used to validate the proposed UPLC method for STR impurity profiling as per International Council for Harmonization (ICH) guidelines for accuracy, precision, and sensitivity [17,18].
Chromatographic method optimization and degradation studies
Chromatographic method optimization
During the method development for the estimation of STR along with its two impurities, several trials were performed to decide the proper mobile phase for the UPLC analysis with isocratic elution. In the initial trial, phosphate buffer pH 3.9 and methanol were used as the mobile phase. The use of methanol and buffer in a ratio of 70:30 % v/v at a flow rate of 0.2 ml/minutes, wavelength of detection of 323 nm, and column temperature of 40 0C was attempted. This setup gave three peaks with very poor resolution, with peak tailing, which was not favorable [19].
In the second trial, the mobile phase was modified to Ammonium acetate buffer 10 mM, pH 4.0. The mobile phase of buffer: methanol (90:10) % v/v at a flow rate of 0.15 ml/minutes with the detector wavelength selected was 323 nm and the column was maintained at ambient temperature. This led to reduced tailing and improved plate count. In the third trial, buffer concentration was increased from 10 to 20 mM, with all other conditions unchanged. The trial chromatograms revealed an increase in plate count and decreased the tailing to acceptable levels. Ultimately, the optimized conditions were achieved using an Ammonium acetate buffer (25 mM) pH 3.0 adjusted with glacial acetic acid: methanol (90:10 % v/v) and a 0.2 ml/minutes flow rate. Data was extracted at the wavelength 323 nm and the column temperature was set at ambient temperature. This alignment offered the best range of system suitability parameters i.e. tailing factor, theoretical plates count, resolution, and capacity factor. Well within the acceptable range [20].
Stress degradation studies
Stress testing on the STR was carried out under various conditions: acidic, basic, oxidative, photolytic, and thermal. Through multiple trials, optimal degradation conditions were established. Acidic and basic hydrolysis conditions were set at 0.5 M concentrations of acid/base solutions at 60°C for 4 hours. In the case of oxidative stress testing 1,000 µg/ml STR solution was exposed to 6% hydrogen peroxide at 60°C for 4 hours and for photolytic degradation, the sample solution (1,000 µg /ml) was exposed to sunlight for 24 hours, equivalent to 170 K lux [21]. Wet thermal degradation was conducted by refluxing the 1,000 µg/ml STR solution at 40°C for 4 hours. All these stress degradation samples were then diluted with methanol to get the theoretical concentration of 50 µg/ml and analyzed using optimized chromatography conditions [22–25].
Mass spectrometry
The mass spectrometric analysis was performed using a Dionex UHPLC Ultimate 3000 system coupled with an IMPACT II UHR-TOF Mass Spectrometer configured for positive ionization mode. The instrument parameters were optimized to ensure precise identification of degradation products. A mass range of 50–600 amu was selected to capture relevant molecular ions, while pure nitrogen gas was utilized as the nebulizing agent. The dry gas flow rate was adjusted to 7 l/minutes to maintain a stable ion flow. The capillary voltage was adjusted to 4500V for best ionization and the source temperature was maintained at 200 °C to ensure ion stability and sample consistent results during the analysis [26,27].
Method validation
The optimized method was validated for various parameters of linearity, method sensitivity, and precision. For linearity, five concentrations over the linearity range were injected in triplicate using optimized chromatographic conditions. Obtained chromatograms were integrated and corresponding concentrations were used for the preparation of the calibration curve. Method sensitivity was determined using signal-to-noise ratio as per ICH method development guidelines. Method precision was evaluated by performing repeatability, inter-day, and intra-day precision. The robustness of the method was evaluated by deliberate but small variations in the established method parameters such as mobile phase composition, wavelength, and injection volume. The proposed method of recovery for impurities was performed by spiking impurities to test the solution at the limit of quantification (LOQ) level and levels of 50%, 100%, and 150% in triplicate. For impurities, the limit of recovery was set at 85% to 115 % at 50%, 100%, and 150% recovery level. During these accuracy studies limit to % relative SD (RSD) was set to less than 10% for impurities. The recovery limits for API were 100% ± 2% and % RSD less than 2. Method specificity was evaluated by peak purity test.
Evaluation of method greenness
Since solvents can harm the environment and human health, the main objective for guaranteeing the technique’s greenness is to choose the right solvent throughout method development. Analytical GREEnness (AGREEprep), Green Analytical Procedure Index (GAPI), and Analytical Eco-Scale metrics tools were used to evaluate the greenness of the proposed method. In the AGREEprep tool, data on 10 key parameters was used to determine the environmental impact of an analytical method. AGREE score typically ranges from 0 to 1, with 1 indicating the most desired sustainability. Analytical Eco-Scale is a semi-quantitative method for evaluating greenness. It uses penalty points for energy use, solvent use, sample size, and trash production. The score is determined by deducting the penalty points from 100. GAPI assesses the method greenness in six areas: instruments, chemicals and solvents utilized, method type and sample preparation, sample sourcing, and quantification or qualification. Assessment outcomes are expressed in a pictograph having codes as red, yellow, and green [28,29].
RESULT AND DISCUSSION
Method development
The development of a highly selective and accurate UPLC method for the determination of STR and its related substances in stress degradation studies is presented here. The optimized parameters for this method included an ACQUITY UPLC BEH C18 column (2.1 x 100 mm, 1.7 µm) and the column temperature was set at ambient temperature. Several mobile phase compositions were attempted during the method development step and this consisted of methanol, acetonitrile, and buffer solvents with some changes in pH in isocratic mode. After extensive trials, the ideal mobile phase was identified as Ammonium acetate buffer pH 3.0 adjusted with glacial acetic acid: methanol (90: 10) % v/v ratio, and the detector was set at 323 nm. This optimized setup allowed well-defined peaks for STR and its related substances, which complied with all the system suitability parameters listed in Table 1 and illustrated in Figure 1. Further, STR was well resolved from its degradation products, which proved the method’s versatility for stability and impurity assessment.
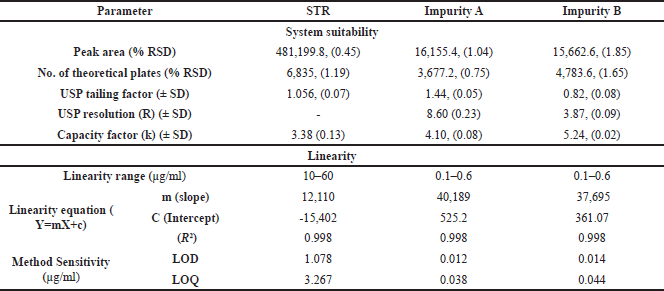 | Table 1. System suitability parameter and linearity of STR and its impurities. [Click here to view] |
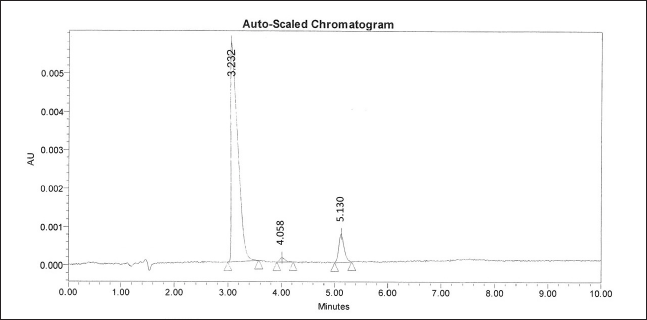 | Figure 1. UPLC chromatogram of STR with impurities. [Click here to view] |
System suitability parameters showed excellent precision with % RSD values for peak area 0.45% for STR, 1.04% for Impurity A, and 1.85% for Impurity B. The theoretical plate count was 6835 for STR, 3677.2 for Impurity A, and 4783.6 for Impurity B. The USP resolution between STR and Impurity A was found to be 8.6 and the resolution between STR and its nearest impurity was 3.87; which indicated good separation. The capacity factors (k) of 3.38 for STR, 4.1 for Impurity A, and 5.24 for Impurity B (Table 1 and Fig. 1). These parameters proved the efficiency of the method to provide reliable impurity data and along with well-resolved degradation peaks.
Method validation
Linearity
Following ICH guidelines, linearity was established for STR and its impurities by constructing calibration curves across specified concentration ranges: 10 to 60 µg/ml for STR and 0.1 to 0.6 µg/ml for Impurities A and B. The calibration curves were plotted as concentration versus peak area and statistical analysis confirmed the linear relationship. The coefficients of determination were found to be 0.9983 for STR, 0.998 for Impurity A, and 0.9984 for Impurity B, indicating excellent linearity within these ranges. The linearity data of STR and its impurities are presented in Table 1 and linearity graphs are presented in Figure 2.
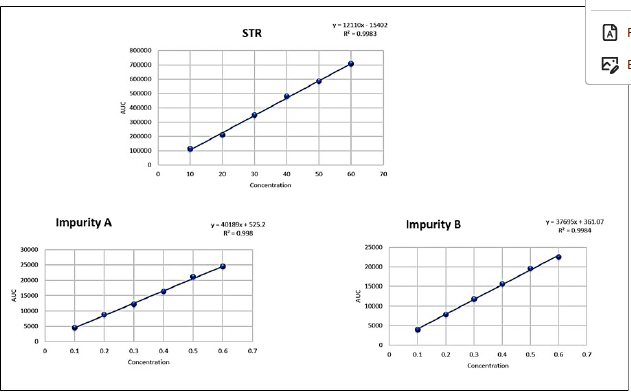 | Figure 2. Linearity of STR and its impurity. [Click here to view] |
Limit of detection and limit of quantification
The limit of detection (LOD) and LOQ were established using the following equations: LOD is calculated to be 3.3 x σ/S and LOQ to be 10 x σ/S, where σ is the standard deviation of peak areas (n = 3), and S is the slope of the calibration curve. The findings of the analysis also established the LOD and LOQ of STR with concentrations of 1.078 µg/ml and 3.267 µg/ml respectively. For this work, the LOD and LOQ are determined to be 0.012 µg/ml and 0.038µg/ml for Impurity A, while for Impurity B, the values were observed to be 0.014 µg/ml and 0.044 µg/ml respectively at three replicate measurements. These values show the potential of the method proving in STR and determination of the value of its impurities at very low concentrations.
Recovery study (Accuracy)
The accuracy study was carried out in the range of LOQ to 150 % level by spiking known impurities. The analysis was conducted in 6 replicates per level and the percent recovery was calculated for each level. The detail of the accuracy data for STR and its impurities is presented in Table 2 below. This result affirms the credibility of the method in detecting STR and its impurities at different concentration levels.
 | Table 2. Accuracy data of STR and its impurities (n = 6). [Click here to view] |
Precision
Computation of %RSD was done to determine the variability of the method through methods such as repeatability and intermediate precision. Inter and intra-day precision was determined on three concentration levels of STR (20 µg/ml, 30 µg/ml, and 40 µg/ml) and its impurities (0.2 µg/ml, 0.3 µg/ml, and 0.4 µg/ml for Impurities A and B). All the measurements were made six times. For the intra-day and inter-day studies, the percentage relative standard deviation which was below 2% indicated the precision of the developed method. The retention time and percentage peak area of STR and its impurities are shown in Table 3.
 | Table 3. Precision studies data for STR and its impurities. [Click here to view] |
Robustness
The applicability of the decision method was tested by applying small variations on controlling factors such as the composition of the mobile phase, the wavelength of detection, and injection volume. The deliberate changes made here demonstrated that there was no significant difference in retention time or peak shape. The assay values suggest that the method is robust when slight changes are made. From the robustness study results (Table 4), it was noted that % recovery values were within the range of 100% ± 1.5% and that the % RSD was less than 2 % thus affirming the robustness of the developed method for STR and its impurities.
 | Table 4. Robustness study data of STR and its impurities (n = 3). [Click here to view] |
Specificity
The absence of interference from the excipients in the formulation with the drug’s peak is confirmed by this result. In aggregate with these results, there were no co-eluting matrix components as shown in Figure 3 during formulation analysis which was compared with the standard chromatogram as shown in Figure 1. The peak purity analysis revealed that the purity angle was well below the purity threshold suggesting a single peak for STR as depicted in Figure 4.
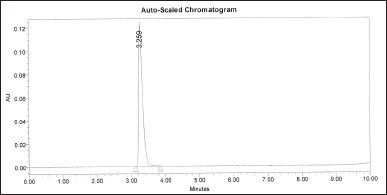 | Figure 3. Chromatogram of STR formulation. [Click here to view] |
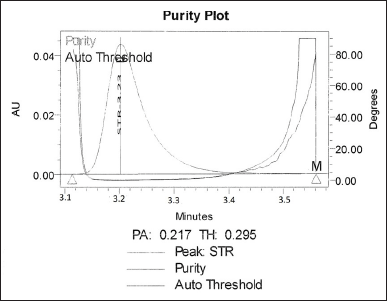 | Figure 4. Peak purity plot of STR formulation. [Click here to view] |
Stress degradation study
All stress degradation samples were analyzed using the optimized UPLC conditions with a PDA detector. STR exhibited moderate degradation under thermal, oxidative, acidic hydrolysis, and alkaline hydrolysis conditions. Whereas it was found to be resistant to photolytic degradation conditions. To assess the specificity of the method, purity angle (Pk. Ang) and purity threshold (Pk Th.) values were evaluated and found to comply with standard requirements, indicating homogeneity of the analyte peak. The chromatograms of stress-degraded samples are presented as follows: acidic hydrolysis, alkaline hydrolysis, oxidative degradation, thermal degradation, and photolytic degradation (Fig. 5). A summary of STR’s degradation behavior under various stress conditions is provided in Table 5.
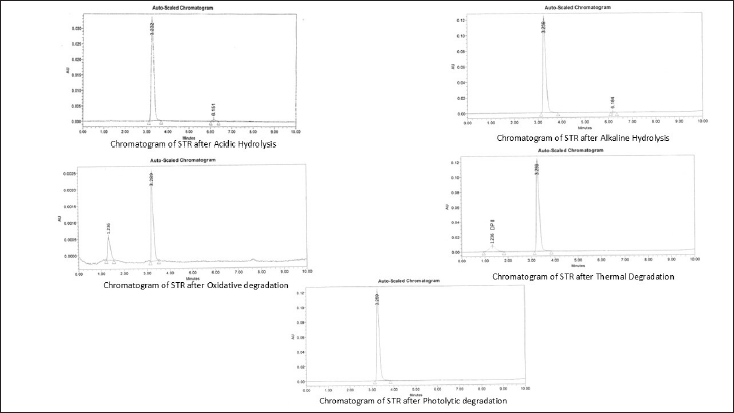 | Figure 5. Stress degradation chromatogram of STR. [Click here to view] |
 | Table 5. Summary of stress degradation. [Click here to view] |
Mass spectrometry
Mass spectrometric analysis was conducted using a Dionex UHPLC Ultimate 3000 system coupled with an IMPACT II UHR-TOF Mass Spectrometer in positive ionization mode, with a mass range of 50–600 amu. The optimized conditions included a nitrogen nebulizing gas flow rate of 7 l/minutes, a capillary voltage of 4500 V, and a source temperature of 200°C.
Three degradation products were identified based on their retention times and molecular ion peaks. Degradation product DP I eluted at a retention time (tR) of 6.151 minutes, displaying a molecular ion peak at 298.03 amu (M+H)? (Fig. 6a) whereas DP II was detected at tR 1.236 minutes with a molecular ion peak at 221.97 amu (Fig. 6b).
Based on the LC/MS data, probable structures, and fragmentation patterns were proposed for each degradation product. The fragmentation pattern for DP I attributed to acid hydrolysis and alkaline hydrolysis, is shown in Figure 7a with an m/z of 298.03. The fragmentation pattern of oxidative degradation product and thermal degradation product DP II is depicted in Figure 7b with an m/z of 221.97, These results highlight the method’s capability in identifying and characterizing degradation products of STR.
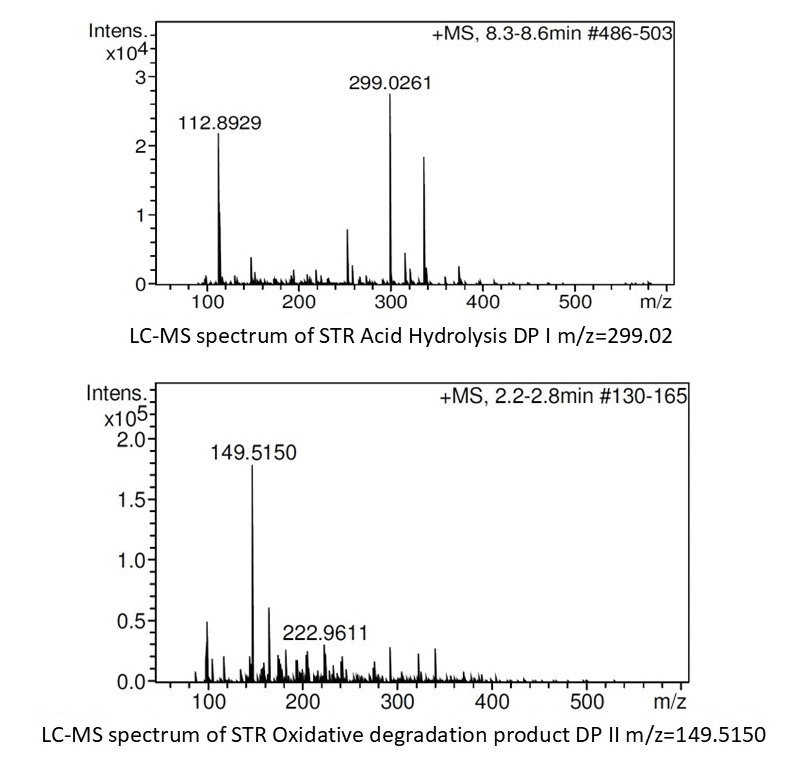 | Figure 6. Line spectra of the DP’s (a) DPI and (b) DP II obtained in MS/TOF study. [Click here to view] |
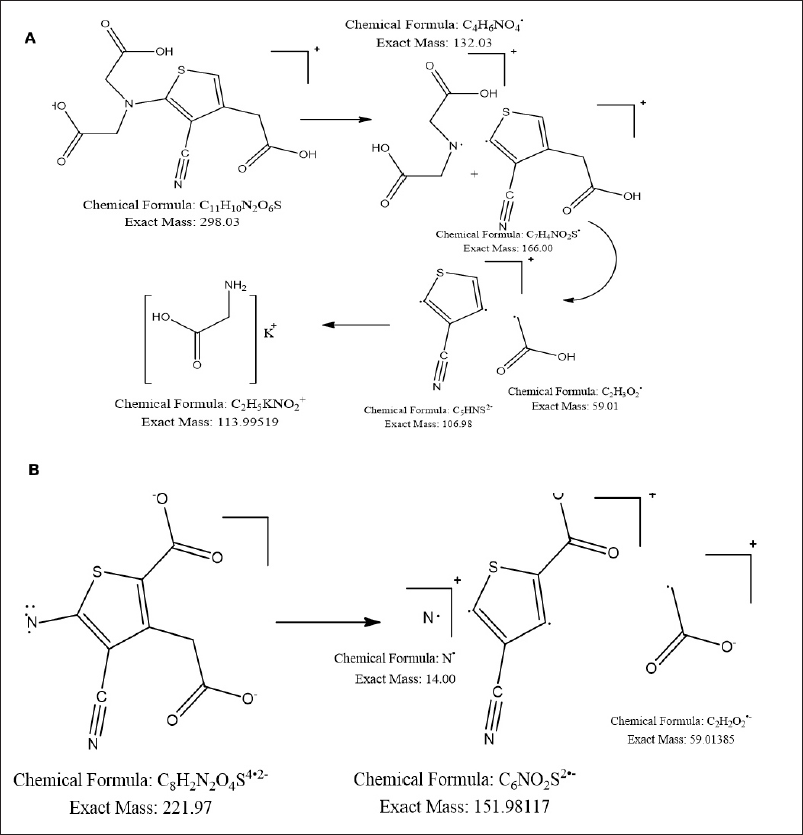 | Figure 7. Proposed fragmentation pattern of (a) acid hydrolysis degradation product DP I with m/z=298.03 and (b) oxidative degradation product DP II with m/z=221.97. [Click here to view] |
Green analytical metric tools assessment
The green assessment was conducted by comparing the proposed method with the reported one, employing green metric tools such as AGREEprep, GAPI, and the Analytical Eco-Scale.
The proposed analytical method utilizes Methanol and a buffer as a mobile phase. A column measuring 100 mm x 2.1 mm with a particle size of 1.7 µm was employed, and the total analysis time for three components (STR, Impurity A, and Impurity B) was 10 minutes.
The proposed methodology was thoroughly evaluated using AGREEprep greenness assessment tools. The procedure followed during the experiments was input into the software, and the results were visually represented in Figure 8a where the score was 0.69. The GAPI pictograms provide a comprehensive overview of the method at each stage, using green, yellow, and red to indicate different levels of greenness. This advanced tool evaluates the method’s greenness holistically, presenting all stages in a single pictogram. Out of the 15 pictograms, only 3 representing solvents/reagents used for analysis, waste, and collection were marked in the red region. The remaining pictograms, indicating a transition from yellow to green, reflect the method’s overall greenness, as shown in Figure 8b and it shows the GAPI index as 84.
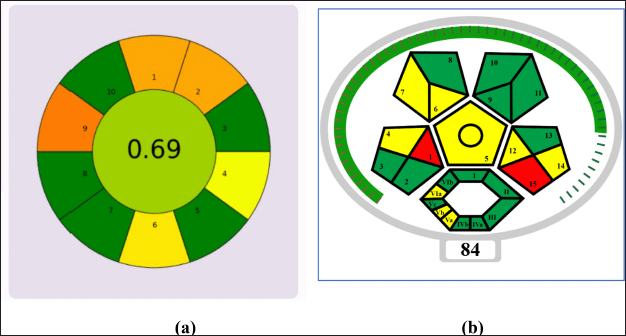 | Figure 8. Greenness assessment by (a) AGREEprep (Analytical GREEnness metric approach) and (b) complex GAPI. [Click here to view] |
The Analytical Eco-Scale assessment, evaluates the chemicals and reagents used, energy consumption of instruments, waste generation, and management for both methods. The results indicate that the proposed method received a total penalty of 17 points, achieving an excellent greenness score of 83.
CONCLUSION
In conclusion, a simple, accurate, precise, and specific UPLC method was successfully developed for impurity profiling and degradation product analysis of STR. Stress degradation studies confirmed that STR is susceptible to degradation under hydrolytic, oxidative, and thermal conditions, whereas it was found to be resistant to photolytic degradation. The stress degradation study revealed that it is more susceptible to oxidative stress leading to the highest degradation levels. The mass spectrometric analysis further allowed for the elucidation of the probable structures of the two major degradation products through mass fragmentation patterns and m/z values.
This optimized UPLC method demonstrates high sensitivity, reduced solvent usage, improved resolution, and rapid analysis times, meeting industry needs for efficiency and cost-effectiveness without compromising quality. Therefore, this method is suitable as a robust quality control tool for the analysis of STR, enabling accurate impurity profiling and stability assessment in pharmaceutical applications.
Three analytical tools were used, including, AGREEprep, ComplexGAPI, and the analytical eco-scale for the greenness assessment of the proposed method. The assessment across three matrices confirmed the validity of the optimized methodology, which is both environmentally sustainable and cost-effective, requiring no extravagant solvent consumption.
LIST OF ABBREVIATIONS
CIF: Central Instrumentation Facility; DP: Degradation Product; ICH: International Council for Harmonization; LOD: Limit of Detection; LOQ: Limit of Quantification; MS: Mass Spectrometry; PDA: Photodiode Array; Pk Th.: Purity Threshold; Pk. Ang: Purity Angle; RSD: Relative Standard Deviation; STR: Strontium Ranelate; UPLC: Ultra-Performance Liquid Chromatography.
ACKNOWLEDGEMENT
The authors are grateful to the Serum Institute of India, Pune, for providing access to UPLC facilities, and to the Central Instrumentation Facility (CIF) at Savitribai Phule Pune University for supporting this research with UPLC-MS instrumentation.
FUNDING
There is no funding to report.
AUTHOR CONTRIBUTION STATEMENT
All authors made substantial contributions to conception and design, acquisition of data, or analysis and interpretation of data; took part in drafting the article or revising it critically for important intellectual content; agreed to submit to the current journal; gave final approval of the version to be published; and agree to be accountable for all aspects of the work. All the authors are eligible to be an author as per the International Committee of Medical Journal Editors (ICMJE) requirements/guidelines.
CONFLICTS OF INTEREST
The author reports no financial or any other conflicts of interest in this work.
ETHICAL APPROVALS
This study does not involve experiments on animals or human subjects.
DATA AVAILABILITY
All data generated and analyzed are included in this research article.
PUBLISHER’S NOTE
All claims expressed in this article are solely those of the authors and do not necessarily represent those of the publisher, the editors and the reviewers. This journal remains neutral with regard to jurisdictional claims in published institutional affiliation.
USE OF ARTIFICIAL INTELLIGENCE (AI)-ASSISTED TECHNOLOGY
The authors declares that they have not used artificial intelligence (AI)-tools for writing and editing of the manuscript, and no images were manipulated using AI.
REFERENCES
1. Pilmane M, Salma-Ancane K, Loca D, Locs J, Berzina-Cimdina L. Strontium and strontium ranelate: historical review of some of their functions. Mater Sci Eng C. 2017 Sep 1;78:1222–30. CrossRef
2. Reginster JY, Brandi ML, Cannata-Andía J, Cooper C, Cortet B, Feron JM, et al. The position of strontium ranelate in today’s management of osteoporosis. Osteop Int. 2015 Jun 17;26(6):1667–71. CrossRef
3. López-Ruiz R, Romero-González R, Garrido Frenich A. Ultrahigh-pressure liquid chromatography-mass spectrometry: an overview of the last decade. TrAC Trends Anal Chem. 2019 Sep 1;118:170–81. CrossRef
4. Greer B, Chevallier O, Quinn B, Botana LM, Elliott CT. Redefining dilute and shoot: the evolution of the technique and its application in the analysis of foods and biological matrices by liquid chromatography mass spectrometry. TrAC¾Trends Anal Chem. 2021 Aug 1;141:116284. CrossRef
5. Menger F, Gago-Ferrero P, Wiberg K, Ahrens L. Wide-scope screening of polar contaminants of concern in water: A critical review of liquid chromatography-high resolution mass spectrometry-based strategies. Trends Environ Anal Chem. 2020 Dec 1;28:e00102. CrossRef
6. Ashwini, S., Sachin, A. and Harinath, N. Forced degradation study of strontium ranelate (antiosteoporetic drug). Int J Pharm Sci Rev Res. 2012;12:22–6.
7. Swami A, Pishawikar S, More H. UV-spectrophotometric method development and validation for estimation of strontium ranelate in bulk. Int J Pharm Bio Sci. 2012;3:171–6.
8. Mythili K, Gayatri S, Teja K, Chitra K, Reddy C. Development and validation of RP-HPLC method for the estimation of strontium ranelate in sachet. Int J Pharm Bio Sci. 2011;2:258–63.
9. Kovács B, Molnár R, Nagy EE, Kelemen ER, Blanka SS, Székely-Szentmiklósi I, et al. Development and validation of an UV-spectrophotometric method for the assay of strontium ranelate and HPLC stability testing from bulk and pharmaceutical dosage form. Acta Med Marisien. 2019;65:55–9. CrossRef
10. Gajbhar AV, Choudhari VP, Kuchekar BS. Development, and validation of a HPTLC method for determination of strontium ranelate in the presence of its impurities. Int J Pharm Bio Sci. 2015 Oct;6(4):386–94,
11. de Carvalho, R. C., Netto, A. D. P. and de Carvalho Marques, F. F. Simultaneous determination of strontium ranelate and aspartame in pharmaceutical formulation for the treatment of postmenopausal osteoporosis by capillary zone electrophoresis. Microchem J. 2014;117:214–9. CrossRef
12. Kish M, Smith V, Lethbridge N, Cole L, Bond NJ, Phillips JJ. Online fully automated system for hydrogen/deuterium-exchange mass spectrometry with millisecond time resolution. Anal Chem. 2023 Mar 21;95(11):5000–8. CrossRef
13. Wales TE, Fadgen KE, Gerhardt GC, Engen JR. High-speed and high-resolution UPLC separation at zero degrees Celsius. Anal Chem [Internet]. 2008 Sep 1;80(17):6815–20. CrossRef
14. Luthria DL, Mukhopadhyay S. Influence of sample preparation on assay of phenolic acids from eggplant. J Agric Food Chem [Internet]. 2005 Jan 11;54(1):41–7. CrossRef
15. Tobiszewski M, Mechlinska A, Namie J. Green analytical chemistry—theory and practice. Chem Soc Rev [Internet]. 2010 Jul 22;39(8):2869–78. CrossRef
16. Zhang Z, Yang MJ, Pawliszyn J. Solid-phase microextraction: a solvent-free alternative for sample preparation. Anal Chem [Internet]. 1994 Sep 1;66(17):844A–53A. CrossRef
17. Yang W, Sun X, Wang HY, Woolley AT. Integrated microfluidic device for serum biomarker quantitation using either standard addition or a calibration curve. Anal Chem [Internet]. 2009 Oct 1;81(19):8230–5. CrossRef
18. Ko?cielniak P, Wieczorek M, Kozak J, Herman M. Generalized calibration strategy in analytical chemistry. Anal Lett [Internet]. 2011 Jan;44(1–3):411–30. CrossRef
19. Bakshi M, Singh S. Development of validated stability-indicating assay methods¾critical review. J Pharm Biomed Anal. 2002 Jun 15;28(6):1011–40. CrossRef
20. Sonawane S, Gide P. Optimization of forced degradation using experimental design and development of a stability-indicating liquid chromatographic assay method for rebamipide in bulk and tablet dosage form. Sci Pharm [Internet]. 2011;79(1):85. CrossRef
21. ICH Q1B guideline photostability testing of new drug substances and products comments for its application
22. Bhutani H, Singh S, Vir S, Bhutani KK, Kumar R, Chakraborti AK, et al. LC and LC-MS study of stress decomposition behaviour of isoniazid and establishment of validated stability-indicating assay method. J Pharm Biomed Anal. 2007 Mar 12;43(4):1213–20. CrossRef
23. Bakshi M, Ojha T, Singh S. Validated specific HPLC methods for determination of prazosin, terazosin and doxazosin in the presence of degradation products formed under ICH-recommended stress conditions. J Pharm Biomed Anal. 2004 Jan 27;34(1):19–26. CrossRef
24. Bakshi M, Singh B, Singh A, Singh S. The ICH guidance in practice: stress degradation studies on ornidazole and development of a validated stability-indicating assay. J Pharm Biomed Anal. 2001 Dec 1;26(5–6):891–7. CrossRef
25. Zolnik BS, Burgess DJ. Effect of acidic pH on PLGA microsphere degradation and release. J Control Rel. 2007 Oct 8;122(3):338–44. CrossRef
26. Yu J, Sun L, Ma C, Qiao Y, Yao H. Thermal degradation of PVC: a review. Waste Manage. 2016 Feb 1;48:300–14. CrossRef
27. Covey TR, Lee ED, Bruing AP, Henion JD. Liquid chromatography/ mass spectrometry. Anal Chem. 1986;58(14):1451–61A. CrossRef
28. Kumar BP, Pasha TY. Green assessment of analytical procedure for the determination of anti-retro viral drugs by HPLC. Int J Pharm Investig. 2024;14(4):1147–54. CrossRef
29. Mansour FR, Omer KM, P?otka-Wasylka J. A total scoring system and software for complex modified GAPI (ComplexMoGAPI) application in the assessment of method greenness. Green Anal Chem. 2024;10:100126. CrossRef