
INTRODUCTION
Candida species are commensal fungi capable of causing invasive infections in immune-impaired patients. These infections pose a significant threat to patients’ lives, as shock sepsis and misdiagnosis can occur [1,2]. Globally, it is estimated that invasive candidiasis causes 1.5 million deaths per year. Although the mortality rate is unknown, approximately 60,000 cases of invasive candidiasis occur annually [3,4]. Candida albicans, Candida glabrata, Candida krusei, Candida tropicalis, and Candida parapsilosis are the most common Candida species reported responsible for more than 90% of invasive candidiasis cases [5,6]. Furthermore, several studies have reported that invasive candidiasis can occur as a mixed yeast infection [7,8].
A multicentric study has analyzed the combination of mixed yeast infection in invasive candidiasis, which indicated that the most frequent combinations were C. albicans/C. glabrata, C. albicans/C. parapsilosis, C. glabrata/C. tropicalis, and C. albicans/C. krusei [9]. The challenge of managing mixed yeast infections clinically is considering the sensitivity of each species to antifungal drugs. Additionally, managing C. albicans/C. krusei mixed yeast infections are more difficult compared to other combinations if C. krusei is not detected, as it has high resistance against the azole group and amphotericin B, which are first-line therapy options [9,10]. Thus, one of the keys to mix-yeast successful management is the accurate identification of the Candida species and the selection of the correct antifungal drug.
Candida albicans is a rapidly growing and dominant fungus that suppresses the growth of other fungal species. As a result, in clinical scenarios involving mixed infections, the detection of other Candida species may be challenging, potentially leading to therapeutic errors. Currently, the culture methods remain the standard laboratory tools for the detection of candidiasis. However, these methods have limitations, including low specificity and sensitivity, and require a prolonged time to yield results. Furthermore, culture methods are genus-specific, which complicates the detection of mixed infections. Non-culture diagnostic methods, such as antigen/antibody tests, β-D-glucan assays, and polymerase chain reaction (PCR), are also used. It is important to note that while antigen and antibody detection methods, as well as β-D-glucan assays, can indicate the presence of invasive fungal infections, they do not specifically confirm invasive candidiasis [11,12].
The real-time polymerase chain reaction (qPCR) can offer alternative and specific tools for candidiasis detection, especially in mixed yeast infection samples. qPCR can be performed using either TaqMan probe methods or intercalating dye methods. TaqMan probe methods are more expensive compared to intercalating dye methods, which are widely available, practical, and more cost-effective [13,14]. Pathogenic fungi can be identified using the internal transcribed spacer (ITS) which are ITS-1 and ITS-2 regions as molecular targets [15]. However, PCR detection of Candida with primer pairs often lacks specificity and tends to amplify environmental contaminants such as Aspergillus, which can lead to false-positive results in PCR tests [16]. Therefore, the development of species-specific primers for Candida, especially in mixed infection conditions, is necessary. To address this issue, we report the detection of C. albicans/C. krusei mix-yeast by singleplex SYBR-green-based qPCR using designed primers targeting ITS1/ITS2.
MATERIALS AND METHODS
Microorganisms and biological material
The Candida species used in the current study were as follows: C. albicans (UICC Y-29), which was obtained from the biology department of Universitas Indonesia; C. krusei (ATCC 6258), C. glabrata (ATCC 66032), and Candida kefyr (FNCC 3035), which were obtained from the Food and Culture Collection of Universitas Gadjah Mada, Indonesia; Candida dubliniensis (InaCC Y521) and Candida rugosa (InaCC Y45), which were obtained from the Indonesia culture collection of the national research and Innovation agency of Indonesia; Candida tropicalis, Candida parapsilosis, Candida haemulonii, Candida auris, and Candida guilliermondii were clinical isolates kindly obtained from the parasitology department of the faculty of medicine, Universitas Indonesia; Aspergillus niger is a laboratory strain obtained from the microbiology department of the faculty of pharmacy, Universitas Indonesia; and Malassezia globosa (ATCC 96807). All the microorganisms used in the current study were confirmed by Vitex analysis and further amplified by qPCR using the reference pan-primer designed by Zhang et al. [16]. For the spiking method, whole-blood materials obtained from the Indonesian Red Cross were also used.
Ethical approval
The protocol and use of whole-blood materials have been approved by the Research Ethics Committee of the Faculty of Medicine, University of Indonesia, with approval number KET-1670/UN2.F1/ETIK/PPM.00.02/2023.
Microscopic observation of Candida sp
Microscopic identification of Candida sp. was performed by isolating a single colony from the medium and then transferring it onto a glass slide that had been pre-treated with distilled water and lactophenol blue. The preparation was covered with a coverslip and observed under a microscope at magnifications of 1,000 x using Olympus CX23.
Primers
The primer pairs were designed by pairwise alignment of the ITS sequences of C. krusei (OL351344.1) and C. albicans (AJ249486.1) derived from GenBank (https://www.ncbi.nlm.nih.gov/genbank/) using Clustal Omega (https://www.ebi.ac.uk/Tools/msa/clustalo/). The obtained primers (Table 1) were further checked for specificity using the Basic Local Alignment Search Tool (https://www.ncbi.nlm.nih.gov/tools/primer-blast/) and for their characteristics using the Sequence Manipulation Suite (http://www.bioinformatics.org/sms2/pcr_primer_stats.html).
Specificity
The DNA of all Candida sp, A. niger, and M. globosa were extracted using PrestoTM DNA extraction kit (Geneaid, Taiwan) as the protocol was following the kit, respectively. Prior to the research, as a positive control, all DNA templates were also amplified using a reference primer named pan-Candida which referred to Zhang et al. [16] respectively with the forward primer is CAACGGATCTCTTGGTTCTC and reverse primer is CGGGTAGTCCTACCTGATTT, respectively. The negative controls were also included in all experiments to ensure that any observed amplification was due to the specific target and not due to contamination or non-specific reactions. These negative controls consisted of reactions with all PCR components except the target DNA during the research.
In brief, each reaction consisted of a total volume of 20 μl containing 10 μl of ThunderbirdTMSYBRTMqPCR mix, 1 μl of each forward and reverse primers, 3 μl of nuclease-free water, and 5 μl of template DNA. The amplification was performed using Real-Time Quantitative Thermal Cycler (Molarray MA-6,000, China), detected by intercalating dye THUNDERBIRDTMSYBRTMqPCR Mix (Toyobo, Jepang). The PCR thermal cycle was set as follows: 95°C, 30 seconds for 1 cycle; 95°C, 15 seconds followed by 55°C, 30 seconds and 72°C, 30 seconds for 40 cycles; with final dissociation at 94°C, 30 seconds follow by 60°C for 90 second and 94°C, 10 seconds for 1 cycle. Melting curve analysis was performed by increasing the temperature (Tm) gradually to 1°C from 60°C to 95°C. Three independent experiments, each single were performed. To confirm the PCR result, The obtained Amplicons were also gel electrophoresis in 2% agarose gel containing 0.01% v/v gel red (Biotium, USA) at 100 V for 40 minutes. The expected amplicon size amplified by designed primers for C. albicans is 276 bp and for C. krusei is 296 bp.
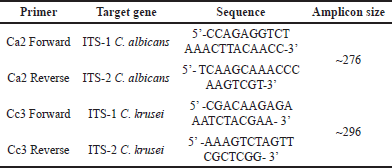 | Table 1. Sequences of oligonucleotides used in this study. [Click here to view] |
Each design-primer pair were further evaluated for its specificity into each DNA of tested candida sp., A. niger, and M. globosa DNA and a mix of it. The negative controls consisting of reactions with all PCR components except the target DNA during the research, were also added. The reaction consisted of a total volume of 20 μl containing 10 μl of ThunderbirdTMSYBRTMqPCR mix, 1 μl of each forward and reverse primers, 3 μl of nuclease-free water, and 5 μl of template DNA. The amplification were also performed using Real-Time Quantitative Thermal Cycler PCR (Molarray MA-6,000, Cina) and detected by intercalating dye THUNDERBIRDTMSYBRTMqPCR Mix (Toyobo, Japan). The PCR thermal cycle was set as follows: One cycle of 95°C for 30 seconds; 40 cycles of 95°C for 15 seconds followed by 60°C (Ca2 primer) or 58°C (Cc3 primer) for 30 seconds and 72°C for 30 seconds. Melting curve analysis and electrophoresis gel were also performed as explained above. Three independent experiments, each single were performed.
Assay sensitivity
The assay’s analytical sensitivity was assessed using seven consecutive tenfold dilutions of C. albicans or C. krusei with known titers of 1,4 × 10⁷ Cfu/ml and 9,8 × 10⁶ Cfu/ml, as determined through culture methods. Three independent experiments each in a single of the diluted samples were conducted using the protocol as follows: each reaction consisted of a total volume of 20 μl containing 10 μl of ThunderbirdTMSYBRTMqPCR mix, 1 μl of each forward and reverse primers, 3 μl of nuclease-free water, and 5 μl of template DNA. The negative controls consisted of reactions with all PCR components except the target DNA during the research, were also added, respectively. The PCR thermal cycle was set as follows: One cycle of 95°C for 30 seconds; 40 cycles of 95°C for 15 seconds follow by 60°C (Ca2 primer) or 58°C (Cc3 primer) for 30 seconds and 72°C for 30 seconds.
Furthermore, the design-primer pair sensitivity in biological samples were evaluated by spiking 103, 102, 101, and 5 Cfu of C. albicans or C. krusei into 1 ml of whole blood. The DNA contained on the spiking-blood was further extracted by PrestoTM DNA extraction kit (Geneaid, Taiwan) as the protocol following the kit, respectively. The qPCR and thermal cycle were set up as explained in the specificity evaluation test above. Three independent experiments, each in single were performed.
Statistical analysis
The mean and standard deviation of Tm value were calculated from three independent experiments using Microsoft Excel, respectively.
RESULTS
Despite the Candida species used in the current experiment being derived from reputable and certified institutions, microscopic confirmation is necessary. Prior to the research, these Candida species were evaluated and compared with existing literature. The observations, as illustrated in Figure 1, align well with those reported by Walsh et al. [17]. It is important to note that hyphae or pseudohyphae were not observed in some Candida species due to the relatively short incubation time of approximately 48 hours.
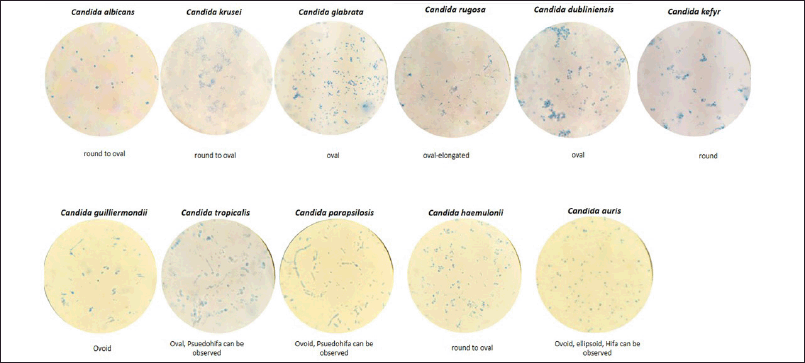 | Figure 1. The microscopic observation of Candida sp. used for primer evaluation. The picture were taken by 1,000 × magnification. [Click here to view] |
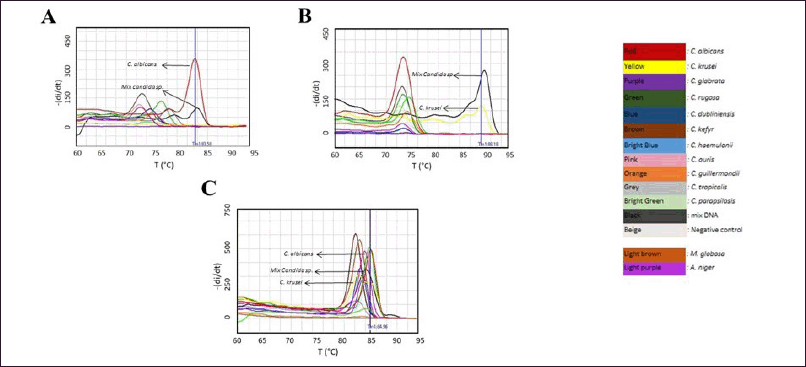 | Figure 2. The specificity of each primer pair towards targeting specific Candida species. A) The melting curve of the amplicon produced by primer Ca2, showing a similar Tm value of approximately 83.58°C for the mixture of Candida species (black) and C. albicans (red); B) The melting curve of the amplicon produced by primer Cc3, indicating a Tm value of approximately 88.18°C for the mixture of Candida species (black) and C. krusei (yellow); C) The melting curve of the amplicon amplified by pan-primer pairs as a control, displaying Tm values ranging from 82 to 84°C. The detection of M. globosa and A. niger using primer pairs Ca2 and Cc3 was conducted separately, with the amplification curves provided in supplementary data 1, respectively. [Click here to view] |
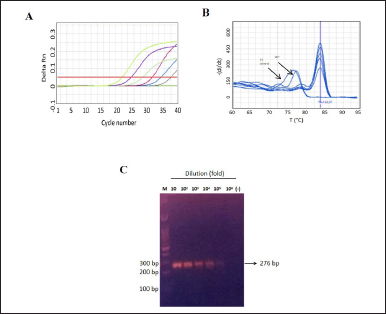 | Figure 3. The analytical sensitivity of the primer Ca2 in detecting C. albicans. A) The amplification curve for C. albicans, with cycle number plotted against fluorescence intensity, using serially tenfold diluted samples, of known titer of C. albicans (1,32 × 10⁷ Cfu/ml), ranging from 10 to 106 fold dilution. Three independent experiments each in single were conducted, following the optimal SYBR green-qPCR protocol; B) The melt curve of the amplified product from the serially diluted C. albicans sample . The melting curve analysis revealed a distinct peak at a Tm of approximately 83.6°C, except for the 106 fold dilution and negative control; C) The results of 2% agarose gel electrophoresis, demonstrating the presence of a band only in samples diluted from 101 to 105, respectively. Negative control were shown as green line in Figure 3A, respectively. [Click here to view] |
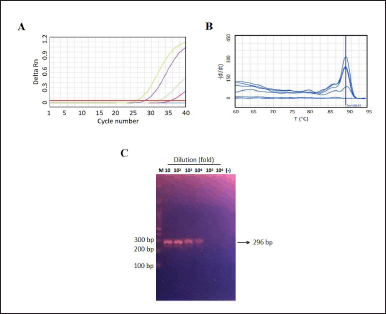 | Figure 4. The assay analytical sensitivity of primer Cc3 in detecting C. krusei. A) The amplification curve shows the cycle number versus fluorescence of serially tenfold diluted of known C. krusei titer (9,8 × 10⁶ Cfu/ml), ranging from 10 to 106 fold dilution. Three independent experiments each in single were conducted using the optimal SYBR green-qPCR protocol. B) The melting curve of the amplified product displays a unique peak at a melting Tm of approximately 88.6°C only for dilutions of 101–104 of C. krusei; C) 2% agorose gel electrophoresis of the amplicon reveals the presence of a band only at dilutions of 101–104, respectively. Negative control were shown as blue line in Figure 4A, respectively. [Click here to view] |
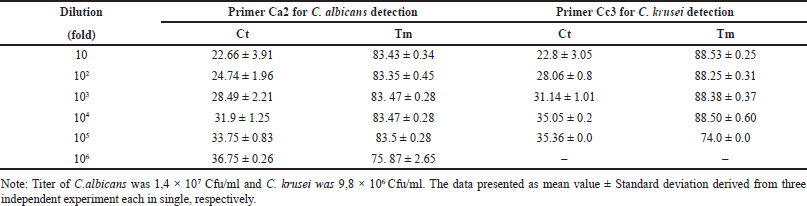 | Table 2. The assay sensitivity of each primer in amplifying each target. [Click here to view] |
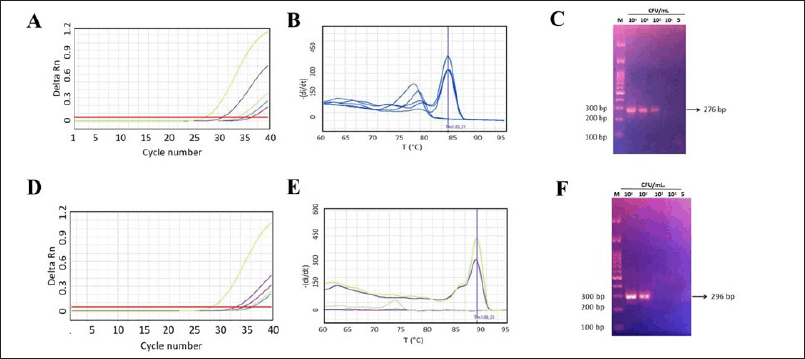 | Figure 5. The Assay sensitivity of primer Ca2 for C.albicans and Cc3 for C. krusei detection in biological matrix. A) The amplification curve for C. albicans and; D) C. krusei (cycle number versus fluorescence). Three independent experiments were performed each in single, using SYBR green-qPCR protocol; B) The Melting curve of amplified product by primer Ca2 showed unique peak at Tm of ~83,31°C at 104, 103 and 102 Cfu in 1 ml blood ; E) at Tm of ~88,6°C for amplicon produced by primer Cc3 at 104 and 103 Cfu in 1 ml blood; C) The 2% agarose gel electroforesis as visual representative of amplicon ampilified by Ca2 primer and; F) by Cc3 primer, respectively. [Click here to view] |
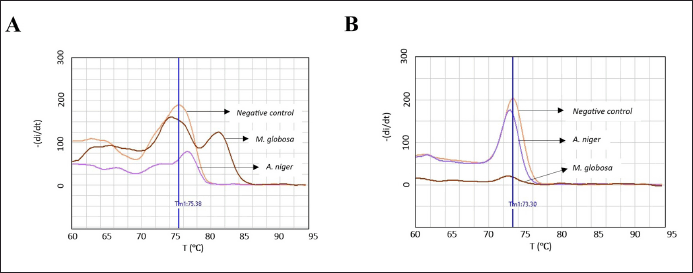 | Supplementary 1. The Specificity evaluation of each primer pairs into M. globosa and A. niger. The melting curve of amplicon, which amplified by primer Ca2 (A) and primer Cc3 (B), indicated that both of primers couldn’t detect M. globosa and A. niger, respectively. [Click here to view] |
The in vitro specificity evaluation of each primer was performed into 10 candida species that commonly infect humans including C. albicans and C. crusei. As the positive control the pan primer (5.8S-1F/28S-1R), developed by Zhang et al. [16], was used. The result showed that Ca2 primer pairs and Cc3 primer pairs produced amplicon with the unique Tm value (~ 83°C for C. albicans amplicon and ~88°C for C. krusei) as can be seen in Figure 2 and Supplementary data 1, meanwhile pan primer able to detect all tested fungi, except C. guiliermondii and C. tropicalis, respectively.
Further, in order to obtain assay sensitivity, the amplification were performed into serial dilution of C. albicans (1,4 × 10⁷ Cfu/ml) or C. krusei (9,8 × 10⁶ Cfu/ml). It was observed that C. albicans shown positive results on all tested dilutions (Fig. 3A). However, the melting curve analysis indicated the unspesific amplicon at a dilution of 106 fold dilution (14 Cfu/ml) as the Tm value peak at ~76, respectively (Fig. 3B). Visualization of amplicon can be seen at Figure 3C. In addition, the occurrence of amplification curve and specific Tm value of C. krusei was only observed until 104 times dilution (980 Cfu/ml) (Fig. 4A and B) as amplicon visualization can be seen on Figure 4C. The summary of Ct and Tm value of each primer in amplifying its target can be seen at Table 2, accordingly.
The primer sensitivity in detecting C. albicans and C. krusei in biological samples was also evaluated by spiking each Candida sp. into the whole blood. The result indicated that Ca2 primer and Cc3 could detected up to 100 Cfu/ml of C. albicans and 1,000 Cfu/ml C. krusei in 1 ml of whole blood. The result is represented in Figure 5A, B, and C, respectively.
DISCUSSION
Currently, the culture and hystophatology methods still remain the gold standard for invasive candidiasis detection. However, the low species specificity and time labor are becoming problems for the management of invasive mix-yeast infections. The insensitivity of culture methods in detecting C. krusei in mixed infections with C. albicans is a common cause of treatment errors, as C. krusei is known to exhibit high resistance to Azole antifungal drugs, which are the first-line therapy for C. albicans [9]. qPCR is proposed as an alternative method for detecting yeast infections due to its improved specificity and shorter detection time. The use of a probe or intercalating dye can be employed as a detection system in the qPCR method. The probe-based approach demonstrates higher specificity, albeit being relatively more expensive compared to intercalating dye, which presents a challenge for worldwide laboratory accessibility.
Alternatively, the utilization of intercalating dye in conjunction with PCR optimization and well-designed primers has been shown to enhance specificity in detecting C. albicans and C. krusei [18,19]. The qPCR method based on intercalating dye is a specific method that can be employed for the detection of Candida species infections. While probe-based pan Candida detection methods have been developed [3], their use is limited due to their relatively higher cost. Zhang et al. [16] have evaluated an intercalating dye-based pan Candida assay capable of detecting 8 Candida species, including C. krusei, but evaluation of these primers against mixed DNA has not been conducted. The use of a primer pair that can detect multiple species can increase the likelihood of false positives or negatives due to different working conditions such as equipment, procedures, and specimens used [20,21]. Therefore, as an alternative, specific primers for each Candida species can be used for confirmation after detection by universal primer. In addition, early diagnosis is crucial for effective anti-Candida therapy, underscoring the need for specific and sensitive diagnostic methods. While qPCR is a robust standard for analyzing and quantifying pathogenic Candida in clinical samples, it typically relies on expensive probes, which can be a challenge in low- and middle-income countries with limited reagent supplies. In contrast, developing primers for the detection of C. albicans and C. krusei using intercalating dyes presents a more affordable alternative. This approach could provide a cost-effective diagnostic tool that is accessible and useful in countries with varying levels of resource availability. Thus, in this research, novel alternative primers specific for detecting C. albicans and C. krusei by intercalating have been developed and evaluated against Candida and other fungal species.
The ITS regions are part of the ribosomal RNA gene complex, comprising non-coding regions with approximately 55 genomic copies per haploid genome [22]. Previous research has shown that primers targeting rDNA coding sequences (18S, 28S, or 5.8S) flanking ITS-1 and ITS-2 can amplify rDNA from all Candida species [16]. Additionally, the ITS regions are optimal for developing species-specific fungal PCR primers for the following reasons: the high copy number of ribosomal genes in all organisms, and their highly conserved nature combined with variable regions [15]. Thus, these regions are suitable as diagnostic species-specific targets for candidemia using PCR.
The initial phase of the research involved designing primers specific for C. albicans and C. krusei using in silico methods with Clustal Omega. The objective of primer design was to ensure specific amplification during PCR. Primers were designed targeting the ITS regions, specifically ITS-1 and ITS-2, with genomic sequences for C. albicans (AJ249486.1) and C. krusei (OL351344.1) obtained from NCBI GenBank (https://www.ncbi.nlm.nih.gov/genbank/). Following primer design, primer specificity was further validated in silico, using the BLAST program (https://blast.ncbi.nlm.nih.gov/Blast.cgi). Primer characteristics such as GC content, melting Tm, and suitability for PCR were then assessed using The Sequence Manipulation Suite (SMS) (https://www.bioinformatics.org/sms2/pcr_primer_stats.html).
In silico validation of the candidate primers using NCBI BLAST (https://blast.ncbi.nlm.nih.gov/Blast.cgi) indicated that both primer pairs, Ca2 and Cc3, were appropriate and specific for their respective targets (Supplementary 1ab and 2ab, respectively). However, characterization of the primers using SMS revealed a warning regarding primer suitability for PCR, as the melting Tm of primers Ca2 and Cc3 exceeded 58°C (Supplementary 1c and 2c, respectively). However, primers with Tm values in the range of 52°C–60°C are generally acceptable for use, and primers with Tm values below 65°C are unlikely to form secondary annealing products [23,24]. The GC clamp warning associated with the reverse primer Cc3 (supplementary 2c) refers to the presence of G or C bases in the last five bases at the 3’ end of the primer. GC clamps can enhance specific binding at the 3’ end due to the stronger and more stable GC base pairs compared to AT pairs, provided that there are no more than three G or C bases [25]. Thus, the Cc3 primer is deemed suitable for subsequent in vitro evaluation.
As control PCR using the pan-Candida primer was performed on C. albicans, C. krusei, C. glabrata, C. rugosa, C. dubliniensis, C. kefyr, C. haemulonii, C. auris, C. guilliermondii, C. tropicalis, C. parapsilosis, M. globosa, and A. niger, for which DNA extraction has been previously performed. The Tm obtained from this study was different from the previous studies [16] where in this study the Tm ranged between 82°C and 85°C (Fig. 2C). This may be due to differences in the PCR conditions performed. Further, the evaluation using mixed Candida DNA samples showed that the amplicon produced by pan-Candida primer exhibited Tm value which similar to C. albicans, C. Parapsilosis, C. Haemulonii, and C. rugosa (Fig. 2C, respectively).
The preliminary evaluation of the primers developed was focused on their specificity for the Ca2 and Cc3 primers, intended to ensure that these primers are specific to particular fungal species. According to the results obtained, amplification of C. albicans DNA with the Ca2 primer yielded a Tm of 83.58°C. In contrast, amplification of DNA from species other than C. albicans resulted in Tm values ranging from 72°C to 78°C, indicating non-specific binding likely due to primer dimers [26]. Testing of a mixed DNA sample with the Ca2 primer also produced a Tm value of 84.01°C, similar to that observed for C. albicans (Fig. 2A). Amplification of C. krusei DNA with the Cc3 primer showed a Tm of 88.24°C. Conversely, amplification of DNA from species other than C. krusei with the Cc3 primer resulted in a Tm value between 72°C and 74°C, indicating the presence of primer dimers, whereas amplification of a mixed DNA sample containing C. krusei produced Tm of 88.88°C (Fig. 2C). These results demonstrate that the Ca2 primer and Cc3 is specific for detecting their target, albeit in the pure or in a mix-tested Candida DNA sample. This confirms that the primers designed are specific to the tested Candida species.
PCR testing on blood fractions can shorten the time required for diagnosing invasive candidiasis and initiating antifungal therapy [22]. Therefore, sensitivity evaluations were also conducted on blood spiked with C. albicans and C. krusei. The sensitivity testing results for the Ca2 primer and the Cc3 primer in detecting target species in pure conditions and blood samples spiked with target Candida showed consistent results. The detection limit for the Ca2 primer pair was between 10 and 100 Cfu/ml, while the detection limit for the Cc3 primer pair was between 100 and 1,000 Cfu/ml (Table 2 and Fig. 5, respectively). This indicates that both the Ca2 and Cc3 primer pairs are capable of detecting target DNA from both culture and blood samples.
While the sensitivity of the Ca2 primer pair is generally robust, it is important to note that this detection limit may not fully capture very low concentrations of target DNA in more complex biological matrices or when inhibitors are present. The higher detection limit of the Cc3 primer pair suggests that it may be less sensitive than the Ca2 primer pair, particularly in the lower range of target concentrations. This limitation could be attributed to factors such as primer affinity or the presence of competing non-target DNA. As with the Ca2 primer pair, the sensitivity observed in more complex samples may be influenced by additional factors such as sample matrix effects or the presence of PCR inhibitors. The presence of blood components or other sample matrix effects can impact the assay’s sensitivity. While our study demonstrates the capability of both primer pairs to detect target DNA, real-world samples may introduce variability that affects performance. Thus, to enhance sensitivity and address these limitations, further optimization of PCR conditions, primer design, or sample preparation protocols may be required. Future work could focus on refining these parameters to improve detection limits and reliability in more diverse sample types, especially in clinical samples.
CONCLUSION
In conclusion, primer pairs specific to C. albicans and C. krusei have been developed and can be utilized for confirming positive results in samples containing mixed Candida species. A limitation of this study is the restricted evaluation of the number of Candida species tested, the lack of clinical samples, and multiplex evaluation, thus further evaluation is needed.
ACKNOWLEDGMENTS
The researchers would like to acknowledge the Helix Laboratory in Depok and the Laboratory of Parasitology at the Faculty of Medicine, Universitas Indonesia, for providing the qPCR machine and the specimen collection for this study.
AUTHOR CONTRIBUTIONS
All authors made substantial contributions to conception and design, acquisition of data, or analysis and interpretation of data; took part in drafting the article or revising it critically for important intellectual content; agreed to submit to the current journal; gave final approval of the version to be published; and agree to be accountable for all aspects of the work. All the authors are eligible to be an author as per the International Committee of Medical Journal Editors (ICMJE) requirements/guidelines.
FINANCIAL SUPPORT
This study was funded by the 2022 PUTI Q2 Universitas Indonesia with the research grant number of NKB681/UN2.RST/HKP.05.00/2023.
CONFLICTS OF INTEREST
All authors report no financial or any other conflicts of interest in this work.
ETHICAL APPROVALS
Ethical Statement given in ‘Material and Method section’.
DATA AVAILABILITY
All data generated and analyzed are included in this research article.
PUBLISHER’S NOTE
All claims expressed in this article are solely those of the authors and do not necessarily represent those of the publisher, the editors and the reviewers. This journal remains neutral with regard to jurisdictional claims in published institutional affiliation.
USE OF ARTIFICIAL INTELLIGENCE (AI)-ASSISTED TECHNOLOGY
The authors declares that they have not used artificial intelligence (AI)-tools for writing and editing of the manuscript, and no images were manipulated using AI.
REFERENCES
1. Singh R, Chakrabarti A. Invasive candidiasis in the Southeast-Asian Region. In: Prasad R, editor. Candida albicans: cellular and molecular biology. Cham, Switzerland: Springer; 2017. Pp. 25–40. Crossref
2. García-Salazar E, Acosta-Altamirano G, Betancourt-Cisneros P, Reyes-Montes M del, Rosas-De-Paz E, Duarte-Escalante E, et al. Detection and molecular identification of eight candida species in clinical samples by simplex PCR. Microorganisms. 2022;10(2):374. Crossref
3. Jainlabdin MH, Batra A, Sánchez Paredes E, Hernández Hernández F, Fu G, Tovar-Torres J. Single-tube, dual channel pentaplexing for the identification of Candida strains associated with human infection. Sci Rep. 2019;9(1):14692. Crossref
4. Wahyuningsih R, Adawiyah R, Sjam R, Prihartono J, Ayu Tri Wulandari E, Rozaliyani A, et al. Serious fungal disease incidence and prevalence in Indonesia. Mycoses. 2021;64(10):1203–12. Crossref
5. Calandra T, Roberts JA, Antonelli M, Bassetti M, Vincent JL. Diagnosis and management of invasive candidiasis in the ICU: an updated approach to an old enemy. Critical Care. 2016;20(1):125. Crossref
6. Singh DK, Tóth R, Gácser A. Mechanisms of pathogenic Candida species to evade the host complement attack. Front Cell Infect Microbiol. 2020;10:94. Crossref
7. Cassagne C, Normand AC, Bonzon L, L’Ollivier C, Gautier M, Jeddi F, et al. Routine identi?cation and mixed species detection in 6,192 clinical yeast isolates. Med Mycol. 2016;54(3):256–65. Crossref
8. Yang YL, Chu WL, Lin CC, Zhou ZL, Chen PN, Lo HJ, TSARY Hospitals. Mixed yeast infections in Taiwan. Med Mycol. 2018;56(6):770–3. Crossref
9. Medina N, Soto-Debrán JC, Seidel D, Akyar I, Badali H, Barac A, et al. MixInYeast: a multicenter study on mixed yeast infections. J Fungi (Basel). 2020;7(1):13. Crossref
10. Ezeadila JO, Okoli I, Oyeka CA. Antifungal resistance pattern of Candida species isolated from high vaginal swabs of women attending a hospital in Enugu State, Nigeria. J Adv Microbiol. 2020;20(9):62–72. Crossref
11. Prasad R. Candida albicans: cellular and molecular biology. 2nd ed. Cham, Switzerland: Springer International Publishing AG; 2017. Crossref
12. Lopes JP, Lionakis MS. Pathogenesis and virulence of Candida albicans. Virulence. 2021;13(1):89–121. Crossref
13. Fuchs Wightman F, Godoy Herz MA, Muñoz JC, Stigliano JN, Bragado L, Moreno NN, et al. A DNA intercalating dye-based RT-qPCR alternative to diagnose SARS-CoV-2. RNA Biology. 2021;18(12):2218–25. Crossref
14. Shen CH. Amplification of nucleic acids. Diagnostic molecular biology. Cambridge, MA: Academic Press; 2019. Pp. 215–47. Crossref
15. Trabelsi H, Neji S, Hadrich I, Khemakhem N, Sellami H, Makni F, et al. Contribution of the internal transcribed spacer regions to the detection and identification of human fungal pathogens. Curr Res Translat Med. 2019;67(3):100–6. Crossref
16. Zhang J, Hung G, Nagamine K, Li B, Tsai S, Lo S. Development of Candida-specific real-time PCR assays for the detection and identification of eight medically important Candida species. Microbiol Insights. 2016;9:21–8. Crossref
17. Walsh TJ, Hayden RT, Larone DH. Larone’s Medically Important Fungi. Washington, DC: ASM Press; 2018. Crossref
18. Asadzadeh M, Ahmad S, Al-Sweih N, Khan Z. Rapid and accurate identification of Candida albicans and Candida dubliniensis by real-time PCR and melting curve analysis. Med Princ Pract. 2019;27(6):543–8. Crossref
19. Pereira-Gómez M, Fajardo A, Echeverría N, López-Tort F, Perbolianachis P, Costábile A, et al. Evaluation of SYBR Green real time PCR for detecting SARS-CoV-2 from clinical samples. J Virol Methods. 2021;289:114035. Crossref
20. Kleyer H, Tecon R, Or D. Resolving species level changes in a representative soil bacterial community using microfluidic quantitative PCR. Front Microbiol. 2017;8:2017. Crossref
21. Dreier M, Berthoud H, Shani N, Wechsler D, Junier P. SpeciesPrimer: a bioinformatics pipeline dedicated to the design of qPCR primers for the quantification of bacterial species. Peer J. 2020;8:e8544. Crossref
22. Busser FD, Coelho VC, Fonseca CDA, Maria G, Del B, Shikanai-yasuda MA, et al. A real time PCR strategy for the detection and quantification of Candida albicans in human blood. Revista do Instituto Medicina Tropical Sao Paulo. 2020;62:e9. Crossref
23. Abd-Elsalam KA. Minireview-bioinformatic tools and guideline for PCR primer design. Afr J Biotechnol. 2003;2(5):91–5. Crossref
24. Bustin SA, Mueller R, Nolan T. Parameters for successful PCR primer design. Methods Mol Biol. 2020;2065:5–22. doi: 10.1007/978-1-4939-9833-3_2
25. Mubarak SM, Al-Koofee DAF, Radhi OA, Ismael JM, Al-Zubaidi ZF. An optimization and common trouble-shooting sloving in polymerase chain reaction technique. Syst Rev Pharm. 2020;11(2):427–36. Crossref
26. Abdel Sater F, Younes M, Nassar H, Nguewa P, Hamze K. A rapid and low-cost protocol for the detection of B.1.1.7 lineage of SARS-CoV-2 by using SYBR Green-based RT-qPCR. Mol Biol Rep. 2021;48(11):7243–9. Crossref