INTRODUCTION
In the emerging field of pharmaceuticals, it is crucial to find the balance between pushing technological boundaries, streamlining production processes, and meeting consumer demands. Quality plays a role in bridging the priorities of manufacturers and consumers. Manufacturers aim to create products that meet standards, while consumers seek top-notch offerings at reasonable prices. This requires an approach across disciplines to tailor cutting-edge technologies for efficient formulations without excessively increasing production costs. It is essential to optimize resource utilization, ensure scalability of innovation, and continuously evaluate quality to strike a balance between advancing knowledge, meeting industry requirements, and delivering cost-effective pharmaceutical products of high quality. Unlike industries, the pharmaceutical sector emphasizes consumers who are ultimately patients and invests significantly in medical research and development. With increased competition in this market, there is a growing focus on implementing control and assurance systems. This is essential for supplying high-grade pharmaceutical items while also ensuring patient health. However, the pharmaceutical industry is plagued by a number of challenges, including poor treatment outcomes, high healthcare expenditures, treatment failures that result in fatalities, a lack of trust in health care, significant economic losses, and even national security concerns [1]. Modern quality systems heavily emphasize improvement. Understanding and enhancing product and service excellence is therefore crucial for strengthening competitiveness and supporting business or industry growth. To enhance the product standard, an improvement program must be implemented within an organization and manufacturing area. When addressing market issues and complying with consumer and regulatory requirements, pharmaceutical businesses pursue techniques to decrease internal costs, minimize defective products, and speed product cycle times to market while conforming to both regulatory standards and customer expectations [2].
In process improvement approaches, the process capability index is used to provide a statistical gauge of a manufacturing process’s ability to generate products/outputs within set parameters. This metric contrasts the “Voice of the Customer” with the “Voice of the Process [3,4].” The voice of the customer comes from the needs of the customer. The process reflects requirements. In contrast, the use of tone is established by defining the boundaries of use derived from how the practice is performed [5]. The DMAIC approach is one of the important parts of the Six Sigma methodology, which consists of five steps: define, measure, analyze, improve, and control. This statistical approach is used to understand the manufacturing process and improve the process efficiency. The DMAIC framework is used efficiently to find the problems in the manufacturing process and ratification of the identified process [6].
DMAIC approach
Define phase
The define phase is the first step of the DMAIC approach, in which crucial quality (CTQ) concerns and the essential features of the business operation are explicitly specified. In this approach, what are the key areas that are influencing the processes are identified [7].
Measure phase
The DMAIC’s second phase focuses on gathering data from many different sources to solve the problems and performance metrics. This phase includes gathering information, defining categories, identifying opportunities, finding out the root cause, and executing the implementation plan. The data can also be retrieved from literature surveys or previous manufacturing experience [8].
Analyze phase
This phase entails locating sources of variation, identifying underlying causes, and ranking these fundamental causes in order of importance [9].
Improve
Addressing and managing the causes to achieve the required breakthrough performance entails developing alternative ideas, constructing those solutions, and validating their efficacy.
Control
The final stage of DMAIC involves validating the enhancements implemented during the “Improve” phase and guaranteeing the prevention of recurring issues [10].
Framework of process capability
In 1956, Western Electric Company introduced the concept of process capability in the Statistical Quality Control Handbook. Process capability is the inherent or intrinsic behavior of a stable process in statistical control. Process capability index calculation standards or recommendations have been developed by a number of bodies, including the International Organization for Standardization, the Automotive Industry Action Group, the American Society for Quality, and the American Society for Testing and Materials [6]. As previously stated, process capability refers to the intrinsic or natural behavior of a statistically controlled, stable process. It is a statistical measurement of a process’s capability to generate components consistently within established boundaries or limitations. Several bodies have issued instructions/guidelines or ideas for computing the process capability index, an important statistical tool for analyzing a process’s ability/capability to meet goals and produce consistent results. Capability indices are designed to graphically depict a process’s capability to achieve specific goals as well as a product’s ability to be made within specific processes. They help determine if a process, given its inherent variability, is capable of meeting stated requirements by assessing its distribution in relation to product specification constraints. These indices evaluate a product’s ability to be built according to specifications [7]. Process capability is a quantifiable feature of a system that determines whether it meets predefined norms. Its two basic responsibilities are to measure performance changes and compare them to previously defined standards or limits [10,11]. The process capability index analysis produces a graphical histogram that forecasts how many components will be manufactured or produced out of specification.
The process capability index (Cpk) is a statistical technique for determining or measuring a system’s capability or ability to generate goods or products that fulfill customer expectations within a set of specified parameters. It assesses the manufacturer’s ability to produce a product within the customer’s limits. A Cpk number greater than one shows that the process meets the requirements or standards [11]. Another tool that evaluates data collection to the customer’s tolerance level is process capability analysis (Cp). A Cp score of 1.33 or above shows that the product is well-fitted to the demands of the buyer/ customers [12,13]. The performance index (Pp) is another statistical tool that looks at the spatial distribution of information. If the process is maintained within the set standards, the data transfer will be successful. The Process Performance Index (Ppk) is a statistical tool that assesses how well the process matches the process by measuring standards and variables [14].
where x? = Process mean, LSL = Lower specification limit, USL = Upper specification limit, and σ = Process standard deviation [15–18].
Metformin HCl is an anti-diabetic medication that is commonly prescribed drug for type 2 diabetes mellitus in India [19]. There are many drug recalls due to the lack of manufacturing procedures and lack of technology integration with the pharmaceutical field [20]. This medication can be more accessible and effective by expediting the production process and helping a large number of patients. Any improvements in Metformin HCl production must be compatible with the pharmaceutical industry’s commitment to assuring the quality, safety, and efficacy of diabetes medication. The intricacies of formulating and producing Metformin HCl provide issues that may be efficiently handled with Six Sigma methodologies, especially when it comes to optimizing dissolution and bioavailability, and so on. Implementing these techniques has the potential to improve product quality and patient outcomes greatly. Given the drug’s popularity, modest changes in the production process might result in significant cost reductions. We might benefit from Six Sigma methodologies to reduce unpredictability and waste. Metformin HCl research is broad, establishing the framework for informed decision-making all the way through process analysis. With the prevalence of diabetes and a competitive pharmaceutical industry, ensuring a consistent supply of high-quality Metformin HCl is crucial. Using Six Sigma methodologies for manufacturing improvements may provide a competitive advantage by consistently creating high-quality goods.
MATERIALS AND METHODS
Materials
Metformin HCl (Strides Pharma, Pondicherry, India; Cas no.: 1115-70-4), croscarmellose sodium (Sigma Aldrich, Bengaluru, India; Cas no.: 74811-65-7), Magnesium stearate (Sigma Aldrich, Bengaluru, India; Cas no.: 557-04-0), Talc (Sigma Aldrich, Bengaluru, India; Cas no.: 14807-96-6), Lactose (Sigma Aldrich, Bengaluru, India; Cas no.: 63-42-3), and Strach (Sigma Aldrich, Bengaluru, India; Cas no.: 9005-84-9). All other reagents used in the study were of AR grade. Minitab 21.2 (64-bit) software was used in the process capability analysis.
Methods
Formulation of tablet
Tablets were formulated according to the specifications outlined in Table 1. All ingredients were accurately weighed after passing through a 40-mesh size to achieve uniform particle size distribution. Metformin HCl, Croscarmellose sodium, Starch, Lactose, magnesium stearate, and Talc were blended thoroughly using a mortar pestle. A binding solution was prepared by dissolving starch in aqueous solution to form a 10% solution. This solution served as the binding agent in the wet granulation method employed for granule preparation. The obtained granules were dried in a hot air oven at 70°C for ten minutes. Talc and magnesium stearate, acting as lubricants, were incorporated into the formulation. The tablet punching process was conducted using a multiple-punch tablet punching machine (RIMEK, Gujarat, India; Model: MINI PRESS-I).
Hardness test
The tablet’s hardness was determined using a Pfizer Monsanto Hardness Tester, and the measurement unit for hardness is kg/cm−2. The ideal range is from 5 to 8 kg/cm−2.
Thickness test
Digital Vernier Caliper (SKADIOO, Perfect Sales, India) was used to measure the thickness of the tablets. The unit of thickness is micrometer (mm). The ideal thickness range is from ±5 mm.
Disintegration test
The disintegration time of the tablets in distilled water at 37°C was assessed using a Disintegration apparatus USP (Laboholic, Model: LH-731). The disintegration time was noted where there was no tablet residue remaining in the Disintegration apparatus mesh. The ideal disintegration value of the conventional Immediate-release tablet is 15 minutes.
Friability test
For tablets weighing about ~0.65 g, the entire tablet sample was meticulously dedusted and precisely weighed. However, for tablets weighing more than 0.65 g on average, a sample of 10 complete tablets was taken. These tablets were put into a drum, spun 100 times, and then taken out. After eliminating any dust, the tablets were precisely weighed to calculate the percentage of friability using a specific formula. The ideal range of friability ranges from 0.5% to 1.0%.
Dissolution test
The dissolution study of Metformin HCl tablets was conducted using the ELECTROLAB TDT-08L dissolution apparatus, following the guidelines specified by the United States Pharmacopeia (USP). The apparatus utilized a USP II Paddle type configuration, maintaining a constant rotation speed of 100 rpm throughout the dissolution testing process. The dissolution medium employed was a phosphate buffer with a pH of 6.8, and the temperature of the dissolution media was rigorously maintained at 37°C ± 0.5°C to simulate physiological conditions accurately. Sampling intervals of 5, 10, 15, 25, 35, 45, and 55 minutes were chosen to collect 5 ml samples at each time point. For each withdrawal, an equivalent volume of fresh dissolution media was immediately replaced to sustain the sink conditions. The withdrawn samples underwent necessary dilutions to ensure optimal measurements and were subsequently analyzed using a UV Visible Spectrophotometer (LABINIDA UV 3000) set at a wavelength of 231 nm. This rigorous protocol was employed to accurately determine the amount of drug released over time from the Metformin HCl tablets, aligning with regulatory guidelines for dissolution testing of immediate-release formulations.
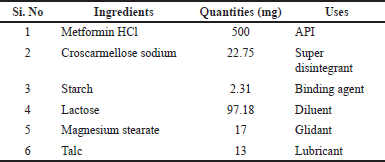 | Table 1. Formulation of Metformin HCl tablets. [Click here to view] |
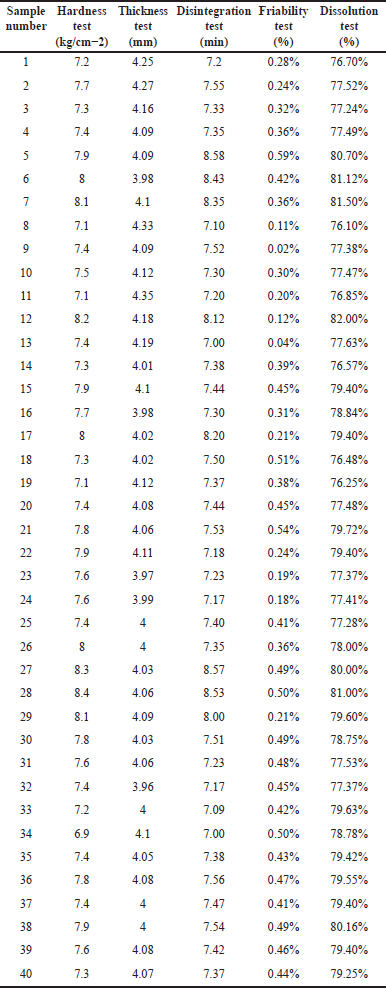 | Table 2. Evaluation tests for Metformin HCl tablets. [Click here to view] |
Statistical analysis
MINITAB 21.2 was employed in statistical analysis. The thickness, hardness, friability, disintegration, and dissolution test values are entered in the rows and columns in the MINITAB Spreadsheet. By choosing the STAT tool in the spreadsheet, a Quality Tool option appears, and by clicking that option, the Capability Sixpack appears. (Nominal). The LSL AND USL values are entered, and thus, the graph appears as a result containing a Capability Histogram, Moving Range chart, and capability chart. Descriptive statistics were applied; thus, the software gives the mean, median, and mode.
RESULTS AND DISCUSSION
The evaluation tests for the formulated tablets were shown in Table 2.
Descriptive statistics
Details of the findings and analysis are described in Table 1. The descriptive statistics of thickness, hardness, friability, disintegration, and dissolution Tests, including the mean, median, and mode, are stated in Tables 3 [21–23].
Thickness
The average thickness of tablets was 4.0818 units, with a standard deviation of 0.0934 units. This means that most of the tablet thicknesses clustered around the mean, with some variability. The range of thickness observed was relatively narrow, spanning from a minimum of 3.9600 units to a maximum of 4.3500 units, indicating consistent tablet thickness within this specific sample. The quartiles (Q1, median, Q3) give insights into the distribution of tablet thickness. The median value (4.0750 units) is very close to the mean, suggesting a symmetrical distribution. Based on this dataset, the pharmaceutical tablets appear to have consistent thicknesses overall, with a relatively small variation between individual tablet measurements.
Hardness
The average hardness of the tablets was found to be 7.6100 units. This value represents the central tendency around which the majority of tablet hardness measurements are clustered. The standard deviation of 0.3657 units indicates moderate variability in tablet hardness within the sample. This suggests that while the average hardness is known, there is notable dispersion or spread in hardness values around this mean. The tablet hardness measurements in this sample show a range varying from a minimum of 6.9000 units to a maximum of 8.4000 units. To describe the distribution, we have the quartile (Q1) at 7.3250 units, the median at 7.6000 units, and the third quartile (Q3) at 7.9000 units. This data provides information on the distribution of tablet hardness. The median value is close to the mean, suggesting a somewhat symmetrical distribution. The average tablet hardness is within an acceptable range. Still, the observed variability, as indicated by the standard deviation and the wide range of hardness values, might raise concerns about consistency in tablet hardness within this sample. The moderate variability in tablet hardness measures may have an impact on tablet quality and consistency, perhaps impacting efficacy or quality if it surpasses accepted pharmaceutical levels. In essence, while the average tablet hardness is within an acceptable range, the high variability in hardness readings indicates a need for further analysis and possibly production process changes. This is critical for ensuring constant tablet hardness, compliance with pharmaceutical quality standards, and product effectiveness and quality.
 | Table 3. Descriptive statistics. [Click here to view] |
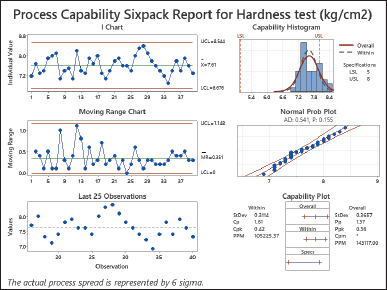 | Figure 1. Process capability sixpack report for hardness test (kg/cm2). [Click here to view] |
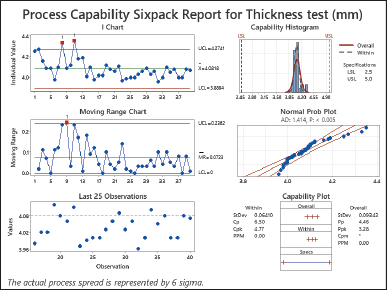 | Figure 2. Process capability sixpack report for thickness test (mm). [Click here to view] |
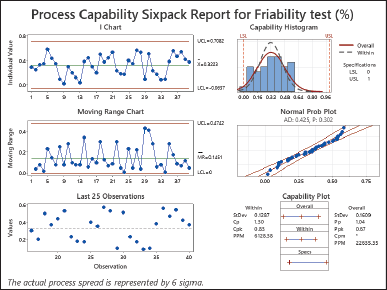 | Figure 3. Process capability sixpack report for friability test (%). [Click here to view] |
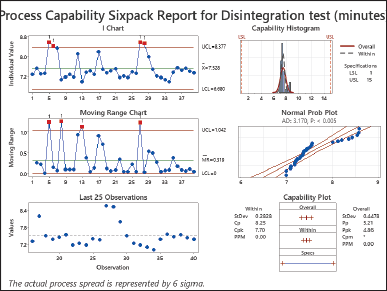 | Figure 4. Process capability sixpack report for disintegration test (minutes). [Click here to view] |
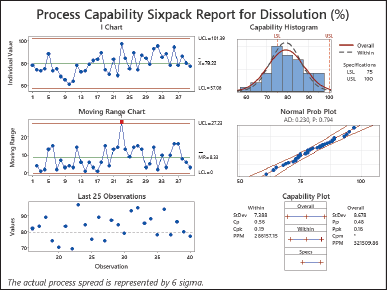 | Figure 5. Process capability sixpack report for dissolution (%). [Click here to view] |
Friability
The average friability of the tablets (Mean = 0.002650) represents the central tendency around which the majority of the friability measurements revolve. The standard deviation (St Dev = 0.001256) indicates that tablet friability varies moderately within this sample. The variation in friability data is further emphasized by the range between the minimum and greatest friability values (from 0.001100 to 0.005000). The quartiles (Q1 = 0.001725, Median = 0.002100, Q3 = 0.004175) show the distribution of friability measurements, with the median closer to the lower quartile, indicating a possible bias toward lower friability levels. Some adjustments to the production procedures may be required to obtain levels of friability that meet the quality standards, ensuring that the tablets retain their integrity and efficacy. The differences in friability measurements spotlight the significance of monitoring and anticipating modifications in production strategies, even if the average friability falls within a particular range. It is important to guarantee that the friability stages fulfill the first-class and efficacy criteria of pharmaceutical drugs.
Disintegration
The majority of Metformin tablets had a disintegration time of around 7.5283. The standard deviation of 0.4478 reveals that the tablet disintegration times in this sample vary. Furthermore, the variability of the data is demonstrated by the range of peak disintegration times (from 7.0000 to 8.5800). The disintegration time distribution is shown by the quartiles (Q1 = 7.2300, Median = 7.3800, Q3 = 7.5475), with the median closer to the lower quartile, indicating a potential bias toward shorter disintegration intervals. The observed variability in disintegration times among tablets, as indicated by the standard deviation and range, suggests that manufacturing process adjustments may be required to ensure consistent disintegration times within specified quality standards for pharmaceutical tablets.
Dissolution
The average dissolve rate (Mean = 0.78579) of the tablets reflects the central tendency around which the majority of the dissolution measurements are clustered. The standard deviation (St Dev = 0.01548) suggests that tablet dissolving rates vary moderately within this sample. The difference in dissolving rates between the minimum and maximum (from 0.76100 to 0.82000) emphasizes the variability in dissolution readings. The quartiles (Q1 = 0.77373, Median = 0.78765, Q3 = 0.79587) show the dissolution rate distribution, with the median closer to the higher quartile, indicating a probable skew toward higher dissolution rates. The results of the dissolution tests show that the average dissolution rate falls within a certain range. However, the standard deviation and range show that there is moderate diversity in the dissolving rates observed among the tablets. To guarantee constant dissolve rates within defined quality requirements for pharmaceutical tablets, production procedures may need to be adjusted.
Certain characteristics, such as thickness, are consistent, whereas others, such as hardness, friability, disintegration time, and dissolving rates, vary significantly. To guarantee consistent quality standards across all dimensions, production processes should be regularly monitored and potentially adjusted. This is necessary to preserve uniformity and meet pharmaceutical quality standards, ensuring the tablets’ long-term efficacy and dependability.
STATISTICAL ANALYSIS
Hardness
Based on the analysis conducted in Figure 1, it seems that the hardness test process may meet the required data spread limits as both Cp and Pp values are greater than 1.0. However, we encountered some difficulties with centering, as indicated by Cpk and Ppk values below 1.0. This suggests that the average value of the process may not align well with the established limits. Although the dispersion of the process falls within limits, concerns arise due to Cpk and Ppk measurements regarding centering. To address this issue and improve hardness testing results it is necessary to make changes or additions that bring the process mean closer to the desired target value, within the tolerance range. These modifications aim to minimize variability and enhance hardness testing outcomes [24,25].
Thickness
The analysis of the Thickness test as depicted in Figure 1 reveals that both Cp and Pp values exceeding 1.0 suggest that the process variation is likely to remain within the tolerance limits. Similarly, Cpk and Ppk values, greater than 1.0 indicate that the process average is well centered within the tolerance range aligning closely with the desired value and posing a risk of producing items outside that range. The significant Cp, Cpk, Pp, and Ppk values imply a regulated thickness test process with capability, control, and alignment while minimizing the chances of manufacturing products, beyond the prescribed tolerance range. The study report is shown in Figure 2 [25–27].
Disintegration
The analysis of disintegration showed a Cp value of 8.25, a Cpk value of 7.70, a Pp value of 5.21, and a Ppk value of 4.86 (as shown in Fig. 3). Process variation can be handled within tolerance limits when the Cp and Pp values are more than 1.0. Moreover, with both the Cpk and Ppk values exceeding 1.0, it indicates that the process mean is centered accurately within the tolerance range. This demonstrates an alignment between the process mean and a target value, thereby reducing the likelihood of producing items outside the tolerance range. The exceptionally high values of Cp, Cpk, Pp, and Ppk suggest that the process has remarkable capability, control, and alignment for the disintegration analysis [25,28,29].
Friability
The friability investigation revealed a Cp of 1.30, Cpk of 0.83, Pp of 1.04, and Ppk of 0.67 (Fig. 4). Both Cp and Pp are more than 1.0, indicating that the process spread has the potential to fit inside the defined tolerance limits, though not much over 1. The Cpk and Ppk values, on the other hand, both less than 1.0, indicate potential process-centering concerns, implying that the process means may not be well-centered within the prescribed limits, increasing the risk of creating items outside the tolerance range. Although Cp and Pp suggest that the process spread can somewhat fit within the tolerance limits, the lower Cpk and Ppk values raise concerns about process centering. This difference in process capability indices suggests that adjustments or improvements are necessary to align the process mean closely with the desired target value within the tolerance range. The objective is to reduce variability and enhance process performance for the friability test [25,28,29]
Dissolution
The results of the study showed a Cp value of 0.56 Cpk value of 0.19 Pp value of 0.48, and a Ppk value of 0.16 (as shown in Fig. 5). It is worth noting that both the Cp and Pp values are more than 1.0, which suggests that there might be some issues with the process fitting within the defined tolerance limits. Similarly, when considering the Cpk and Ppk values being higher than 1.0, it indicates concerns with process centering. This suggests that the process mean may be poorly matched within the stated constraints, increasing the likelihood of creating items that are beyond the tolerance range. Low results for Cp, Cpk, Pp, and Ppk indicate an analytical situation. This illustrates that both spreading and suitably focusing the process are challenging. As a result, there is a potential that the products created during the test will exceed the tolerance range. To solve this issue, improvements or modifications to the manufacturing process may be required in order to increase its capabilities and closely match the process mean with the planned target value within the supplied tolerance range [28,30]
To summarise, while thickness and disintegration tests show capability and good process alignment, hardness, friability, and dissolution research into process centering raise some questions. To retain quality, minimize variability, and satisfy criteria for long-term efficacy and dependability of tablets, it is critical to make appropriate modifications and improvements in the manufacturing process [31–33].
CONCLUSION
In this research work, Metformin HCl tablets were formulated and evaluated. About 40 tablets were evaluated for thickness, hardness, friability, disintegration, and dissolution. The Six Sigma approach, such as Process Capability analysis, was done by using the Minitab Software was employed for the analysis. The analysis indicated that all the tested standards exhibited a functional capability greater than 3.64, confirming the capabilities and variability of each application. This indicated that the methods are robust and efficient on the specified criteria. In summary, the integration of process capability analysis and the Six Sigma approach into the pharmaceutical industry plays an important role in improving efficiency, strong quality control, and regulatory compliance. This approach ensures patient safety and strict adherence to quality regulatory standards. Its reforms hold the potential to transform medicine further as the pharmaceutical industry evolves. This will open the door to increased accuracy, continuous improvement, and sustained excellence in the production of high-quality drugs for international markets. Six Sigma thinking will always be relevant in the future, with more data and faster technological advances. An important component of Six Sigma is process capability analysis, which enables organizations to analyze how well programs are performing, align products with requirements, and make data-driven choices. Six Sigma uses statistical techniques and analysis to promote cost savings, risk avoidance, and adaptation to changing market needs while delivering improved results and benefits.
ACKNOWLEDGMENT
The authors would like to thank the Department of Science and Technology—Fund for Improvement of Science and Technology Infrastructure (DST-FIST) and the promotion of University Research and Scientific Excellence (DST-PURSE) for the facilities provided for our department.
AUTHOR CONTRIBUTIONS
All authors made substantial contributions to the conception and design, acquisition of data, or analysis and interpretation of data; took part in drafting the article or revising it critically for important intellectual content; agreed to submit to the current journal; gave final approval of the version to be published; and agree to be accountable for all aspects of the work. All the authors are eligible to be an author as per the International Committee of Medical Journal Editors (ICMJEs) requirements/guidelines.
CONFLICTS OF INTEREST
The authors report no financial or any other conflicts of interest in this work.
ETHICAL APPROVALS
This study does not involve experiments on animals or human subjects.
DATA AVAILABILITY
All data generated and analyzed are included in this research article.
PUBLISHER’S NOTE
This journal remains neutral with regard to jurisdictional claims in published institutional affiliation.
REFERENCES
1. Greg B. Six sigma for managers. New York, NY: McGraw Hill; 2002.
2. Nunnally BK, McConnell JS. Six sigma in the pharmaceutical industry. Boca Raton, FL: CRC Press; 2007. Available from: http://books.google.ie/books?id=5RsQ5rHaruEC&printsec=frontcover&dq=ISBN+9781420054392&hl=&cd=1&source=gbs_api
3. Condé GCP, Martens ML. Six sigma project generation and selection: literature review and feature based method proposition. Prod Plan Control. 2019 Dec 29;;31(16):1303–12. CrossRef
4. Miglani A, Saini C, Musyuni P, Aggarwal G. A review and analysis of product recall for pharmaceutical drug product. J Generic Med. 2021 Jul 22;18(2):72–81. CrossRef
5. Kane VE. Process capability indices. J Qual Technol. 1986 Jan;18(1):41–52. CrossRef
6. Chakravorty SS. Six Sigma programs: an implementation model. Int J Prod Econ. 2009 May;119(1):1–16. CrossRef
7. Tjahjono B, Ball P, Vitanov VI, Scorzafave C, Nogueira J, Calleja J, et al. Six sigma: a literature review. Int J Lean Six Sigma. 2010;1(3):216–33. CrossRef
8. Mikel JH. Six sigma: a breakthrough strategy for profitability. Qual Prog. 1998; 31:35–42.
9. Juran Institute’s Six sigma breakthrough and beyond: quality performance breakthrough methods. [Internet]. Google Books. Available from: https://books.google.co.in/books/about/Juran_Institute_s_Six_Sigma_Breakthrough.html?id=0VHaTb6LJ4QC&redir_esc=y#:~:text=Based%20on%20the%20Juran%20Institute’s,day%20human%2C%20structural%2C%20and%20technological
10. Klefsjö B, Wiklund H, Edgeman RL. Six sigma seen as a methodology for total quality management. Meas Bus Excell. Emerald; 2001 Mar;5(1):31–35. CrossRef
11. Steele C. Process capability statistics: Cp and Cpk, working together. Available from: https://blog.minitab.com/blog/statistics-and-quality-improvement/process-capability-statistics-cp-and-cpk-working-together
12. Six sigma-materials: process capability indices. 2020 [cited 2020 Aug 6]. Available from: https://www.six-sigma-material.com/Process-Capability-Indices.html
13. Measuring your process capability [Internet]. Measuring your process capability: Symphony technologies. [cited 2023 Dec 13]. Available from: https://www.symphonytech.com/articles/processcapability.htm
14. Tesfay YY. Process capability analysis. In: Developing structured procedural and methodological engineering designs [Internet]. Cham, Switzerland: Springer International Publishing; 2021. pp 187–209. CrossRef
15. Neyestani B. Seven basic tools of quality control: the appropriate techniques for solving quality problems in the organizations. SSRN Electron J, 2017. CrossRef
16. George J, Bhaisare AK, Singh A. A study of basic 7 quality control tools & techniques for continuous improvement [Internet]. Bhopal, India: 2nd International Conference on “Emerging Trends in Mechanical Engineering” [ICETME-2018]; 2018 Mar; 5(1). Available from: https://www.researchgate.net/publication/334056570_A_Study_of_Basic_7_Quality_Control_Tools_Techniques_for_Continuous_Improvement
17. Magar VM. Application of 7 quality control (7 QC) tools for continuous improvement of manufacturing processes [Internet]. 2014. Available from: https://www.semanticscholar.org/paper/Application-of-7-Quality-Control-(7-QC)-Tools-for-Magar-Shinde/dd3ec1c0b3a50444d6ff8156b69dc807f9a45d07
18. Gejdoš P. Continuous quality improvement by statistical process control. Procedia Econ Finan. 2015;34:565–72. CrossRef
19. Bhaskarabhatla A, Chatterjee C, Anurag P, Pennings E. Mitigating regulatory impact: the case of partial price controls on metformin in India. Health Policy Plan. 2016;czw109. CrossRef
20. Miglani A, Saini C, Musyuni P, Aggarwal G. A review and analysis of product recall for pharmaceutical drug product. J Generic Med. 2021 Jul 22;18(2):72–81. CrossRef
21. Ebbutt A. Basic statistics and pharmaceutical statistical applications (second edition). Pharm Stat. 2007;7(2):151–2. CrossRef
22. Rowe P. Essential statistics for the pharmaceutical sciences. Hoboken, NJ: John Wiley & Sons; 2015. Available from: https://books.google.ie/books?id=nsM1CgAAQBAJ&pg=PA4&dq=ISBN:+978-1-118-91339-0&hl=&cd=1&source=gbs_api.
23. Chikwendu OC, Chima AS, Edith MC. The optimization of overall equipment effectiveness factors in a pharmaceutical company. Heliyon. 2020 Apr 18;6(4):e03796. CrossRef
24. Chabukswar AR, Jagdale SC, Kuchekar BS, Kothawade HS, Kuckekar AB, Joshi VD, et al. Six sigma: process of understanding the control and capability of ranitidine hydrochloride tablet. J Young Pharm. 2011 Jan;3(1):15–25. CrossRef
25. Chandarana C, Rai P, Jadhav D. Measurement of process capability of manufacturing process of levetiracetam by applying concept of six sigma. Indian J Pharm Educ Res. 2023 Mar 22;57(2):386–92. CrossRef
26. Adekeye KS, Ogundele J. Evaluating process capability indices for some quality characteristics of a manufacturing process. Ideas.repec.org. 2013. Available from: https://ideas.repec.org/a/spt/stecon/v2y2013i3f2_3_9.html
27. Nkansah P, Wu S-J, Lukulay P, Taylor G, Hsieh W-Y, Spong B, et al. Using colorimetric techniques and capability analysis to develop standard placebo tablets for clinical studies. J Pharm Innov. 2009 Jun;4(2):71–80. CrossRef
28. Vugigi S, Mshila C, Ogaji I. Use of product quality review to evaluate quality and process capability: a case study of Ibuprofen in a model tablet manufacture. ECAJPS. 2021 Nov 14 [cited 2023 Dec 13];24(1):38–47. Available from: https://uonjournals.uonbi.ac.ke/ojs/index.php/ecajps/article/view/842
29. Oo A. A study of some quality characteristics of paracetamol tablet. J Health Med Nurs [Internet]. 2021. Available from: https://iiste.org/Journals/index.php/JHMN/article/view/57699.
30. Hassouna ME. Application of lean six sigma methodologies and in-vitro dissolution studies for simultaneous determination of Cefdinir and Sodium Benzoate by RP-HPLC and UPLC methods in their dosage forms. Biomed J Sci Tech Res. 2019 Apr 3;16(5). CrossRef.
31. Chandarana C, Rai P, Jadhav D. Measurement of process capability of manufacturing process of Levetiracetam by applying concept of six sigma. Indian J Pharm Educ Res. 2023 Mar 22;57(2):386–392. CrossRef.
32. Tijare LK, Deshmukh LT, Mohod AA, Bhandakkar VM, Hore S, Padole NN. Process validation of highly potent Antidiabetic tablets of Voglibose 0.2 Mg. Asian J Pharm Res Dev. 2022 Apr 16;10(2):90–110.doi: https://doi.org/10.22270/ajprd.v10i2.1070.
33. Abubakar M. Process capability improvement using define, measure, analyze, improve, and control approach in the manufacturing of fexofenadine hydrochloride tablet. 2020. Available from: https://www.isfcppharmaspire.com/article_html.php?did=13832&issueno=0.