INTRODUCTION
Hypothyroidism and hyperthyroidism are common endocrine disorders that can have significant impacts on health [1]. Hypothyroidism is treated with levothyroxine. Levothyroxine is a synthetic version of thyroid hormone. For hypothyroidism, levothyroxine monotherapy is the recommended course of treatment [2]. Thyroid hormones are endogenous chemical classes that have undergone in-depth metabolomics characterization. Clinically, quantitative hormone studies are utilized to identify hypothyroidism. Levothyroxine is a thyroid hormone that has been licensed to treat hypothyroidism, a condition caused by low thyroid hormone production [3]. According to data, 5%–10% of hypothyroid patients using levothyroxine and having normal blood thyrotrophin levels nonetheless have symptoms of hypothyroidism [4,5]. It is advised that levothyroxine monotherapy continue to be the accepted course of treatment for hypothyroidism because there is inadequate data to support the claim that levothyroxine and liothyronine combination therapy is superior to levothyroxine monotherapy [6].
Metabolomics techniques would not be possible without high-sensitivity, high-resolution techniques such as mass spectrometry. Therefore, awareness of information on health and disease is boosted by human metabolism [7]. Few analytical and bioanalytical procedures have been developed and validated using liquid chromatography-tandem mass spectrometry (LC-MS/MS) [9–12]. The bioanalytical method has been developed and validated using ultra high-performance liquid chromatography coupled with mass spectrometry (UHPLC-MS/MS) for the simultaneous determination of levothyroxine and liothyronine in human serum. Linearity was established for levothyroxine from 50.37 ng/ml–300.13 ng/ml and for liothyronine, from 0.5 to 50.37 ng/ml [12].
According to the literature available from the Office of General Drug in Food and Drug Administration (Recommended December 2014), levothyroxine and liothyronine are endogenous compounds present in biological samples. Baseline correction (subtraction of endogenous concentration) is therefore important for measuring levothyroxine and its metabolite liothyronine in human serum. It is important to identify the endogenous counterpart of the analyte for demonstrating essential information for drug development and formulation.
When the test is unable to discriminate between the therapeutic substance and its endogenous counterpart, it becomes difficult to quantify endogenous chemicals accurately. In these circumstances, it is advised to use other alternative approaches for validating and tracking assay performance [8].
The research was done by Dutt R. et al. where the linearity range for levothyroxine (50.37 to 300.13 ng/ml) and for liothyronine (0.5 to 50.37 ng/ml) was used. The lower limit of quantitation (LLOQ) was not enough and was not able to quantitate endogenously present analyte and metabolite in serum. Hence, it is crucial to measure the levels of endogenous levothyroxine and liothyronine, because they are pharmacologically active moieties and present in the body. However, there is currently no bioanalytical method available to determine the amount of endogenously present liothyronine and levothyroxine in the biological matrix.
The proposed research is sensitive enough to quantitate endogenously present levothyroxine and liothyronine in human serum. As per regulatory guidelines for the Office of General Drug in Food and Drug Administration (Recommended Dec 2014), an alternative scientific approach should be followed, to use an analyte-free matrix for quantification of endogenous concentration. Alternative scientific approaches include buffers, dialyzed serum, and alternative matrices are suggested for the preparation of the calibration curve. The quality controls (QCs) must be prepared in the same matrix as used for the study sample. Charcoal stripping is used in proposed research because of its adsorbent properties due to its high surface area. Analyte-free matrix was prepared and named a stripped matrix. The bioanalytical method is rugged, compliance with regulations, and successfully implemented for bioequivalence studies.
MATERIALS AND METHODS
Materials
Liothyronine-15N-13C9 and levothyroxine sodium (purity; 99.23%) were purchased from BioOrganics and Applied Materials Pvt. Ltd. Bangalore, India. Liothyronine sodium (purity; 90.00%) was purchased from Clearsynth Labs Ltd. Mumbai, India. Levothyroxine D3 HCl was procured from Vivan Life Sciences Pvt. Ltd. Mumbai, India. All standards were stored in the refrigerator, with temperature maintained at 2°C to 8°C. Reference product (R): SYNTHROID® levothyroxine sodium tablets USP 300 mcg, human serum was procured from Neuberg Supratech Reference Laboratories in Ahmedabad, Gujarat, India. An extraction cartridge of Strata-X 30 mg/ml reverse phase was purchased from Phenomenex.
Chemicals and reagents
Methanol (HPLC-grade) was procured from J. T. Baker, Mumbai, India. Activated charcoal was supplied by Merck Life Science Private Limited, Bangalore, India. Formic acid of EMPARTA grade was procured from Merck Life Science Private Limited in Mumbai, India. Acetic acid of analytical reagent (AR) was procured from SDFCL in Mumbai, India. Water HPLC grade was procured from Dimer Chemicals Pvt. Ltd. was used.
Equipment and chromatographic optimization
A Shimadzu scientific instrument (UHPLC, LC-30AD; Serial Number; L20555205074, Shimadzu Corporation; Kyoto, Japan) was used to perform liquid chromatography. An analytical column (Kinetex®2.6 m particle size polar C18 100 X 4.6 mm, Pore Size 100ºA) was used for chromatographic resolution of analyte and metabolite. The column oven (Serial Number; L20215214090) was maintained at a temperature of 40°C. The autosampler chamber (Serial Number; L20565202453) was maintained at the temperature of 5°C, throughout the analysis. A binary gradient program containing Pump A (acetic acid) and Pump B (acetic acid in methanol) was used for the separation of analyte and metabolite. A run time of 6 minutes was finalized based on a gradient program for intense chromatographic optimization, and peak resolution for analyte and metabolite. The Shimadzu LCMS-8050 (Shimadzu Corporation; Serial Number; O10835200230; Kyoto, Japan) triple quadrupole mass spectrometer was employed for the ionization and detection, and electrospray ionization with positive polarity was used in conjunction with multiple reaction monitoring (MRM). The calibration frequency for UHPLC and LCMS-8050 was set for every six months.
A solution (500 ng/ml) of levothyroxine and liothyronine was used to tune the mass spectrometer Interface parameters. For quadrupoles 1 and 3, a unit resolution was kept with a dwell time of 100 milliseconds. Levothyroxine, liothyronine, levothyroxine D3, and liothyronine 15N 13C9 were found with mass transitions of 777.55→731.75, 651.70→605.85, 780.60→734.65, and 661.60→614.65, respectively. Shimadzu Corporation, Kyoto, Japan’s Lab Solution version 5.72B software was used to accomplish the data collecting and processing.
Preparation of stripped serum
A ratio of human serum: water: methanol (5.0:4.9:0.1) was taken and mixed in a beaker. The rationale for using the ratio of human serum: water: methanol (5.0:4.9:0.1) was to precipitate and dilute serum. The sample was centrifuged (HeraeusMultifuge X3R centrifuge, Thermo Scientific) at 4000 rpm for 10 minutes and during the process, temperature was maintained at 10°C. Further supernatant serum was collected in a tube and mixed with activated charcoal. Then, the tube was spun on an extractor (Nitor Scientific, LLE-0918) at 20 rpm for 4 hours. Again sample was centrifuged at the same condition mentioned earlier. Afterward, collect supernatant serum for further experimentation.
Calibration curve standard and QC samples
Stock solutions
Stock solutions of levothyroxine (0.250 mg/ml) and liothyronine (0.250 mg/ml) were prepared in methanol.
Intermediate solution
The stock solution was further diluted to prepare an intermediate solution to achieve the concentration of 100 and 1.5 µg/ml for levothyroxine and liothyronine in methanol, respectively.
Calibration curve preparation
Serial dilutions were made from the intermediate solution to prepare various concentrations of levothyroxine (ranging from 20 to 1000 ng/ml) and liothyronine (ranging from 0.30 to 15.0 ng/ml) in stripped serum. These were used to create calibration curves for validation studies. The calibration range was selected based on Cmax details (i.e., two times of Cmax for ULOQ and 5% of Cmax for LLOQ) of published literature. Method development trials were taken for endogenous concentration quantification, especially LLOQ concentration.
QC samples
QC samples of levothyroxine were prepared at concentrations of LLOQ (20 ng/ml), low quality control (LQC) (60 ng/ml), MQC (500 ng/ml), and high quality control (HQC) (750 ng/ml), whereas, for liothyronine, the concentrations were prepared at LLOQ (0.30 ng/ml), LQC (0.60 ng/ml), MQC (7.50 ng/ml), and HQC (11.25 ng/ml) level in stripped and un-stripped (normal) serum. These QC samples are used to assess the accuracy and precision of the analytical method.
Internal standard stock solution
Stock solutions of the internal standards (levothyroxine D3 and liothyronine 15N 13C9) were prepared at a concentration of 0.250 mg/ml in methanol.
Mixed internal standard intermediate solution
An intermediate internal standard solution was prepared by mixing 0.80 ml of levothyroxine D3 and 0.08 ml of liothyronine 15N 13C9 stock solution in 50 ml of methanol. Finally achieved a concentration of 4,000 and 400 ng/ml for levothyroxine D3 and liothyronine 15N 13C9, respectively.
Mixed internal standard dilution
Mixed internal standard dilution was prepared by mixing 2.5 ml of intermediate internal standard solution, levothyroxine D3 (4,000.000 ng/ml), and liothyronine 15N 13C9 (400.000 ng/ml) in 50 ml of methanol. Finally achieved a concentration of 200 and 20 ng/ml for levothyroxine D3 and liothyronine 15N 13C9, respectively. The concentration for both internal standards was decided based on method development trials by considering optimum, consistent, and reproducible peak response.
Storage and light protection
Calibration curves and QC samples are crucial for ensuring the reliability and validity of the analytical method. Proper storage and protection from light are also important to maintain the integrity of the solutions. All working solutions were stored at 5°C ± 3°C and protected from normal light to maintain their stability.
Extraction protocol
A mixed solution of levothyroxine D3 (200.00 ng/ml) and liothyronine 15N 13C9 (20.00 ng/ml) was added to a 0.1 ml spiked serum sample. The sample was blended with 750 µl of 0.1% formic acid (as a buffering agent) using a digital pulse mixer (Glas Col, USA). All samples were centrifuged for 10 minutes at a speed of 4,000 rpm and temperature was maintained at 10°C. Samples were loaded on Strata-X reverse phase 30 mg/ml extraction cartridges on a positive pressure processor. The cartridges were washed with water and eluted the content with methanol. All samples were dried by use of inert nitrogen gas at 40°C ± 5°C. Reconstitute the samples with 150 µl of reconstitution solution (a ratio of acetic acid in water 0.1% v/v and methanol as 20:80) and vortex to mix. Further samples were analyzed by injecting 10 µl volume in UHPLC-MS/MS.
Method validation
A bioanalytical method validation for the simultaneous determination of levothyroxine and liothyronine was accomplished in stripped and un-stripped human serum as per regulatory guidelines [8].
Specificity
Specificity for endogenous levothyroxine and its metabolite liothyronine was done by verifying the interference in human serum at the retention time in miscellaneous lots (i.e., normal serum including hemolysed and lipidemic serum lots). Interference at retention time of analyte should be less than 20% with LLOQ response and less than 5% of IS for stripped and un-stripped samples at LLOQ response.
Determination of endogenous concentration
The endogenously present levothyroxine and liothyronine in the human serum were quantified by zero samples of un-stripped serum (blank samples with IS) in triplicate, plotted along with calibration curve standards. Determination of endogenous concentration is necessary to evaluate unknown concentrations in serum to find out the exact concentration.
Linearity, accuracy, and precision
The calibration curve was plotted with the linearity range of levothyroxine was 20–1000ng/mL and for liothyronine, it was 0.30–15 ng/ml. Linearity was processed and evaluated in three consecutive runs for three days. Six replicates of the QC set (LLOQ QC, LQC, MQC, and HQC) in stripped and un-stripped serum were analysed for the assessment of accuracy and precision of intraday and interday batch. Within 15% of the nominal values and 15% of the coefficient of variance (% CV) are the acceptability standards for accuracy and precision, respectively [8].
Lower limit of quantification (LLOQ)
The LLOQ is the lowest concentration under specified conditions and yields quantitative data with acceptable accuracy and precision within the assay’s linear range. It is verified by analysis of the data from a known concentration (LLOQ) in stripped serum, with a signal-to-noise ratio of 5:1. For each LLOQ level, the accuracy and coefficient of variation (%CV) must fall within 20% of the nominal values [8].
Recovery
Three concentration levels (low, middle, and high) of stripped and un-stripped serum were used to study the recovery of the analyte. The recovery was determined by comparing the mean peak area of the extracted samples with the peak area of the un-extracted samples. The recovery should be consistent at each QC level [8].
Matrix effect
The matrix effect is a term used to describe various undesirable outcomes that frequently result from biological matrices. Matrix effects cause ion suppression or enhancement, a gradual decline or rise in analyte sensitivity, an elevated baseline, data imprecision, a drift in retention time, and distortion or tailing in the chromatographic output. By contrasting the peak areas of analytes in unextracted (post spiked) samples with the peak areas of aqueous solutions made in (neat solution) reconstitution solution, the matrix effect was evaluated. The matrix effect at HQC and LQC concentration levels was assessed using ten distinct stripped and un-stripped serum batches. Since, un-stripped serum samples contain endogenous levothyroxine and liothyronine, hence, three blank samples were analyzed from each lot. The area obtained in un-stripped serum was deducted from the mean peak area of the blank samples. The % CV of the normalized matrix effect should be within 15% [8].
Stability
The serum stability was evaluated at HQC and LQC concentration levels in different parameters. Six replicate higher (HQC) and lower (LQC) samples were used to analyze at different stability conditions such as benchtop (25°C), freeze-thaw (−70°C), stability of the extract (25°C and 5°C), dry extract (−20°C), and long-term stability (−70°C). Analyte and metabolite concentrations in stability samples were compared to freshly prepared samples. Acceptance criteria: The % CV for LQC and HQC samples should be within 15.00 from their nominal concentration and the % mean accuracy of stability samples at each level should be within ±15.00% from their nominal concentration.
RESULTS AND DISCUSSION
Optimization of the mass spectrometric parameters
Optimizing the mass spectrometric parameters was crucial for the identification and quantification of levothyroxine and liothyronine in human serum. The parameters for the mass spectrometer were optimized using the positive ionization mode. The purpose of optimization of mass parameters is to achieve sensitivity, resolution, consistency, and reliability of results. The optimization was done manually as well as automatically. The parent ion spectra of levothyroxine and liothyronine, as well as levothyroxine D3 (ISTD 1) and liothyronine 15N 13C9 (ISTD 2), are shown in Figure 1(a)–(d), respectively.
Optimization of the chromatographic conditions
Chromatographic conditions were initially optimized in isocratic mode for appropriate separation of levothyroxine and liothyronine. Different compositions of mobile phase buffers with a mixture of organic solvents at diverse pH were applied. During optimization, it was found that the acidic mobile phase was adequate in terms of peak intensity, but resolution was not gained adequately. Afterward, many columns were tried (Table 1). Finally, the optimum resolution between levothyroxine and liothyronine and symmetrical chromatography with response was achieved by Kinetex of Phenomenex 100 mm type polar C18 column (particle size 2.6 µm; internal diameter 4.6 mm).
To overcome column loading and lengthen column lifespan, a small injection volume (10 µl) was used. In the binary gradient program (Table 2), where, solvent A (acetic acid in water) and solvent B (acetic acid in Methanol) were used as mobile phase.
Optimization of extraction procedure
The extraction process is one of the most important stages in the development of a method in bioanalysis where the method should be simple, use the least amount of sample with maximum recovery, and have no impact on the matrix in the quantification of the analyte. Methanol and acetonitrile were utilized as the precipitating agents, although there was noticeable ion suppression. Different extraction solvents, including ethyl acetate, diethyl ether, methyl-tert-butyl ether, and combinations of organic solvents, were used in a liquid–liquid extraction process. Although recovery of the analytes was not achieved using acidic and basic buffers, no suppression or enhancement of ions was seen using the liquid–liquid extraction approach.
Furthermore, solid phase extraction methods with ion exchange cartridges were used, but recovery was not improved. These methods included weak cation exchange, mixed cation exchange, weak anion exchange, and mixed anion exchange (MAX), of Oasis. Therefore, C18 cartridges such as Strata X from Phenomenex, HLB from Oasis, and Celerity Deluxe from Orochem were used to clean samples. The results revealed that Strata X from Phenomenex, had the best recovery at all levels and during optimization, there ion suppression or enhancement was not found.
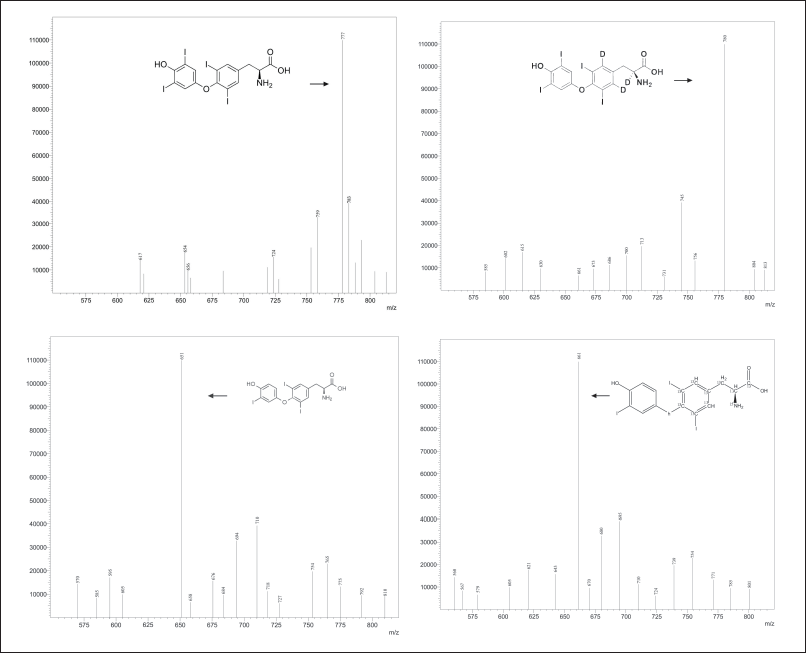 | Figure 1. (a) Mass spectrum of levothyroxine. (b) Mass spectrum of liothyronine. (c) Mass spectrum of levothyroxine D3. (d) Mass spectrum of liothyronine 15N 13C9. [Click here to view] |
Specificity
The specificity of the intended method was established for stripped and un-stripped serum. For stripped serum, one blank sample (without spiking with drug or internal standard) and one LLOQ sample (lower limit of quantification) of ten different lots were evaluated.
For un-stripped serum, one blank (without spiking with drug or internal standard) and atleast 08 different lots (containing atleast one hemolyzed serum lot and one lipidemic serum lot) were evaluated.
Significant interferences were not detected at the retention time of levothyroxine, liothyronine, and both internal standards in stripped serum. Figure 2(a)–(c) depicted chromatograms of Blank, upper limit of quantification (ULOQ), and LLOQ in stripped serum.
Linearity, accuracy, and precision
The linearity range was selected in such a way as to quantify the lower endogenous concentration of levothyroxine and liothyronine in a range from 20.0 to 1,000 and 0.30 to 15 ng/ml, respectively. Calculated concentration against concentration was determined by using linear regression with a weighting factor of 1/X2. Three Accuracy and Precision batches were performed on three consecutive days. Regression and computation of results were done by using Watson LIMS software (Thermo Scientific), Version number 7.3. Watson LIMS is used because it is in compliance with 21 CFR part 58. It manages validation and study design and worldwide accepted. All three accuracy and precision batches were assessed with regression values ≥0.98 on three consecutive days. Six replicates of QC samples at four concentrations (HQC, MQC, LQC, and LLOQ QC) level were validated. Levothyroxine and liothyronine inter-day precision findings were within 15%, as represented in Tables 3 and 4, respectively.
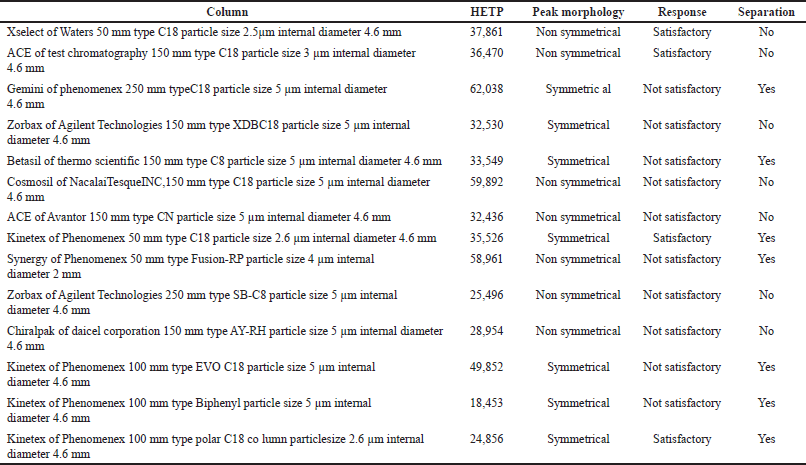 | Table 1. Method development trials. [Click here to view] |
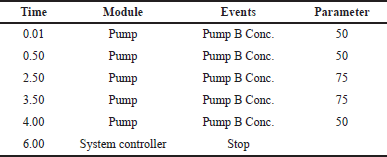 | Table 2. Mobile phase in gradient program. [Click here to view] |
Recovery
Recovery was performed and evaluated in stripped and un-stripped serum at LQC, MQC, and HQC concentration levels for both levothyroxine and liothyronine. The recovery was found consistent at each level and overall recovery of levothyroxine and liothyronine were found to be 81.05% and 81.52% in stripped serum and 99.17% and 95.04% in un-stripped serum. The percentages of recovery are shown in Table 5 as a summary of the recovery’s outcomes.
Matrix effect
The matrix effect was evaluated with ten different lots of serum lots at LQC and HQC concentration levels. The results showed (Table 6) that no suppression and enhancement were found at the analyte and its metabolite peak response when compared with neat samples and un-extraction samples. Results concluded that the quantitation was accurate without altering the results.
Stability
Six replicates were analyzed to assess the stability of levothyroxine and liothyronine in stripped and un-stripped serum at LQC and HQC concentration levels. The results of stability studies (such as bench top, stability of extract at ambient temperature, and at 2°C–8°C, freeze-thaw at −70°C for five cycles, dry extract at −20°C, and long-term at −70°C) were summarized in Tables 7 and 8 for levothyroxine and liothyronine, respectively.
INCURRED SAMPLE REANALYSIS (ISR)
The goal of ISR, a crucial step in the validation of bioanalytical methods, is to confirm the accuracy of the analyte concentrations in the sample that was reported. Analyte concentrations from research samples are repeatedly measured (ISR) to show repeatability. Study samples or samples from participants or patients who have taken a dose are known as incurred samples. This procedure is to ensure that regulatory agency requirements relating to incurred sample evaluation are met. This procedure does not apply to reassay for analytical reasons (assignable or unassignable causes) or requested pharmacokinetic repeats. The proposed bioanalytical method for simultaneous determination of endogenously present levothyroxine and its metabolite liothyronine in human serum can be used in clinical studies. ISR samples were chosen at the Tmax phase and elimination phase, and the reproducibility of the bioanalytical approach was demonstrated. Figure 3(a) and (b) depicted the outcomes of ISR of levothyroxine and liothyronine, respectively. More than 67.00% of the reanalyzed samples were found within ±20.00% (% difference) when compared with the original concentration for chromatographic assays, which showed method is reproducible. The % difference was calculated by the formula given below.
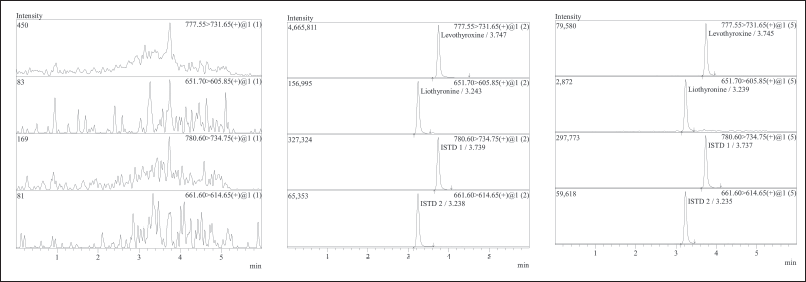 | Figure 2. (a) Chromatograms of levothyroxine, liothyronine, levothyroxine D3, and liothyronine 15N 13C9 of standard blank in stripped serum. (b) Chromatograms of levothyroxine, liothyronine, levothyroxine D3, and liothyronine 15N 13C9 of the upper limit of quantification (ULOQ) in stripped serum. (c) Chromatograms of levothyroxine, liothyronine, levothyroxine D3, and liothyronine 15N 13C9 of the LLOQ in stripped serum. [Click here to view] |
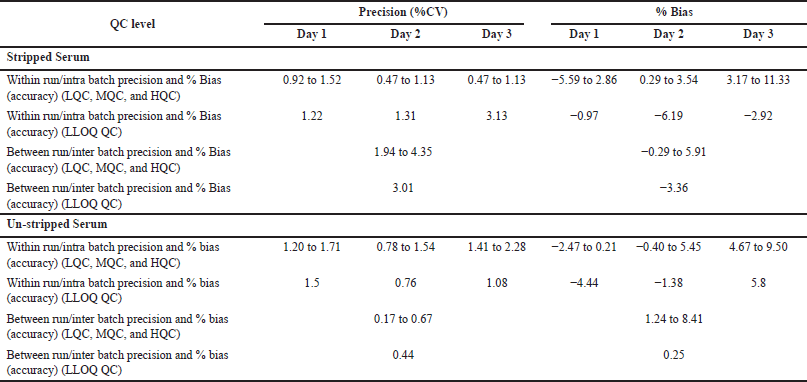 | Table 3. Intra-day and inter-day variation for levothyroxine in six replicates (n = 6) at each concentration. [Click here to view] |
BIOEQUIVALANCE APPLICATION
Study design
An open-label, balanced, randomized, single-dose, two-treatment, two-sequence, four-period, full replicate, and crossover oral bioequivalence study of SYNTHROID® (levothyroxine sodium) 300 mcg Tablet of AbbVie Inc., North Chicago, IL, at a dose of 0.6 mg in healthy, adult, human subjects under fasting condition.
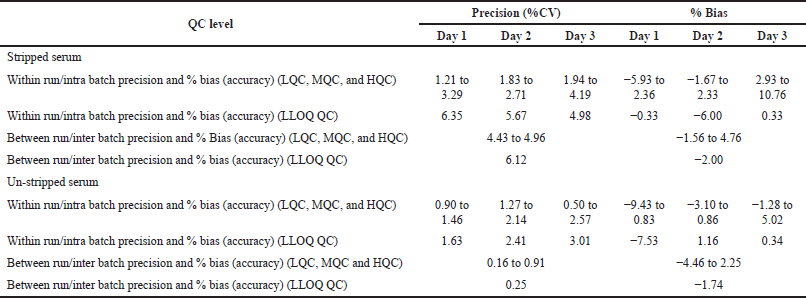 | Table 4. Intra-day and inter-day variation for liothyronine in six replicates (n = 6) at each concentration. [Click here to view] |
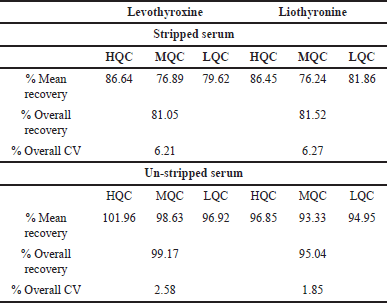 | Table 5. Recovery values of levothyroxine and liothyronine (n = 6). [Click here to view] |
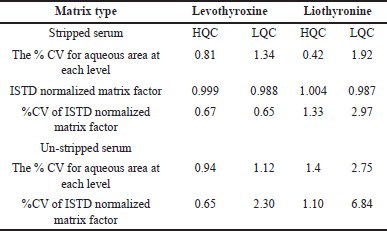 | Table 6. Matrix factor for levothyroxine and liothyronine at high and low levels (n = 10). [Click here to view] |
Methodology
Treatments were allocated according to a randomization code generated using SAS® software version 9.4. Blood samples were drawn from subjects pre-dose and up to 48.00 hours post-dose in each study period. Serum concentrations of levothyroxine and its metabolite liothyronine were analyzed using a validated bioanalytical method (solid phase extraction). Statistical analysis of pharmacokinetic parameters of test and reference formulations was performed to assess bioequivalence.
Diagnosis and main criteria for inclusion
Healthy, consenting human volunteers aged 18 and 45 years (both inclusive), body mass index [18.50 to 24.99 kg/m2 (both inclusive)] with a minimum of 45 kg weight were selected on the basis of laboratory evaluations (including serum TSH, T3, and T4), medical history, clinical examination [including vital signs (blood pressure, body temperature, radial pulse rate, and respiratory rate), physical examination and systemic examination], chest X-ray* (PA view), urine pregnancy test (only for female subjects during screening), and ECG during screening. Considering the COVID-19 condition as per PI discretion, a chest X-ray (PA view) was performed for all the volunteers at screening. Serum b-hCG pregnancy test (only for female subjects), urine screen for drugs of abuse test, and urine alcohol test were performed on admission day in each study period.
Pharmacokinetic and statistical method
Baseline serum concentrations of levothyroxine and liothyronine were measured at −0.50, −0.25, and 0 hours before dosing. The mean of the pre-dose concentrations (−0.50, −0.25, and 0 hours) of levothyroxine and liothyronine was used for the baseline adjustment of 0 hour and all the post-dose concentrations of respective periods for all the subjects. For each subject, baseline concentrations were determined for each dosing period, and baseline adjustments were period specific. When a negative serum concentration value resulted after baseline adjustments, this was set to 0 before calculating the baseline-adjusted AUC. Figure 4(a) and (b) shows the AUC graph of levothyroxine and liothyronine, respectively. Employing the estimated baseline corrected concentration-time profiles of levothyroxine and liothyronine, the following pharmacokinetic variables were calculated: Primary variables: Cmax and AUC 0-48, Secondary variable: Tmax (Table 9).
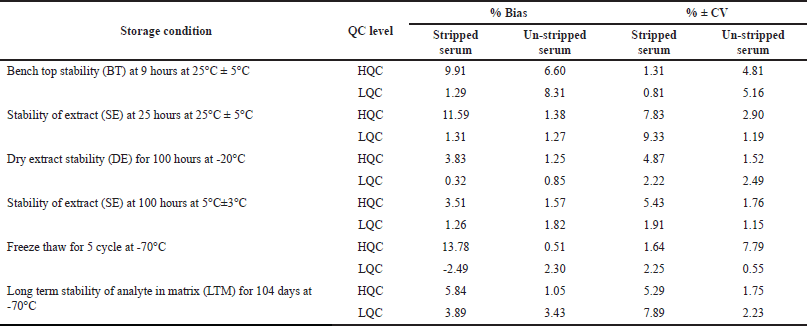 | Table 7. Stability studies of levothyroxine in human serum at high and low concentrations (n = 6). [Click here to view] |
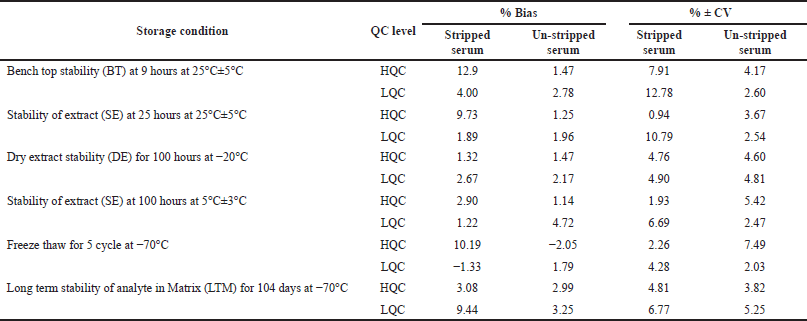 | Table 8. Stability studies of liothyronine in human serum at high and low concentrations (n = 6). [Click here to view] |
Descriptive statistics (No. of observation, mean, standard deviation, %CV, minimum, median, maximum, and geometric mean) were computed for each pharmacokinetic parameter for the test and reference product using Phoenix WinNonlin® 8.0 or higher version for levothyroxine and liothyronine. Using the SAS® package (SAS Institute Inc., Cary, NC, version 9.4 or higher), the statistical analysis of the ln-transformed pharmacokinetic parameters Cmax and AUC0-48 will be performed for levothyroxine. Statistical analyses were performed and reported using all the approaches, namely, reference scaled average bioequivalence, conventional average bioequivalence approach, and upper limit of the 90% equal-tails confidence interval on the ratio of the within-subject standard deviation.
 | Figure 3. (a) ISR results of levothyroxine. (b) ISR results of liothyronine. [Click here to view] |
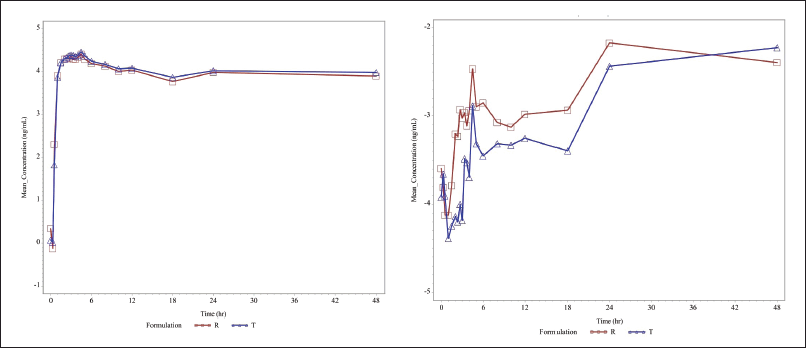 | Figure 4. (a) Linear and semi-logarithmic plots of mean serum concentrations of levothyroxine versus time. (b) Linear and semi-logarithmic plots of mean serum concentrations of liothyronine versus time [Click here to view] |
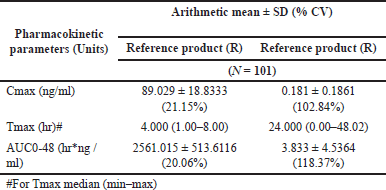 | Table 9. Mean pharmacokinetic parameters of baseline corrected levothyroxine and liothyronine. [Click here to view] |
CONCLUSION
Levothyroxine D3 and liothyronine 15N 13C9 were used as internal standards in the development and validation of the UHPLC-ESI-MS/MS, bioanalytical technique for simultaneous determination of endogenously present levothyroxine and its metabolite liothyronine in stripped and un-stripped human serum. This technique offers a number of advantages, including the ability to measure endogenous, levothyroxine and liothyronine in both stripped and unstripped serum, as well as being extremely sensitive and selective, having a low processing volume, shorter run time, and having no matrix effect. This study provides solid scientific evidence for clinical bioequivalence studies of levothyroxine and its metabolite, liothyronine, in humans, demonstrating the effectiveness of formulations used for social welfare.
LIST OF ABBREVIATIONS
% = percentage; °C = degree Celsius; ng = nanogram; ml = millilitre; mm = micrometer; µm = micrometer; LC = liquid chromatography; HQC = high quality control; IS = internal standard; LC-MS/MS = liquid chromatography-tandem mass spectrometry; LLOQ = lower limit of quantification; LQC = low quality control; mg = milligram; min = minute; MQC = medium quality control; Rpm = rotations per minute; CV = coefficient of variance = ULOQ = upper limit of quantification
ACKNOWLEDGMENTS
The authors acknowledge the ongoing technical assistance provided by Ms. Swati Guttikar, Dr. Ajay Gupta, and the staff of the Bioanalytical Department of Veeda Clinical Research Limited in Ahmedabad, which is the largest department of its kind in India.
AUTHOR CONTRIBUTIONS
Mr. Kanchan Soni investigation, conceptualization, writing—original draft and methodology. Dr. Gopal Prasad Agrawal supervision, writing—review, and editing the article. The Veeda Clinical Research Limited conducted this study. The authors would like to express their gratitude to Mr. Ajay Tandon (Managing Director) for providing the necessary resources and facilities for conducting innovative research.
FINANCIAL SUPPORT
There is no funding to report.
CONFLICTS OF INTEREST
The authors declare that they have no conflicts of interest.
ETHICAL APPROVALS
The study protocol was approved by the Anveshhan Independent Ethics Committee with approval number: 464.
DATA AVAILABILITY
All data generated and analyzed are included in this research article.
PUBLISHER’S NOTE
All claims expressed in this article are solely those of the authors and do not necessarily represent those of the publisher, the editors and the reviewers. This journal remains neutral with regard to jurisdictional claims in published institutional affiliation.
USE OF ARTIFICIAL INTELLIGENCE (AI)-ASSISTED TECHNOLOGY
The authors declares that they have not used artificial intelligence (AI)-tools for writing and editing of the manuscript, and no images were manipulated using AI.
REFERENCES
1. Taylor PN, Albrecht D, Scholz A, Gutierrez-Buey G, Lazarus JH, Dayan CM, et al. Global epidemiology of hyperthyroidism and hypothyroidism. Nat Rev Endocrinol. 2018 May;14(5):301–16. CrossRef
2. Peterson SJ, McAninch EA, Bianco AC. Is a normal TSH synonymous with “euthyroidism” in levothyroxine monotherapy? J Clin Endocrinol Metabol. 2016 Dec 1;101(12):4964–73. CrossRef
3. Upadhyay U, Ashwinbhai Vora P, Patel R, Prajapati B. Levothyroxine sodium-thyroid hormone replacement therapy for hypothyroidism: a review of patent literature. Recent Pat Biotechnol. 2023 Sep 1;17(3):245–56. CrossRef
4. Jonklaas J, Bianco AC, Bauer AJ, Burman KD, Cappola AR, Celi FS, et al. Guidelines for the treatment of hypothyroidism: prepared by the american thyroid association task force on thyroid hormone replacement. Thyroid. 2014 Dec 1;24(12):1670–751. CrossRef
5. Chaker L, Bianco AC, Jonklaas J, Peeters RP. Hypothyroidism and hypertension: fact or myth?–Authors’ reply. Lancet. 2018 Jan 6;391(10115):30. CrossRef
6. Nygaard B. 2012 ETA guidelines: the use of L-T4+ L-T3 in the treatment of hypothyroidism. Eur Thyr J. 2012;1(2):55–71. CrossRef
7. Gowda GN, Zhang S, Gu H, Asiago V, Shanaiah N, Raftery D. Metabolomics-based methods for early disease diagnostics. Expert Rev Mole Diagn. 2008 Sep 1;8(5):617–33. CrossRef
8. US Food and Drug Administration; U.S. Department of Health and HumanServices; Food and Drug Administration; Center for Drug Evaluation and Research (CDER); Center for Veterinary Medicine (CVM). Bioanalytical Method Validation: Guidance for Industry; U.S. Department of Health and Human Services, Food and Drug Administration: Silver Spring, MD, 2018.
9. Bertoncini CW, Palacios MJ, Fritz MC, Rodriguez MP, Acevedo C, Hunzicker GA, et al. Levothyroxine bioequivalence study and its narrow therapeutic index: comparative bioavailability results between two formulations available in Latin America. Adv Ther. 2023 Apr;40(4):1644–54. CrossRef
10. Nishant T, Sathish Kumar D, Arun Kumar PM. Role of pharmacokinetic studies in drug discovery. J BioequivAvailab. 2011;3:263–7.
11. Wang D, Stapleton HM. Analysis of thyroid hormones in serum by liquid chromatography-tandem mass spectrometry. Analytical and bioanalytical chemistry. 2010 Jul;397:1831–9. CrossRef
12. Dutt R, Malik KC, Karwa M, Jain GK. Development and validation of UPLC-MS/MS method for rapid simultaneous determination of levothyroxine and liothyronine in human serum. J Drug Deliv Ther. 2020 Jun 15;10(3–s):176–81. CrossRef