INTRODUCTION
Tuberous sclerosis complex (TSC), also known as Bourneville disease, is a rare multi-system hereditary illness characterized by the presence of hamartomas in the brain, kidney, heart, liver, skin, heart, and lung at various stages of life [1]. Renal angiomyolipoma is the most prevalent manifestation (80%) associated with TSC after neurological (90%) and cutaneous (90%). It increases the risk of severe life-threatening hemorrhage and impairs the renal parenchyma, leading to chronic kidney disease (CKD) and, eventually, end-stage renal disease in TSC patients [2].
Even in asymptomatic cases, TSC-associated renal angiomyolipomas larger than 3 cm warrant intervention, leading to the widespread use of mammalian target of rapamycin (mTOR) inhibitors [3–5] to safeguard renal function and mitigate the dangers of rupture and growth [6]. Among these inhibitors, everolimus, a drug licensed by the US Food and Drug Administration for the treatment of TSC-associated renal angiomyolipoma that does not require immediate surgery, plays a pivotal role. Notably, everolimus exerts a cytostatic effect on renal angiomyolipoma cell growth, preventing its progression [7].
Nevertheless, the administration of everolimus is not without consequences, as it is associated with several side effects, encompassing pneumonia, nasopharyngitis, sinusitis, amenorrhoea, stomatitis, upper respiratory tract infections, acne, and laboratory abnormalities such as hypercholesterolemia, hypertriglyceridemia and neutropenia [8,9]. Chronic use of everolimus further elevates the risk of gonadal dysfunction, immunosuppression-related complications, and interstitial lung disease [10–12].
Given the substantial side effects associated with everolimus, there is a growing impetus to explore alternative mTOR inhibitors derived from natural sources. Notably, asiaticoside and asiatic acid, compounds sourced from Centella asiatica, have recently emerged as promising candidates in the TSC disease model [13], showing potential as mTOR inhibitors. In the pursuit of novel therapeutic strategies, this study sought to investigate the differentially expressed genes (DEGs) in the UMB1949 cell line following exposure to everolimus, asiaticoside, and asiatic acid. Through a rigorous analysis of the significantly upregulated and downregulated DEGs, we aimed to elucidate their biological functions and systematically characterize their role, employing gene ontology (GO) term and Kyoto encyclopedia of genes and genomes (KEGGs) pathway enrichment analyses. This research endeavors to strengthen the knowledge base and offer potential alternatives for mTOR inhibition in the context of TSC-associated renal angiomyolipoma.
MATERIALS AND METHODS
Sample collection
A 12-well plate (Eppendorf, Germany) was each filled with 1 mL of cell suspension containing 8.0 × 10⁴ UMB1949 cell line (ATCC® CRL-4004™; Manassas, VA, USA) and incubated overnight. On the following day, the cells were washed three times with 1 mL of phosphate buffer saline before 1 mL of fresh medium containing dimethyl sulfoxide was added to each well and incubated overnight. The same procedures were performed with 100 μL of each of the following concentrations: 29.5 μM of everolimus, 300 μM of asiaticoside, and 60 μM of asiatic acid added into each well, respectively. The concentration of each compound was based on the IC50 identified in our previous study [13]. All the procedures were repeated three times on different days before RNA extraction.
Total RNA extraction and cDNA synthesis
Total RNA was extracted from untreated (control) and treated (everolimus, asiaticoside, and asiatic acid) groups by using the RNeasy Mini Kit (Qiagen, Germany). According to the manufacturer’s instructions, the RNase-free DNase kit (Qiagen, Germany) was applied to remove any sign of genomic DNA contamination from the total RNA of the UMB1949 cell line. The integrity of the ribonucleic acid (RNA) samples was evaluated by 1.0% (w/v) agarose gel electrophoresis, and the A260/230 and A260/280 nm absorption ratios were determined using the Infinite 200 NanoQuant machine (TECAN, Magellan, Austria, GmBh) supplemented with I-control™ software to estimate RNA purity and concentration. The concentration range of extracted total RNA used in this study was 44.85 to 310.3 ng/μl. The intact and good quality of the RNA was identified by the presence of sharp 28S and 18S ribosomal RNA bands without a smearing effect (Fig. 1). The intensity of the 28S rRNA band is approximately two times that of the 18S rRNA band (2:1 ratio).
 | Figure 1. Representation of total RNA extracted from the control and treated groups. Lane M: RiboRuler High Range RNA Ladder; Lane C: Control group; Lane A, E, and AA: Treated groups (asiaticoside, everolimus, and asiatic acid). [Click here to view] |
The total RNA was converted to complementary deoxyribonucleic acid (cDNA) by using the RT2 First Strand Kit (Qiagen, Germany), following the manufacturer’s procedure. The reaction conditions were as follows: an initial incubation step of genomic DNA elimination for 5 minutes at 42?C, followed by placing immediately on the ice for at least 1 minute, followed by a reverse transcription procedure for 15 minutes at 42?C and 95?C for 5 minutes.
RT2 profiler PCR array
The qPCR was implemented using the Stratagene Mx3000P qPCR System (Agilent Technologies, USA) with RT2 SYBR® Green ROX™ qPCR Mastermix (Qiagen, Germany), following the manufacturer’s procedure. The profiling of the mTOR pathway was performed using the RT2 Profiler PCR array panel (RT2 Profiler™ PCR Array Human mTOR Signalling, Qiagen, Germany, Cod. PAHS-098Z), which consists of 84 pathway-focused genes, 5 RGs, one genomic DNA control, three replicates of reverse transcription controls, and three replicates of positive PCR controls. The thermal profile setup was divided into three segments. Segment 1 (initial heat activation) was run for 1 cycle for 10 minutes at 95?C, followed by segment 2, which ran for 40 cycles for 15 seconds at 95?C for denaturation and 60 seconds at 60?C for annealing. Finally, segment 3 (default melt curve) was run for 1 cycle of 60 seconds at 95?C, 30 seconds at 55?C, and 30 seconds at 95?C. A melting curve analysis was carried out to assess primer specificity. The presence of a single peak in RT-qPCR melting curve products confirmed the specificity of the amplification product for each primer pair (Supplementary Materials Fig. S1). Each sample was run in triplicate, and the data are expressed as mean ± SD.
RT2 profiler PCR array to determine the reference genes (RGs)
Three biological replicates of each treated (everolimus, asiaticoside, and asiatic acid) and control group was used in this study. The results of mTOR profiling for each of the five proposed RGs are shown in Table S1 (Supplementary Materials). The mRNA level was quantified using RT-qPCR to determine the stability of gene expression. We calculated the cycle threshold (Ct) value for each gene, which represents the cycle at which the PCR product increases significantly. It was determined that three of the five proposed RGs in the RT2 Profiler PCR array panel (PAHS-098Z) met the selection criteria for RGs, beta-actin (ACTB), beta-2-microglobulin (B2M) and ribosomal protein large P0 (RPLP0) which were then selected as RGs for normalization purposes (Supplementary Material Table S2). The ΔΔCt method’s normalization was calculated using the average geometric mean value from Table S2.
RT2 profiler PCR array to determine the DEGs
The mTOR profiling was used to identify DEGs among 84 mTOR pathway-associated genes by examining their relative changes in mRNA expression levels following everolimus, asiaticoside, and asiatic acid treatment compared to the control group. The expression profiles of the 84 genes were analyzed using the ΔΔCt method, in which each gene was first normalized using ACTB, B2M, and RPLP0. The relative mRNA expression of the genes was expressed in terms of log2 fold change. All samples passed three data quality control tests, including PCR array reproducibility, reverse transcription efficiency, and genomic DNA contamination. The ΔΔCt method was used to determine the mRNA relative expression level of each gene in each treated and control group. The cut-off values for the selected DEGs were set to a fold change of >1 for upregulated genes and a fold change of 1 or less for downregulated genes, respectively, and a p-value < 0.05 was considered to indicate a statistically significant difference.
Bioinformatics analysis
The DEGs of each treated group were uploaded to the database for annotation, visualization, and integrated discovery (DAVID) (version 6.8) for functional and pathway enrichment analysis [14]. The official gene symbol was used as the identifier. The reference set “Homo sapiens” was used to calculate the p-value (Fisher’s exact test). The DEGs were mapped to data from the GO terms and the KEGG databases [15]. Only GO terms or pathways enriched with more than two DEGs, an EASE score of greater than 0.1, and a p-value < 0.05 were considered significant [16–19].
Validation of RGs and DEGs by RT-qPCR
The validation of RGs and DEGs was performed using the Stratagene Mx3000P qPCR System (Agilent Technologies, USA) with RT2 SYBR® Green ROX™ qPCR Mastermix (Qiagen, Germany) and RT2 qPCR Primer Assays (Qiagen, Germany), following manufacturer’s procedures. The thermal profile setup used in this stage was analogous to that used in profiling the mTOR pathway. In addition, in this step, no-template control for each primer pair was used to detect the presence of possible reagent contamination and unintended amplification products, such as primer dimers, and to rule out the possibility of genomic DNA contamination. Each sample was run in triplicate, and the data are reported as mean ± SD.
Statistical analysis
Statistical analyses were performed on the mTOR profiling and gene expression validation using the GeneGlobe Data Analysis Center software (Qiagen, Germany) based on the comparative Ct (ΔΔCt) method. The data were presented as mean ± SD. The p-values were calculated based on the Student’s t-test of the replicated 2(-ΔCt) values for each gene in the control and treated groups. The value of p < 0.05 was considered statistically significant.
RESULTS
Identification of DEGs
In this study, we analyzed the mRNA expression levels of DEGs in UMB1949 cells treated with everolimus, asiaticoside, and asiatic acid. Figure 2 presents a heat map diagram that displays the relative mRNA expression levels of the DEGs. We identified 22 DEGs (20 upregulated and two downregulated), 25 DEGs (23 upregulated and two downregulated), and nine DEGs (seven upregulated and two downregulated) out of 84 genes that showed significant differences in gene expression for everolimus, asiaticoside, and asiatic acid groups, respectively, when compared to control levels. Figure 3 shows the mRNA expression levels of selected genes that met the cut-off criteria. These results suggest that all treated groups had a significant effect on gene expression, which could have implications for the mTOR signaling pathway and TSC-associated renal angiomyolipoma.
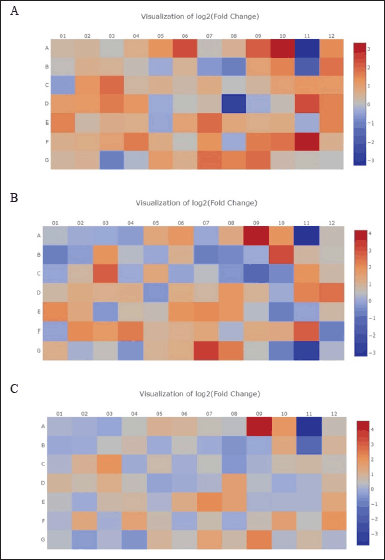 | Figure 2. The heat map diagram illustrates the relative mRNA expression levels of DEGs following (A) everolimus, (B) asiaticoside, and (C) asiatic acid treatment according to the RT2 profiler PCR array format of the mTOR pathway. The brown color showed a higher expression value, and the blue color showed a lower expression value. [Click here to view] |
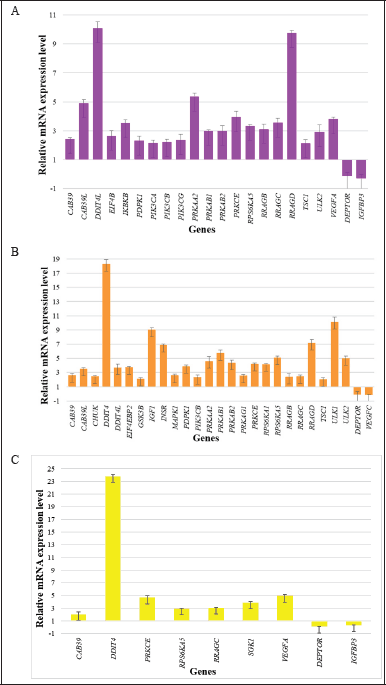 | Figure 3. Statistically significant gene expression in the mTOR pathway after 24 hours of (A) everolimus, (B) asiaticoside, and (C) asiatic acid exposure. The experiments were repeated three times. The error bars represent the standard deviation. [Click here to view] |
GO terms and KEGG pathway enrichment analysis
To further analyze and systematically characterize the significant DEGs identified in this study using DAVID, we performed functional annotation and pathway enrichment analyses using GO terms and the KEGGs. The DEGs were categorized into biological processes (BPs), molecular functions (MFs), and cellular components (CCs) based on GO classification. These analyses provide additional insights into the potential roles and functions of the DEGs in the mTOR signaling pathway and TSC-associated renal angiomyolipoma.
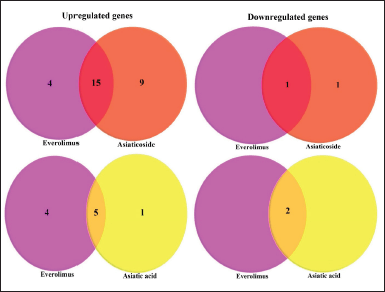 | Figure 4. Venn diagrams analysis of DEGs for everolimus, asiaticoside, and asiatic acid. The intersection of the two circles represents overlapping upregulated and downregulated genes between the two treated groups. [Click here to view] |
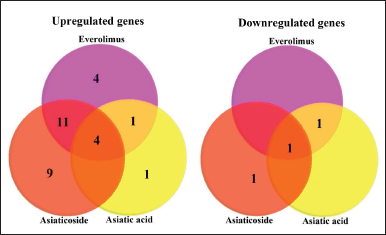 | Figure 5. The intersection of the three circles represents overlapping upregulated and downregulated genes among the three treated groups. [Click here to view] |
Using Venn diagram analysis, 16 DEGs (15 upregulated: PRKCE, RRAGC, RPS6KA5, CAB39, DDIT4L, RRAGD, CAB39L, PRKAB1, ULK2, PIK3CB, PRKAA2, RRAGB, PRKAB2, PDPK1, and TSC1, and one downregulated: DEPTOR) in the intersection of the two datasets (Fig. 3). The DEGs of everolimus and asiaticoside shared 15 similar GO terms and KEGG pathways, including macroautophagy, protein phosphorylation, cell cycle arrest, protein binding, ATP-binding, AMP-activated protein kinase activity, protein serine/threonine kinase activity, cytoplasm, EGO complex, cytosol, FoxO signaling pathway, insulin signaling pathway, AMPK signaling pathway, mTOR pathway signaling, and PI3K-Akt signaling pathway, according to functional and pathway enrichment analysis of DEGs (Table 1).
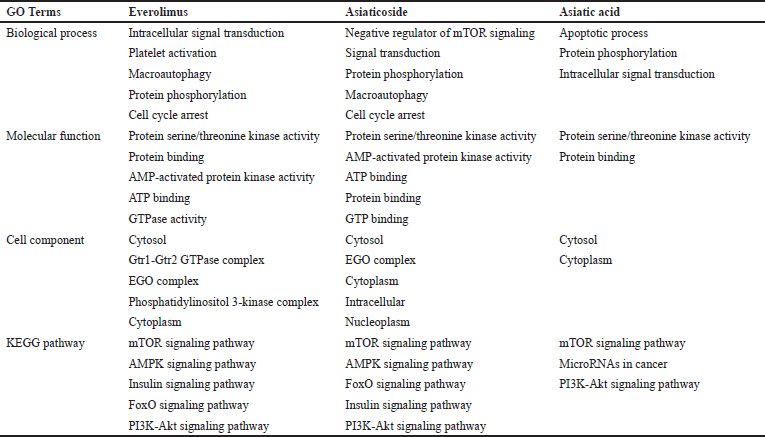 | Table 1. Summary of functional analyses and KEGG pathway of DEGs treated everolimus, asiaticoside, and asiatic acid. [Click here to view] |
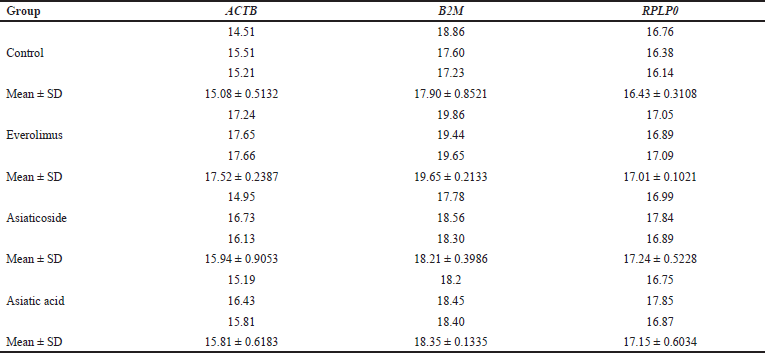 | Table 2. Ct values for three RGs were obtained from validation experiments in both the treated and control groups. [Click here to view] |
Compared to asiaticoside, seven DEGs (five upregulated: PRKCE, RRAGC, RPS6KA5, CAB39, and VEGFA, and two downregulated: DEPTOR and IGFBP3) following asiatic acid treatment as shown by the intersection of the two datasets in the Venn diagram (Fig. 4). The DEGs of everolimus and asiatic acid shared eight similar GO terms and KEGG pathways, which include protein phosphorylation, intracellular signal transduction, protein binding, protein serine/threonine kinase activity, cytoplasm, cytosol, mTOR signaling pathway, and PI3K-Akt signaling pathway (Table 1).
In Figure 5, a Venn diagram illustrates the overlap of five DEGs (four upregulated: CAB39, PRKCE, RRAGC, and RPS6KA5, and one downregulated: DEPTOR) in the three datasets, which were validated by RT-qPCR. Further analysis using GO terms and KEGG pathways revealed that everolimus, asiaticoside, and asiatic acid shared seven similar pathways, including protein phosphorylation, protein binding, protein serine/threonine kinase activity, cytoplasm, cytosol, mTOR signaling pathway, and PI3K-Akt signaling pathway (Table 1). Based on these results, it can be hypothesized that both asiaticoside and asiatic acid have functions similar to everolimus, with asiaticoside being more closely related to everolimus than asiatic acid.
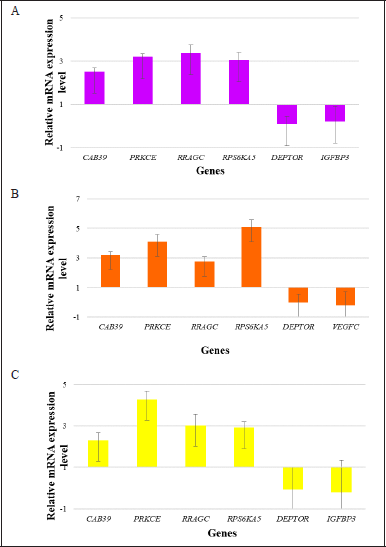 | Figure 6. In (A) everolimus, (B) asiaticoside, and (C) asiatic acid group, CAB39, PRKCE, RRAGC, and RPS6KA5 showed upregulation of relative mRNA expression levels while DEPTOR and IGFBP3 showed downregulation of relative mRNA expression levels. The experiments were repeated three times. The error bars represent the standard deviation. [Click here to view] |
Our findings indicate that asiaticoside shares a mechanism of action toward the mTOR pathway that is 60.7% similar to everolimus, as evidenced by 16 common DEGs out of 84 genes. Both asiaticoside and everolimus upregulated 15 genes out of the 28 upregulated genes, and only one gene was downregulated by both substances out of the two that were downregulated. In addition, everolimus and asiatic acid have a mechanism of action toward the mTOR pathway that is 63.1% similar, as indicated by seven common DEGs out of 84 genes. These two substances upregulated five of the ten upregulated genes and two of the two downregulated genes.
Validation of RGs and DEGs by RT-qPCR
The validation of gene expression for chosen RGs and DEGs confirmed the consistency of their relative mRNA expression levels observed in the mTOR profiling. Table 2 presents the Ct values obtained from the validation experiments of ACTB, B2M, and RPLP0 for every control and treated group. Figure 6 depicts that the relative mRNA expression levels of all DEGs were consistent with the mTOR profiling findings.
DISCUSSION
In the present study, we identified significant DEGs between treated and untreated samples and conducted a series of bioinformatics analyses to screen key genes and pathways closely related to everolimus. By analysis of significant DEGs on mTOR profiling data, we identified five DEGs with a fold change of more than one for upregulated genes and a fold change of one or less for downregulated genes, respectively, including four upregulated DEGs and one down-regulated DEGs across all treated groups. These five shared significant DEGs show that these genes are engaged in a range of TSC-mTOR pathway-related biological processes.
CAB39, PRKCE, RRAGC, and RPS6KA5 were all highly elevated in all treated groups, according to bioinformatics analysis of DEGs, which included GO terms and KEGG pathway enrichment analysis. Across the treated groups, only DEPTOR was shown to be significantly downregulated. Furthermore, the validation analysis confirmed that the pattern of relative mRNA expression levels for all DEGs across groups was similar to the mTOR profiling procedure’s results of relative mRNA expression levels.
CAB39 encodes calcium-binding protein 39, a scaffold protein for LKB1 (liver kinase B1) and a master regulator factor upstream of the AMPK/mTOR pathway [20]. CAB39 is part of the heterotrimeric LKB1-STRADα-CAB39 complex [21]. It helps STRADα stay attached to LKB1 and moves the complex from the nucleus to the cytoplasm as well [22]. Most importantly, this trimeric complex blocked mTOR signaling by phosphorylating AMPK and the trimeric complex of TSC1-TSC2-TBC1D7 [23]. As a result, mTOR was unable to promote protein synthesis pathways via S6 kinase (S6K) and translation initiation factor 4E binding protein one activation (4EBP1). This led to a block of the mTOR oncogenic signaling, which mostly relied on S6K and active protein synthesis [24].
Protein kinase C epsilon type (PKCε) is encoded by PRKCE. It is overexpressed in a variety of cancer types, including non-small cell lung cancer cell lines (NSCLC) [25], a prostate cancer animal model [26], renal carcinoma cells [27], and bladder cancer [28]. In addition, PKCε is associated with several processes involved in cancer formation, including cell survival, proliferation, transformation, cytoskeletal reorganization, epithelial to mesenchymal transition (EMT), extracellular matrix (ECM) rearrangement, cell motility, stem cell properties, and treatment resistance [29]. According to this study, everolimus, asiaticoside, and asiatic acid treatments of the UMB1949 cell line resulted in the overexpression of PRKCE and PKCε. Regrettably, no study has demonstrated how overexpression of PRKCE inhibits mTOR. In 2006, Liu and colleagues published the first study demonstrating that overexpression of PKC acts as a negative regulator of Akt activation stimulated by granulocyte colony-stimulating factor (G-CSF) and that PKCε has a detrimental effect on cell proliferation and survival in response to G-CSF. However, the mechanism by which PKC inhibits Akt activation is unknown [30].
RRAGC encodes ras-related GTP binding C protein (RagC). RagC is a member of the Rag guanosine triphosphatases (GTPases) in addition to RagA, RagB, and RagD. Rag GTPases act as a mediator of amino acid-induced mTORC1 activation in the mTORC1 pathway [31]. Despite its four possible nucleotide-binding states, the Rag heterodimer is active for mTORC1 binding only when RagA or RagB is GTP-bound and RagC or RagD is GDP-bound [32]. This functional Rag heterodimer recruits mTORC1 to the lysosome, which contains Rheb. TSC complexes interact with Rag heterodimers and translocate to the lysosome, where they inhibit Rheb activity, thereby inhibiting mTORC [33].
RPS6KA5 encodes ribosomal protein S6K polypeptide 5 (RPS6KA5). RPS6KA5 is required for the integration of multiple extracellular signals necessary for the regulation of cell growth and death in response to cellular stress stimuli and growth factors [34–37]. RPS6KA5 has also been linked to cell proliferation and neoplasia in breast cancer, nasopharyngeal carcinoma, and skin cancer [34,36,37]. However, the role of RPS6KA5 in inhibiting the PI3K/mTOR pathway remains unknown and requires further investigation [38].
DEPTOR encodes for DEP-domain containing mTOR-interacting protein (DEPTOR). The protein is a member of the mTORC1 and mTORC2 complexes, as well as a naturally occurring mTOR inhibitor [39]. It binds to mTORC1 and mTORC2 via the PDZ domain, and several studies have shown that mTOR-DEPTOR interaction results in potent inhibition of both mTOR complexes’ activity. As a result, abnormal DEPTOR expression has been found in a variety of cancers, and an intriguing study discovered that DEPTOR is involved in human cancer cell proliferation, apoptosis, autophagy, and drug resistance [40]. DEPTOR’s biological role in tumorigenesis is still unknown because it can act as an oncogene or oncosuppressor depending on the type of tumor cell and the surrounding environment [41]. The DEPTOR was found to be overexpressed in the control group in this study, implying that the DEPTOR has oncogenic properties in the UMB1949 cell line. This finding was consistent with DEPTOR expression in multiple myeloma, chronic myeloid leukemia, liver cancer, and osteosarcoma [42–46]. Surprisingly, the results of this study also revealed that DEPTOR expression was downregulated following mTOR inhibitor treatment (everolimus, asiaticoside, and asiatic acid). As revealed by [47], the depletion of DEPTOR mRNA expression in cervical squamous cell carcinoma has contributed to the apoptotic decision, and we hypothesized that downregulation of DEPTOR expression in the UMB1949 cell line might contribute to the inhibition of TSC cell line growth via apoptosis. However, the role of DEPTOR in tumorigenesis and the progression of TSC is still unclear.
The study has several limitations: (i) it primarily relies on the UMB1949 cell line as a model, and its findings may not generalize to other cell lines or in vivo conditions; (ii) the functional roles and interactions of the identified DEGs remain incomplete, requiring further investigation; (iii) the study focuses on a limited set of DEGs, overlooking potential contributions from a broader genetic landscape in TSC-associated renal angiomyolipoma; (iv) the roles of PRKCE and RPS6KA5 in mTOR pathways are not fully elucidated, and the dual role of DEPTOR in tumorigenesis is poorly understood; (v) the clinical applicability and safety of asiaticoside and asiatic acid as mTOR inhibitors need validation through clinical studies; and (vi) long-term effects and potential side effects of the treatments are not addressed, necessitating further research to ensure the safety and efficacy of mTOR inhibitors in a clinical context.
CONCLUSION
Our study has identified CAB39, PRKCE, RRAGC, RPS6KA5, and DEPTOR as significant DEGs with roles in mTOR pathway-mediated cell inhibition and highlighted the mTOR inhibitory potential of asiaticoside and asiatic acid in the context of TSC-associated renal angiomyolipoma. These findings provide a crucial foundation for future research, with a promising outlook. The next steps should involve in-depth investigations into the precise functions and interactions of these DEGs, shedding more light on their contributions to TSC pathophysiology and mTOR inhibition. In addition, the exploration of RGs for RT-qPCR normalization enhances research methodology. Clinical trials and translational studies are needed to validate the efficacy and safety of asiaticoside and asiatic acid, potentially expanding treatment options for TSC patients. Furthermore, long-term and side-effect assessments are vital, considering patient quality of life. This holistic approach aims to advance the field and improve the care of those with TSC in the future.
AUTHOR CONTRIBUTIONS
N.N.Z. contributed to laboratory experiments; N.N.Z., R.Z., T.H.S., H.A.W., and N.A.A contributed to preparing the manuscript; R.Z., I.L., T.H.S., and H.A.W. supervised the laboratory work and reviewed the manuscript. All authors have read and agreed to the published version of the manuscript
FINANCIAL SUPPORT
This research is funded by the Universiti Sains Malaysia Research University Grant (Grant Numbers 1001/PPSP/812137).
CONFLICTS OF INTEREST
The authors report no financial or any other conflicts of interest in this work.
ETHICAL APPROVALS
This study does not involve experiments on animals or human subjects.
DATA AVAILABILITY
All the data is available with the authors and shall be provided upon request.
PUBLISHER’S NOTE
This journal remains neutral with regard to jurisdictional claims in published institutional affiliation.
APPENDIX A. SUPPLEMENTARY DATA
Table S1: The Ct values of each proposed RGs for specific groups, Table S2: The average value of geometric mean for each group based on the Ct values of three RGs and Figure S1: The melting curves of RGs and DEGs, respectively, and their specific melting temperatures.
REFERENCES
1. Northrup H, Aronow ME, Bebin EM, Bissler J, Darling TN, de Vries PJ, et al. Updated international tuberous sclerosis complex diagnostic criteria and surveillance and management recommendations. Pediatr Neurol. 2021;123:50–66. CrossRef
2. Bausch K, Wetterauer C, Diethelm J, Ebbing J, Boll DT, Dill P, et al. Enhancing disease awareness for tuberous sclerosis complex in patients with radiologic diagnosis of renal angiomyolipoma: an observational study. BMC Nephrol. 2021;22(1):1–6. CrossRef
3. Bissler JJ, Kingswood JC, Radzikowska E, Zonnenberg BA, Frost M, Belousova E, et al. Everolimus for angiomyolipoma associated with tuberous sclerosis complex or sporadic lymphangioleiomyomatosis (EXIST-2): a multicentre, randomised, double-blind, placebo-controlled trial. Lancet. 2013;381(9869):817–24. CrossRef
4. Amin S, Kingswood JC, Bolton PF, Elmslie F, Gale DP, Harland C, et al. The UK guidelines for management and surveillance of tuberous sclerosis complex. QJM: Int J Med. 2019;112(3):171–82. CrossRef
5. Chung NK, Metherall P, McCormick JA, Simms RJ, Ong AC. Individualized everolimus treatment for tuberous sclerosis-related angiomyolipoma promotes treatment adherence and response. Clin Kidney J. 2022;15(6):1160–8. CrossRef
6. Hatano T, Chikaraishi K, Inaba H, Endo K, Egawa S. Outcomes of everolimus treatment for renal angiomyolipoma associated with tuberous sclerosis complex: a single institution experience in Japan. Int J Urol. 2016;23(10):833–8. CrossRef
7. Siroky BJ, Yin H, Babcock JT, Lu L, Hellmann AR, Dixon BP, et al. Human TSC-associated renal angiomyolipoma cells are hypersensitive to ER stress. Am J Physiol-Renal Physiol, 2012;303(6):F831–44. CrossRef
8. Trelinska J, Dachowska I, Kotulska K, Fendler W, Jozwiak S, Mlynarski W. Complications of mammalian target of rapamycin inhibitor anticancer treatment among patients with tuberous sclerosis complex are common and occasionally life-threatening. Anti-cancer Drugs, 2015;26(4):437–42. CrossRef
9. Sadowski K, Kotulska K, Jó?wiak S. Management of side effects of mTOR inhibitors in tuberous sclerosis patients. Pharmacol Rep. 2016;68:536–42. CrossRef
10. Huyghe E, Zairi A, Nohra J, Kamar N, Plante P, Rostaing L. Gonadal impact of target of rapamycin inhibitors (sirolimus and everolimus) in male patients: an overview. Transpl Int, 2007;20(4):305–11. CrossRef
11. Dabydeen DA, Jagannathan JP, Ramaiya N, Krajewski K, Schutz FA, Cho DC, et al. Pneumonitis associated with mTOR inhibitors therapy in patients with metastatic renal cell carcinoma: incidence, radiographic findings and correlation with clinical outcome. Eur J of Cancer, 2012;48(10):1519–24. CrossRef
12. Davies M, Saxena A, Kingswood JC. Management of everolimus-associated adverse events in patients with tuberous sclerosis complex: a practical guide. Orphanet J Rare Dis. 2017;12(1):1–4. CrossRef
13. Zulkipli NN, Zakaria R, Long I, Abdullah SF, Muhammad EF, Wahab HA, et al. In silico analyses and cytotoxicity study of asiaticoside and asiatic acid from malaysian plant as potential mTOR inhibitors. Molecules. 2020;25(17):3991. CrossRef
14. Huang DW, Sherman BT, Lempicki RA. Systematic and integrative analysis of large gene lists using DAVID bioinformatics resources. Nat Protoc. 2009;4(1):44–57. CrossRef
15. Kanehisa M, Araki M, Goto S, Hattori M, Hirakawa M, Itoh M, et al. KEGG for linking genomes to life and the environment. Nucleic Acids Res. 2007;36(suppl_1):D480–4. CrossRef
16. Zhou C, Teng WJ, Zhuang J, Liu HL, Tang SF, Cao XJ, et al. Analysis of the gene-protein interaction network in glioma. Genet Mol Res. 2015;14(4):14196–206. CrossRef
17. Liu Z, Meng J, Li X, Zhu F, Liu T, Wu G, et al. Identification of hub genes and key pathways associated with two subtypes of diffuse large B-cell lymphoma based on gene expression profiling via integrated bioinformatics. BioMed Res Int. 2018;2018:3574534. CrossRef
18. Tang F, He Z, Lei H, Chen Y, Lu Z, Zeng G, et al. Identification of differentially expressed genes and biological pathways in bladder cancer. Mol. Med. Rep. 2018;17(5):6425–34. CrossRef
19. Chen B, Zheng Y, Liang Y. Analysis of potential genes and pathways involved in the pathogenesis of acne by bioinformatics. BioMed Res Int. 2019;2019:3739086. CrossRef
20. Shackelford DB, Shaw RJ. The LKB1–AMPK pathway: metabolism and growth control in tumour suppression. Nat Rev Cancer. 2009;9(8):563–75. CrossRef
21. Nguyen K, Hebert K, McConnell E, Cullen N, Cheng T, Awoyode S, et al. LKB1 signaling and patient survival outcomes in hepatocellular carcinoma. Pharmacol Res. 2023;192:106757. CrossRef
22. Baas AF, Boudeau J, Sapkota GP, Smit L, Medema R, Morrice NA, et al. Activation of the tumour suppressor kinase LKB1 by the STE20-like pseudokinase STRAD. EMBO J. 2003;22(12):3062–72. CrossRef
23. Rehbein U, Prentzell MT, Cadena Sandoval M, Heberle AM, Henske EP, Opitz CA, et al. The TSC complex-mTORC1 axis: from lysosomes to stress granules and back. Front Cell Dev Biol. 2021;9:751892. CrossRef
24. Yang M, Lu Y, Piao W, Jin H. The translational regulation in mTOR pathway. Biomolecules. 2022;12(6):802. CrossRef
25. Sadeghi MM, Salama MF, Hannun YA. Protein kinase C as a therapeutic target in non-small cell lung cancer. Int J Mole Sci. 2021;22(11):5527. CrossRef
26. Lai X, Liang Y, Jin J, Zhang H, Wu Z, Li G, et al. Protein kinase C epsilon promotes de novo lipogenesis and tumor growth in prostate cancer cells by regulating the phosphorylation and nuclear translocation of pyruvate kinase isoform M2. Exp Cell Res. 2023;422(1):113427. CrossRef
27. Huang B, Fu SJ, Fan WZ, Wang ZH, Chen ZB, Guo SJ, et al. PKCε inhibits isolation and stemness of side population cells via the suppression of ABCB1 transporter and PI3K/Akt, MAPK/ERK signaling in renal cell carcinoma cell line 769P. Cancer Lett. 2016;376(1):148–54. CrossRef
28. Kawano T, Inokuchi J, Eto M, Murata M, Kang JH. Protein Kinase C (PKC) Isozymes as diagnostic and prognostic biomarkers and therapeutic targets for cancer. Cancers, 2022;14(21):5425. CrossRef
29. Rahimova N, Cooke M, Zhang S, Baker MJ, Kazanietz MG. The PKC universe keeps expanding: from cancer initiation to metastasis. Adv Biol Regul. 2020;78:100755. CrossRef
30. Liu H, Qiu Y, Xiao L, Dong F. Involvement of protein kinase Cε in the negative regulation of Akt activation stimulated by granulocyte colony-stimulating factor. J Immunol. 2006;176(4):2407–13. CrossRef
31. Takahara T, Amemiya Y, Sugiyama R, Maki M, Shibata H. Amino acid-dependent control of mTORC1 signaling: a variety of regulatory modes. J Biomed Sci. 2020;27:1–6. CrossRef
32. Shen K, Sabatini DM. Ragulator and SLC38A9 activate the Rag GTPases through noncanonical GEF mechanisms. Proc Natl Acad Sci, 2018;115(38):9545–50. CrossRef
33. Cargnello M, Tcherkezian J, Roux PP. The expanding role of mTOR in cancer cell growth and proliferation. Mutagenesis, 2015;30(2):169–76. CrossRef
34. Pérez-Cadahía B, Drobic B, Espino PS, He S, Mandal S, Healy S, et al. Role of MSK1 in the malignant phenotype of Ras-transformed mouse fibroblasts. J Biol Chem. 2011;286(1):42–9. CrossRef
35. van der Heide LP, van Dinther M, Moustakas A, ten Dijke P. TGFβ activates mitogen-and stress-activated protein kinase-1 (MSK1) to attenuate cell death. J Biol Chem. 2011;286(7):5003–11. CrossRef
36. Reyes D, Ballaré C, Castellano G, Soronellas D, Bagó JR, Blanco J, et al. Activation of mitogen-and stress-activated kinase 1 is required for proliferation of breast cancer cells in response to estrogens or progestins. Oncogene. 2014;33(12):1570–80. CrossRef
37. Li B, Wan Z, Huang G, Huang Z, Zhang X, Liao D, et al. Mitogen-and stress-activated Kinase 1 mediates Epstein-Barr virus latent membrane protein 1-promoted cell transformation in nasopharyngeal carcinoma through its induction of Fra-1 and c-Jun genes. BMC Cancer. 2015;15(1):1–3. CrossRef
38. Wu S, Wang S, Zheng S, Verhaak R, Koul D, Yung WA. MSK1-mediated β-catenin phosphorylation confers resistance to PI3K/mTOR inhibitors in glioblastoma. Mol Cancer Ther. 2016;15(7):1656–68. CrossRef
39. Wälchli M, Berneiser K, Mangia F, Imseng S, Craigie LM, Stuttfeld E, et al. Regulation of human mTOR complexes by DEPTOR. elife, 2021;10:e70871. CrossRef
40. Wang Z, Zhong J, Inuzuka H, Gao D, Shaik S, Sarkar FH, et al. An evolving role for DEPTOR in tumor development and progression. Neoplasia. 2012;14(5):368–75. CrossRef
41. Catena V, Fanciulli M. Deptor: not only a mTOR inhibitor. J Exp Clin Cancer Res. 2017;36:1–9. CrossRef
42. Peterson TR, Laplante M, Thoreen CC, Sancak Y, Kang SA, Kuehl WM, et al. DEPTOR is an mTOR inhibitor frequently overexpressed in multiple myeloma cells and required for their survival. Cell. 2009;137(5):873–86. CrossRef
43. Luo Z, Yu G, Lee HW, Li L, Wang L, Yang D, et al. The Nedd8-activating enzyme inhibitor MLN4924 induces autophagy and apoptosis to suppress liver cancer cell growth. Cancer research, 2012;72(13):3360–71. CrossRef
44. Catena V, Bruno T, De Nicola F, Goeman F, Pallocca M, Iezzi S, et al. Deptor transcriptionally regulates endoplasmic reticulum homeostasis in multiple myeloma cells. Oncotarget, 2016;7(43):70546. CrossRef
45. Hu B, Lv X, Gao F, Chen S, Wang S, Qing X, et al. Downregulation of DEPTOR inhibits the proliferation, migration, and survival of osteosarcoma through PI3K/Akt/mTOR pathway. OncoTargets and therapy, 2017:4379–91. CrossRef
46. Morales-Martinez M, Lichtenstein A, Vega MI. Function of deptor and its roles in hematological malignancies. Aging (Albany NY), 2021;13(1):1528. CrossRef
47. Srinivas KP, Viji R, Dan VM, Sajitha IS, Prakash R, Rahul PV, et al. DEPTOR promotes survival of cervical squamous cell carcinoma cells and its silencing induces apoptosis through downregulating PI3K/AKT and by up-regulating p38 MAP kinase. Oncotarget, 2016;7(17):24154. CrossRef
SUPPLEMENTARY MATERIAL
Supplementary data can be downloaded from the journal’s website [https://japsonline.com/admin/php/uploadss/4229_pdf.pdf]