INTRODUCTION
Graptophyllum pictum (L.) Griff, often referred to as purple leaf, is a herbaceous plant from the Acanthus family, often used in traditional medicine to relieve menstrual pain, stomach pain, and ulcers [1]. This plant is endemic to Papua New Guinea and is spread across the equator, such as Asia (especially Indonesia), India, Africa, and Latin America [2]. Many studies state that G. pictum has various pharmacological activities, such as free radical scavenging capacity, anti-inflammatory, anti-hemorrhoidal, and anti-inflammatory [2,3]. On the other hand, G. pictum contains phenolic and flavonoid phytochemical compounds that have anti-inflammatory activity by reducing free radicals and inhibiting enzymes that play a role in inflammatory processes, such as cyclooxygenase-2 and inducible nitric oxide synthase [4]. In addition, other studies also mention that G. pictum contains steroid class metabolites, terpenoids, alkaloids, tannins, and volatile compounds that play a role in the treatment of infections [5,6]. The compounds contained can be extracted through an extraction process. Extraction separates certain compounds or active substances from a solid or liquid mixture using a particular solvent [7]. Solvents with varying polarities can be used in extracting various classes of compounds with different polarities. Huliselan [8] reported that the type of solvent is one of the factors that can affect the content of extracted compounds. Besides that, the bioactive components in a sample will move to the solvent with intensive contact. Polyphenolic compounds (phenolics and flavonoids) are polar compounds that tend to dissolve in polar solvents such as water, ethanol, methanol, and ethyl acetate. On the other hand, steroid and terpenoid compounds tend to dissolve in nonpolar solvents such as n-hexane.
Many studies on the bioactivity of purple plants have been carried out. The study in Masyita et al. [9] reported that wungu leaves have the potential for sun protection, and that in Kusumaningsih et al. [7] also reported that purple leaves extracted using 70% ethanol had better antibacterial activity than 96% ethanol. In addition, the optimization of purple leaf extract for flavonoid content and antioxidant activity using the simplex centroid design has also been reported [2]. However, metabolomics studies using liquid chromatography with tandem mass spectrometry (LC-MS/MS) in the comprehensive analysis of secondary metabolites of G. pictum in various solvents on antioxidant activity [2,2-diphenyl-1-picrylhydrazyl (DPPH), 2,2’-azino-bis (3-ethylbenzthiazoline-6-sulfonic acid) (ABTS), ferric reducing antioxidant power (FRAP), and cupric reducing antioxidant capacity (CUPRAC)] in G. pictum extracts have been little reported. Therefore, this study used chemometric analysis in the form of Pearson correlation, hierarchical clustering (HCA), and principle component analysis (PCA) to evaluate metabolic data from LC-MS/MS results on the antioxidant capacity of purple plants. In addition, this study also aims to determine the most optimal type of solvent in purple plant extracts with total phenolic (TPC) and flavonoid content (TFC) and antioxidant activity (DPPH, ABTS, FRAP, and CUPRAC) with the highest values.
MATERIALS AND METHODS
Chemicals and reagents
All extraction solvents in the form of ethanol, ethyl acetate, and n-hexane using analytical grade were purchased from MERCK (Germany); Folin-Ciocalteu phenol reagent, Na2CO3, AlCl3, methanol, ABTS, K2S2O8, hydrogen chloride (HCl), CuCl2, and buffer ammonium acetate (pH 7.0) were purchased from MERCK (Germany); glacial acetic acid and DPPH powder were purchased from Sigma-Aldrich (St. Louis, MO); FeCl3, 2,4,6-tripyridin-s-triazine (TPTZ), and 2,9-dimethyl-1,10-phenanthroline (neocuproine) were purchased from Sisco Research Laboratories Pvt. Ltd. (India); buffer acetate (pH 3.6) was purchased from Mallinckrodt plc (Cruiserath, Blanchardstown, Dublin 15, Ireland); gallic acid (98.0%) and quercetin standard (99.0%) were purchased from Sisco Research Laboratories Pvt. Ltd. (India); and 6-hydroxy-2,5,7,8-tetramethyl-3,4-dihydrochromene-2-carboxylic acid (Trolox) standard and Aquabidest were purchased from MERCK (Germany).
Plant Simplicia preparation and extraction
Samples came from the collection of the Tropical Biopharmaca Research Center, Bogor Agricultural University, West Java, Indonesia (6°32′25.47″ N, 106°42′53.22″ E, 142.60 m above sea level), and were authenticated at the same place through the brochure number BMK0164092016. Graptophyllum pictum is a shrub with a height of 1–2 m, has characteristic green elliptical leaves with reddish-purple spots, herbaceous-type stems with purplish-red coloring and four-cornered branches. Sample preparation based on Nurcholis et al. [10] was performed as follows: first, samples were dried using an oven at 45°C for 2 days and pulverized to obtain Simplicia powder (80 mesh). Extraction G. pictum using the maceration method with ethanol, ethyl acetate, and n-hexane solvents, using a randomized complete block design with three replications for each solvent treatment. Maceration was carried out by dissolving 25 g of powdered Simplicia in 250 ml of solvent [1: 10 (m/v)], followed by a sonication process using a sonicator (Decon, Hove, Sussex, UK) for 30 minutes, and a maceration process was carried out for 24 hours at a speed of 150 rpm using a water bath shaker (Wisebath SSB, South Korea). The extract was filtered using Whatman No. 4 filter paper and vacuum. The filtrate was concentrated using a rotary evaporator (LabTech, Germany) with a temperature of 45°C and a rotational speed of 35 rpm. Stock solutions were prepared at a concentration of 2,000 ppm (20 mg paste extract in 10 ml ethanol).
Determination of total polyphenol content
TPC measurements
The TPC was determined [11] using the Folin-Ciocalteu reaction reagent and standard gallic acid. Preparation of phenolic test using Foline reagent 10% (v/v) was prepared by dissolving 5 ml of 100% folin solution in 50 ml of distilled water; 10% (m/v) Na2CO3 was prepared by dissolving 5 g of Na2CO3 in 50 ml of distilled water. The gallic acid standard was prepared by dissolving 0.02 g of gallic acid in 20 ml of pro-analytical ethanol, so a concentration of 1,000 ppm was obtained. The curve is made by varying the concentration of gallic acid in the range of 20–300 ppm. The TPC test was carried out by reacting 20 μl of the sample or standard gallic acid with 120 μl of 10% Folin-Ciocateu reagent and then incubating for 5 minutes; after incubation, 80 μl of Na was added with Na2CO3 10% and then incubated for 30 minutes. Absorbance was read at a wavelength of 750 nm by nano spectrophotometry (SPECTROstar Nano BMG LABTECH). TPC is calculated based on gallic acid equivalent (GAE) concentration parameters is shown using the following equation:
TFC measurements
The method for determining the TFC based on Khumaida et al. [11] used aluminum chloride reagent and quercetin standards. Preparation of 10% (m/v) AlCl3 reagent was prepared by dissolving 5 g of AlCl3 into 50 ml of distilled water. Quercetin standard solution was prepared by dissolving 0.02 g of quercetin in 20 ml of ethanol to obtain a concentration of 1,000 ppm. The curve was made by varying the concentration of quercetin in the range of 25–500 ppm. The total content of flavonoids (TFC) was determined by adding 120 μl of distilled water with 10 μl of sample or quercetin standard and 10 μl of AlCl3 10%, 10 μl glacial acetic acid, and 50 μl ethanol pro-analyzed, then incubated for 30 minutes. The absorbance was read at a wavelength of 415 nm using nanospectrophotometry (SPECTROstar Nano BMG LABTECH). TFC is calculated based on quercetin equivalent (QE) concentration parameters using the following equation:
Determination of antioxidant capacity
The antioxidant capacity of the samples was measured by nanospectrophotometer-based calorimetry (SPECTROstar Nano BMG LABTECH) using DPPH, ABTS, FRAP, and CUPRAC methods with trolox equivalent antioxidant capacity (TEAC) based on modification [9,11]. Antioxidant capacity is calculated based on TEAC concentration parameters using the following equation:
DPPH scavenging capacity method
The solution of DPPH radicals was prepared by mixing 2.5 mg of DPPH powder in 50 ml of methanol to obtain a final volume of 1.25 μM. Trolox standards were made in various concentrations of 20–90 μM. The test was carried out by adding 100 μl of sample or trolox standard and 100 μl of DPPH reagent (1.25 μM), then incubated for 30 minutes, and the absorbance was measured at a wavelength of 515 nm.
ABTS scavenging capacity method
The solution of ABTS radicals was prepared by mixing ABTS stock solution (7.7 mM) and potassium persulfate (2.4 mM) in a ratio of 2:1 (v/v). Dilution was carried out by adding Aqua Bidest to obtain an absorbance of 0.7 ± 0.2 at a wavelength of 734 nm. Trolox standards were made with various concentrations of 100–500 μM. The test was carried out by adding 20 µl of the sample or trolox standard and 180 µl of ABTS reagent and then incubating it for 6 minutes. Absorbance was measured at a wavelength of 734 nm.
FRAP method
The ferric-reducing antioxidant assay reagent was carried out by mixing acetate buffer pH 3.6, TPTZ, and ferric chloride, with a ratio of 10:1:1 (v/v). The mixture was then incubated for 30 minutes. Trolox standards were made with various concentrations of 100–600 μM. The test was carried out by adding 180 μl of FRAP reagent with ten μl of sample or trolox standard and then incubating it for 30 minutes. Absorbance was measured at a wavelength of 593 nm.
CUPRAC method
The cupric reducing antioxidant assay reagent was carried out by preparing a solution of neocuproine (0.0075 M) in distilled water, copper sulfate (CuCl2) (0.01 M) in distilled water, and ammonium acetate buffer (pH 7). Trolox standards were made with various concentrations of 100–500 μM. The test was carried out by adding 50 μl of the sample or trolox standard, 50 μl of CuCl2 solution (0.01M), 50 μl 2,9-dimethyl-1,10-phenanthroline (neocuproine) reagent (0.0075 M), and 50 μl ammonium acetate buffer solution (pH 7.0). Absorbance was measured at a wavelength of 450 nm.
Liquid chromatography with tandem mass spectrometry
Analysis of secondary metabolites is based on Li et al. [12]. A total of 10 mg of the sample was dissolved in 5 ml of methanol and homogenized using an ultrasonicator for 30 minutes. The sample solution was then filtered using a 0.2 µm PTFE membrane. A total of 2.0 µl of the sample was then injected into the LC-MS/MS using a syringe. The eluent in the mobile phase [H2O + 0.1% formic acid (A) and 0.1% formic acid (B)] with a flow rate of 0.2 ml/minute, using the gradient method 0–1 minute (5% B), 1–25 minutes (5%–95% B), 25–28 minutes (95% B), and 28–30 minutes (5% B). The stationary phase consisted of accucore C18, 100 × 2.1 mm, 1.5 µm (ThermoScientific) at 30°C. The tool is set to detect a mass size of 100–1,500 m/z with the positive (+) ionization method. The LC-MS/MS analysis data were then processed using Compound Discoverer 3.2 software and matched to the output spectra of MS1 and MS2 using various online databases (mzCloud, ChemSpider, and PubChem) to obtain predictions of the chemical structure of the metabolites.
Statistical analysis
Data on polyphenol content and antioxidant capacity were expressed as three replicates’ mean ± standard error (SE). Analysis of variance and Tukey’s follow-up test were conducted using SPSS version 25. Pearson correlation analysis between polyphenol and pharmacological parameters was generated using the performance analytics package in R-Studio version 4.2.2 [13]. Characterization of secondary metabolites G. pictum based on differences in solvents was carried out using various chemometric approaches such as HCA and PCA [13–15]. PCA analysis was performed using MetaboAnalyst 5.0. Data preparation begins by creating a data frame consisting of the secondary metabolite area as a result of the chromatogram and the antioxidant capacity of each sample, and then by normalizing the data using logarithmic transformation and auto-scaling of the data. Then, hierarchical clustering features were selected in the clustering analysis option, and PCA features were selected in the chemometric analysis option.
RESULTS AND DISCUSSION
Extraction yield
The results showed that the ethanol solvent produced the highest total yield of 19.62% compared to the hexane solvent at 15.54% and ethyl acetate at 16.29% (Table 1); however, the obtained percent yield did not show a significant difference from each other at p <0.05. This research was in line with Jiangseubchatveera et al. [16], which states that the extraction is influenced by the type of solvent used.
Total polyphenol content
The polyphenol content of G. pictum is shown in Table 2. Extracts with polar solvents, such as ethanol, have the highest TPC compared to other solvents. Furthermore, TPC has a higher value when compared to TFC in all solvent treatments. Phenolics are compounds containing hydroxyl groups and double rings in the benzene structure that undergo resonance stabilization, stabilizing the radical state in reactions with free radicals [17]. It has various pharmacological activities, such as antioxidant, anti-inflammatory, and preventing degenerative diseases [18,19]. Phenolics are one of the polyphenol group compounds that are very abundant in nature and have a variety of structures. Quantifying TPC using the Folin-Ciocalteu reagent and GAE as a standard can determine the TPC of herbal sample 2. In this study, the highest yield was 32.17 mg GAE g−1 in ethanol solvent, and the lowest yield was 1.87 mg GAE g−1 in n-hexane solvent. The difference in TPC in each sample is due to the difference in polarity of the extraction solvent, so metabolites with the same degree of polarity as the solvent can be easily extracted. This research lines with Mohammed et al. [20], where TPC tends to have a high value in organic polar solvents such as ethanol and methanol. Various studies have reported that using polar solvents to extract G. pictum produces a higher yield of polyphenolic compounds [16]. The highest TPC of G. pictum was 102.5 mg GAE g−1 in the ethyl acetate fraction, and the lowest TPC was 11.7 mg GAE g−1 in the n-hexane fraction.
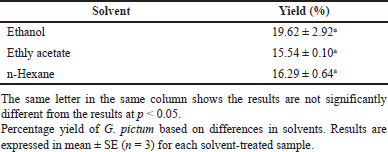 | Table 1. Percentage yield of G. pictum extract. [Click here to view] |
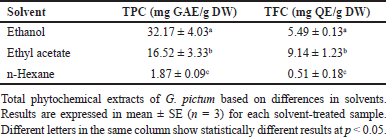 | Table 2. Total phytochemical content of G. pictum extracts based on various solvents. [Click here to view] |
The highest TFC was found in extracts with semipolar solvents such as ethyl acetate. Extracts in nonpolar solvents such as n-hexane showed the lowest results for phenolic and flavonoid content. Flavonoids are a group of polyphenols that are very abundant in nature. In addition, the same phenolic group of flavonoids has various pharmacological activities, such as antioxidants, and in preventing degenerative diseases [21,22]. Flavonoid activity in scavenging free radicals involves hydroxyl groups at numbers 3, 5, 3’, and 4’, covering various electron and proton transfer reactions [23]. Quantification of TFC of leaves G. pictum was the highest at 9.14 mg QE g−1 DW in ethyl acetate solvent, and the lowest was 0.51 mg QE g−1 DW in n-hexane solvent. Flavonoids tend to have a broad solubility in various solvents, and this is due to the varied structure of the flavonoids. The study in Makkiyah et al. [2] reported that extraction using aqueous solvents increased TFC by 10.46 mg QE g−1. On the other hand, the research in Jiangseubchatveera et al. [16] reported the highest TFC of 28.21 mg QE g−1 in the n-hexane fraction and the lowest TFC of 2.02 mg QE g−1 in the water fraction.
Antioxidant capacity
The antioxidant capacity of the TEAC G. pictum method is shown in Table 3. Extracts with polar solvents, such as ethanol, showed the highest antioxidant capacity results in all TEAC tests, followed by ethyl acetate and n-hexane extracts, and this is in line with Makkiyah et al. [2], which stated that polar solvents such as water in G. pictum extract showed optimum antioxidant capacity results. This study used in vitro antioxidant screening approaches such as DPPH, ABTS, FRAP, and CUPRAC in Trolox equivalents. This approach was intended because each antioxidant assay has advantages and limitations [24–26]. Analysis of the free radical scavenging capacity of samples using two radical-based methods such as 2,2-di(4-tert-octylphenyl)-1-picrylhydrazyl radical (DPPH·) and 2,2′-azino-bis(3-ethylbenzothiazoline-6-sulfonic acid radical cation (ABTS+·). In addition, the reduction capacity of ferric metal (Fe3+) to ferrous (Fe2+) is also used in the FRAP assay. The reduction of cupric ion metal (Cu2+) to cuprous (Cu+) in the CUPRAC assay [16] indicated that G. pictum had the highest DPPH absorption capacity of 0.78 (IC50, mg ml−1) and ABTS absorption capacity of 69.19 mg TE g−1 DW; in Makkiyah et al. [2], the best DPPH capacity was found in water solvent of 2.21 µmol TE g−1 DW and the best FRAP capacity was found in acetone solvent of 27.60 µmol TE g−1 DW.
 | Table 3. TEAC of G. pictum extracts based on various solvents. [Click here to view] |
Correlation of polyphenol content and antioxidant capacity
The Pearson correlation between total phytochemical content and antioxidant capacity is shown in Figure 1. TPC correlates very strongly with DPPH capacity and strongly correlates with FRAP, CUPRAC, and ABTS, in line with the research of Indradi et al. [27]. Meanwhile, TFC has a strong correlation with CUPRAC, a moderate correlation with DPPH, and a weak correlation with FRAP and ABTS, in line with that reported by Insanu et al. [28]. However, TPC and TFC are moderately correlated but not significantly, in line with Batubara et al. [13]. In addition, the correlation of all antioxidant capacity tests shows a good correlation. Phenolics have a reasonable correlation with all antioxidant assays compared to flavonoids because phenolic compounds tend to have a simple structure that minimizes steric hindrance [29]. Furthermore, differences in metabolite polarity and redox potential between phenolic compounds and flavonoids also affect the results of each antioxidant assay [24,26].
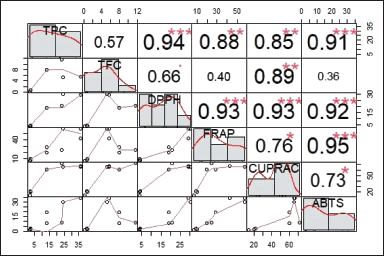 | Figure 1. Diagonal matrix of correlation of total polyphenol (TPC and TFC) content and antioxidant capacity (DPPH, ABTS, FRAP, and CUPRAC) of various solvent treatments G. pictum. The upper diagonal shows the Pearson correlation coefficient, while the lower diagonal shows the scorpion. *, **, *** indicated significance at the level of p < 0.05, <0.01 and 0.001. [Click here to view] |
Metabolite composition
Secondary metabolite fingerprinting analysis using LC-MS/MS based on the elucidation of chemical components on liquid chromatography and combined with mass spectrophotometry. This research is based on an untargeted metabolomics line with Lee et al. [30], which compares all identified metabolites at different extraction solvents G. pictum. All sample LC-MS/MS analysis data were chromatograms in the positive (+) ionization treatment based on the treatment of the three solvents (ethyl acetate, ethanol, n-hexane) (Fig. 2). Differences in spectral patterns on each solvent’s chromatogram indicated differences in each extract’s secondary metabolites.
Secondary metabolite analysis G. pictum using LC-MS/MS based on differences in the polarity of solvents (ethanol, ethyl acetate, n-hexane). Metabolic compounds were identified based on parameters such as molecular weight, the chemical formula of the compound, retention time, and area. In total, 138 active secondary metabolites were found in the ethanol extract, 88 compounds in the ethyl acetate extract, and 67 compounds in the n-hexane extract. The profiling process was carried out to separate the secondary metabolites from the impurities, in addition to determining the chemical structure of the metabolites using the PubChem, ChemSpider, and mzCloud databases to obtain 27 active secondary metabolites in all 3 types of solvents. Twenty-seven selected compounds were divided into several groups (Table 4), namely, phenolics (5), flavonoids (3), terpenoids (3), carotenoids (1), alkaloids (1), fatty acids and their derivatives (8), amino (5), and indole (1).
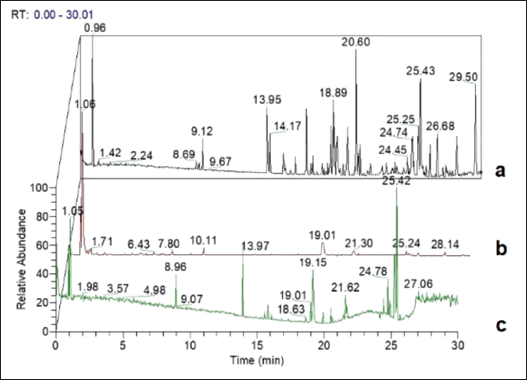 | Figure 2. Chromatogram fingerprints: (a) ethyl acetate, (b) ethanol, and (c) n-hexane. [Click here to view] |
Characteristics of metabolites, total polyphenol content, and antioxidant capacity of herbal plant samples are influenced by factors such as the extraction method and the type of solvent used [31]. This research uses G. pictum as one of the traditional medicinal plants that are empirically and experimentally helpful in treating various diseases ranging from infectious to degenerative [2,32–34]. In addition, this research was conducted to investigate the type of solvent based on polarity on the characteristics of secondary metabolites, total polyphenol, and antioxidant capacity so that it can become a reference in the development of standardized and validated herbal products.
Multivariate analysis
This study used multivariate analysis (HCA and PCA) to process quantitative data for various analyses (total polyphenol, antioxidant capacity, secondary metabolites) of the samples G. pictum. The chromatograms of which the compounds had been identified were subjected to PCA and HCA chemometric analysis. HCA was carried out to see the intensity level of the compound based on different solvents. The HCA analysis is shown on the heatmap (Fig. 3a); there are 25 compounds that are the most dominant in the treatment of three types of solvents (ethanol, ethyl acetate, and n-hexane). HCA shows that the three types of solvents were form different clusters. Besides that, based on secondary metabolites, secondary metabolites are divided into three clusters. The first cluster consists of 11 compounds, including cinnamic acid, p-coumaric acid, (E)-ferulic acid, betaine, corymboside, proacaciberin, schaftoside, haplophytine, 4-methoxy cinnamic, DL-beta-leucine, and L-phenylalanine. The second cluster consists of three compounds: nootkatone, oleamide, and linoleamide. The third cluster consists of 11 compounds, including 4-(4-hydroxy-2,6,6-trimethyl-3-{[(2R,3R,4S,5S,6R)-3,4,5-trihydroxy-6 (hydroxymethyl) oxan-2-yl]oxy}cyclohex-1-en-1-yl) butane-2-one, P-cymene, 12-oxo phytodienoic acid, 4-indolecarbaldehyde, O-ureido-D-serine, methyl jasmonate, 9S,13R-12-oxophytodienoic acid, violaxanthin, alpha-allosteric, anacardic acid, and stearidonic acid. HCA analysis regarding the relationship between TEAC and solvent type is shown in Figure 4a. Heatmap analysis shows the extraction method with various solvents shows a different correlation with the order of ethanol > ethyl acetate > n-hexane.
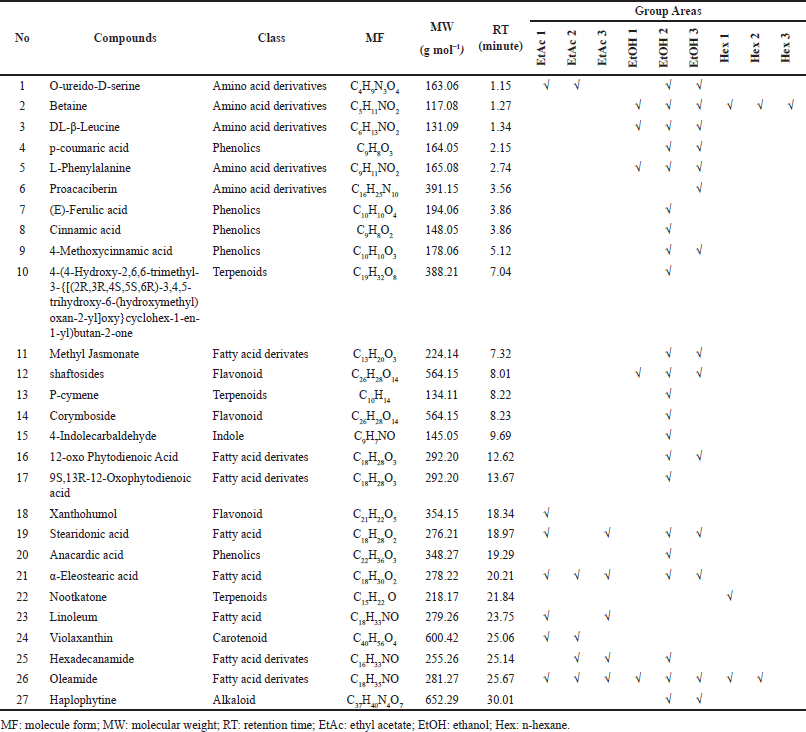 | Table 4. Secondary metabolite of G. pictum in all three solvents. [Click here to view] |
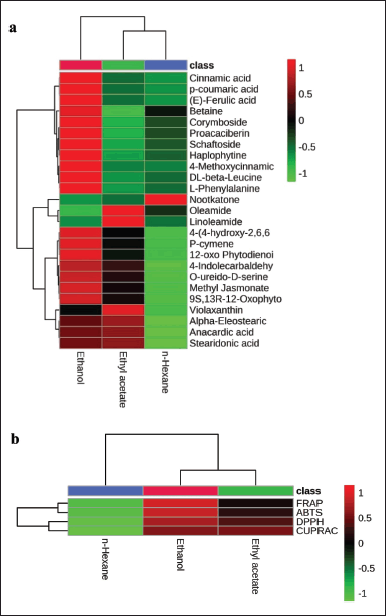 | Figure 3. HCA of Orthosiphon aristatus. (a) HCA-heatmap dendrogram based on 25 dominant metabolites and (b) TEAC antioxidant capacity against solvent treatment. Red color indicates a positive correlation (+1), green color indicates a negative correlation (−1), and black color indicates no correlation (0). [Click here to view] |
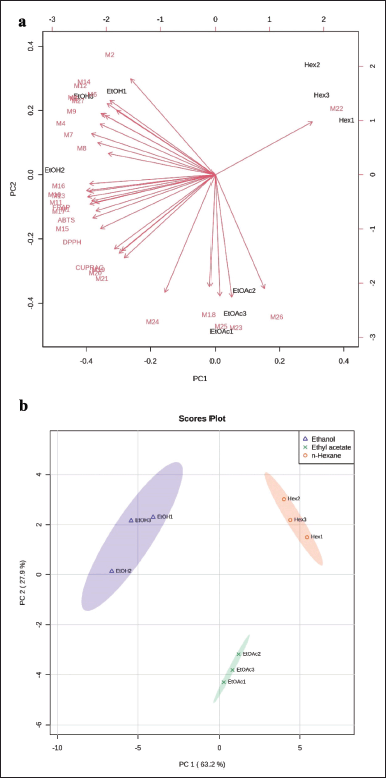 | Figure 4. PCA of secondary metabolites of G. pictum: (a) loading plot and (b) score plot of PCA based on differences in secondary metabolites (1–27, Table 4) in solvent treatment samples G. pictum. [Click here to view] |
PCA was carried out to reduce the data obtained so that the distribution of chromatogram data could be explained. The PCA results can correlate the possibility of predicting active compounds through loading (Fig. 4a) and score plots (Fig. 4b), with PC1 and PC2 values of 63.2% and 27.9%, respectively, so that the combined value of PC1 and PC2 (91.1%) is greater than 70%, indicating a high data diversity (peak chromatogram area), which can be explained well by PCA [35]. Furthermore, the loading plot is the contribution of various secondary metabolites to the PCA. Based on their close correlation, the data are visualized as a vector between all secondary metabolites [36]. Based on the data on the loading plot, the secondary metabolites of the ethanol extract have the highest contribution to the overall observed TEAC test analysis (DPPH, ABTS, FRAP, and CUPRAC), consistent with the HCA analysis (Fig. 3). The score plot shows differences between the solvent treatment data, forming three data clusters. Figure 4b shows that the identified compounds tend toward ethanol solvents for all antioxidant methods; this correlates with the high antioxidant capacity of ethanol solvents. The identified compounds show the dominance of phenolic group compounds, which play a role in antioxidants. This is appropriate with Sadeer et al. [25], who evaluated several antioxidant methods and showed that the phenolic group had a significant role with a correlation value greater than 0.8. According to reports [13], using a chemometric approach showed that phenolics and flavonoids play a role in various antioxidant activities. This research shows that ethanol extract can be fractionated to isolate active compounds with antioxidant activity.
CONCLUSION
This study shows that the type of solvent determines the optimal conditions for TPC and TFC and antioxidant activity in G. pictum extracts. The ethanol solvent showed optimal conditions for the TPC of G. pictum extract of 32.17 mg GAE/g DW. In comparison, the optimal condition for TFC was indicated by ethyl acetate solvent with a value of 9.14 mg QE/g DW. On the other hand, overall, based on its pharmacological activity as an antioxidant, the four methods used, namely, DPPH, ABTS, FRAP, and CUPRAC, showed that the G. pictum extract with ethanol solvent showed the highest antioxidant activity, respectively 29.79, 33.27, 52.54, and 65.94 µM TE/g DW. This shows that the most optimal antioxidant ability of G. pictum extract is obtained from the ethanol extract of the G. pictum. This study helps develop industrial and medicinal products containing G. pictum leaves.
ACKNOWLEDGMENTS
I would like to express my gratitude to the Institute for Research and Community Service of Universitas Pembangunan Nasional Veteran Jakarta for being awarded the PDUPT grant by the Ministry of Research, Technology and Higher Education Indonesia in 2022 -2023 (Grant number 013/UN.61.4/2022).
AUTHOR CONTRIBUTIONS
Waras Nurcholis, Feda Anisah Makkiyah, and Eldiza Puji Rahmi carried out the concept, design, and drafting of the article. Acquisition of data, interpretation of data, statistical analysis, critical revision, supervision, and final approval were carried out by Waras Nurcholis, Fachrur Rizal Mahendra, Rini Anggi Arista, and Faizal Maulana.
CONFLICTS OF INTEREST
The authors report no financial or any other conflicts of interest in this work.
ETHICAL APPROVALS
This study does not involve experiments on animals or human subjects.
DATA AVAILABILITY
All data generated and analyzed are included in this research article.
PUBLISHER’S NOTE
This journal remains neutral with regard to jurisdictional claims in published institutional affiliation.
REFERENCES
1. Rahmi H, Artika I, Azwar N, Seno D, Nurcholis W. The activity of wungu leaf (Graptophyllum pictum (L) Griff) extract in reducing blood glucose level of hyperglycemic mice. Curr Biochem. 2014;1:83–8. CrossRef
2. Makkiyah FA, Rahmi EP, Susantiningsih T, Marliani N, Arista RA, Nurcholis W. Optimization of Graptophyllum pictum leaves extraction using a simplex centroid design focused on extracting flavonoids with antioxidant activity. J App Pharm Sci. 2022;13:214–21. CrossRef
3. Budiono BP, Presetyo SA, Riwanto I, Sulistyaningsih S, Nugroho EA. Graptophyllum pictum Extract in the treatment of experimental hemorrhoids: effects on vascular leakage and matrix metalloproteinase-9 levels. Open Access Maced J Med Sci. 2021;9:1785.
4. Ali MY, Park S, Chang M. Phytochemistry, ethnopharmacological uses, biological activities, and therapeutic applications of Cassia obtusifolia L.: a comprehensive review. Molecules. 2021;26:6252. CrossRef
5. Kanedi M, Widodo S, Fitri A, Handayani K, Setiawan W. Antibacterial activity of leaf extract of caricature plant (Graptophyllum pictum L.) against Staphylococcus aureus and Pseudomonas aeruginosa. Int J Pharm Sci Res. 2021;6:1–3.
6. Tandi M, Dini I, Muharram M. Isolasi dan Uji Bioaktivitas Senyawa Metabolit Sekunder Ekstrak Metanol Fraksi Non Polar Daun Ungu (Graptophyllum pictum (L.) Griff). Chem J Ilmiah Kimia Dan Pendidikan Kimia. 2021;22:12–26. CrossRef
7. Kusumaningsih T, Sidarningsih, Putra A, Aljunaid M. Antibacterial differences effect between purple leaves (Graptophyllum pictum (L) Griff.) 70% and 96% ethanol extract against Aggregatibacter actinomycetemcomittans bacteria. J Int Dent Med Res. 2021;14:519–24.
8. Huliselan YM. Aktivitas antioksidan ekstrak etanol, etil asetat, dan n-heksan dari daun sesewanua (Clerodendron squamatum Vahl.). Pharmacon. 2015;4:155–63. CrossRef
9. Masyita M, Sayekti E, Nurlina N. Flavonoid compounds of the catechin from wungu (Graptophyllum pictum (L.) Griff) leaves and the sun protecting factor value. J Akad Kimia. 2022;11:31–8. CrossRef
10. Nurcholis W, Alfadzrin R, Izzati N, Arianti R, Vinnai BÁ, Sabri F, et al. Effects of methods and durations of extraction on total flavonoid and phenolic contents and antioxidant activity of Java cardamom (Amomum compactum Soland Ex. Maton) fruit. Plants (Basel). 2022;11:2221. CrossRef
11. Khumaida N, Syukur M, Bintang M, Nurcholis W. Phenolic and flavonoid content in ethanol extract and agro-morphological diversity of Curcuma aeruginosa accessions growing in West Java, Indonesia. Biodiversitas. 2019;20:656–63. CrossRef
12. Li X, Zhang X, Ye L, Kang Z, Jia D, Yang L, et al. LC-MS-based metabolomic approach revealed the significantly different metabolic profiles of five commercial Truffle species. Front Microbiol. 2019;10:1–18. CrossRef
13. Batubara I, Komariah K, Sandrawati A, Nurcholis W. Genotype selection for phytochemical content and pharmacological activities in ethanol extracts of fifteen types of Orthosiphon aristatus (Blume) Miq. leaves using chemometric analysis. Sci Rep. 2020;10:20945. CrossRef
14. Anggi Arista R, Pontjo Priosoeryanto B, Nurcholis W. Profile volatile compounds in essential oils on different parts of cardamom with antioxidant activity. Biointerface Res Appl Chem. 2022;13:328. CrossRef
15. Maulana F, Muhammad AA, Umar A, Mahendra FR, Musthofa M, Nurcholis W. Profiling metabolites through chemometric analysis in Orthosiphon aristatus extracts as α-glucosidase inhibitory activity and in silico molecular docking. Indones J Chem. 2022;22:501–14. CrossRef
16. Jiangseubchatveera N, Liaewruangrath S, Teerawutgulrag A, Santiarworn D, Pyne S, Liawruangrath B. Phytochemical screening, phenolic and flavonoid contents, antioxidant and cytotoxic activities of Graptophyllum pictum (L.) Griff. Chiang Mai J Sci. 2017;44:193–202.
17. Arfin T, Sonawane K, Tarannum A. Review on detection of phenol in water. Adv Mater Lett. 2019;10:753–85. CrossRef
18. Vauzour D, Rodriguez-Mateos A, Corona G, Oruna-Concha MJ, Spencer JPE. Polyphenols and human health: prevention of disease and mechanisms of action. Nutrients. 2010;2:1106–31. CrossRef
19. Quero J, Mármol I, Cerrada E, Rodríguez-Yoldi MJ. Insight into the potential application of polyphenol-rich dietary intervention in degenerative disease management. Food Funct. 2020;11:2805–25. CrossRef
20. Mohammed E, Abdalla I, Alfawaz M, Mohammed M, Almaiman S, Osman M, et al. Effects of extraction solvents on the total phenolic content, total flavonoid content, and antioxidant activity in the aerial part of root vegetables. Agriculture. 2022;12:1820. CrossRef
21. Kumar S, Pandey AK. Chemistry and biological activities of flavonoids: an overview. Sci World J. 2013;2013:e162750. CrossRef
22. Maher P. The potential of flavonoids for the treatment of neurodegenerative diseases. Int J Mol Sci. 2019;20:3056. CrossRef
23. Zheng Y-Z, Deng G, Zhang Y-C. Multiple free radical scavenging reactions of flavonoids. Dyes Pigments. 2022;198:109877. CrossRef
24. Apak R, Güçlü K, Ozyürek M, Karademir SE, Altun M. Total antioxidant capacity assay of human serum using copper(II)-neocuproine as chromogenic oxidant: the CUPRAC method. Free Radic Res. 2005;39:949–61. CrossRef
25. Sadeer N, Montesano D, Albrizio S, Zengin G, Mahomoodally F. The versatility of antioxidant assays in food science and safety-chemistry, applications, strengths, and limitations. Antioxidants. 2020;9:709. CrossRef
26. Sadowska-Bartosz I, Bartosz G. Evaluation of the antioxidant capacity of food products: methods, applications and limitations. Processes. 2022;10:2031. CrossRef
27. Indradi B, Fidrianny I, Wirasutisna K. DPPH scavenging activities and phytochemical content of four asteraceae plants. Int J Pharmacogn Phytochem Res. 2017;9:755–9. CrossRef
28. Insanu M, Zahra A, Sabila N, Silviani V, Haniffadli A, Rizaldy D, et al. Phytochemical and antioxidant profile: cucumber pulp and leaves extracts. Open Access Maced J Med Sci. 2022;10:616–22. CrossRef
29. Nagarajan S, Nagarajan R, Kumar J, Salemme A, Togna AR, Saso L, et al. Antioxidant activity of synthetic polymers of phenolic compounds. Polymers. 2020;12:1646. CrossRef
30. Lee S, Oh D-G, Singh D, Lee HJ, Kim GR, Lee S, et al. Untargeted metabolomics toward systematic characterization of antioxidant compounds in Betulaceae family plant extracts. Metabolites. 2019;9:186. CrossRef
31. Nurcholis W, Sya’bani Putri DN, Husnawati H, Aisyah SI, Priosoeryanto BP. Total flavonoid content and antioxidant activity of ethanol and ethyl acetate extracts from accessions of Amomum compactum fruits. Ann Agric Sci. 2021;66:58–62. CrossRef
32. Jiangseubchatveera N, Liawruangrath B, Liawruangrath S, Teerawutgulrag A, Santiarworn D, Korth J, et al. The chemical constituents and the cytotoxicity, antioxidant and antibacterial activities of the essential oil of Graptophyllum pictum (L.) Griff. J Essential Oil Bearing Plants. 2015;18:11–7. CrossRef
33. Tagousop CN, Tamokou J-D, Ekom SE, Ngnokam D, Voutquenne-Nazabadioko L. Antimicrobial activities of flavonoid glycosides from Graptophyllum grandulosum and their mechanism of antibacterial action. BMC Complement Altern Med. 2018;18:252. CrossRef
34. Suhargo L, Winarni D, Hayati A. Effects of leaf ethanol extract of Graptophyllum pictum L. griff. on liver glycogen synthesis of ovariectomized mice. AIP Conf Proc. 2023;2679:040003. CrossRef
35. Jolliffe IT, Cadima J. Principal component analysis: a review and recent developments. Philos Trans R Soc A. 2016;374:20150202. CrossRef
36. Nasr M, Zahran H. Performance evaluation of agricultural drainage water using modeling and statistical approaches. Egypti J Aquatic Res. 2016;42:141–8. CrossRef