INTRODUCTION
Free radical production triggered by either internal factors or external exposures is an unavoidable harmful process. Free radicals, atoms, or molecules containing an unpaired electron, are though necessarily needed for the sustainability of cells or organisms since they are substantially involved in signal transduction to cope with harmful microbes and dispel toxins (U?ran and Levent, 2021). Reactive oxygen species (ROS) such as hydrogen peroxide (H2O2), hypochlorous acid, singlet oxygen (1O2), superoxide (O2•−), hydroxyl radical (•OH), nitric oxide (•NO), and peroxynitrite (ONOO−) are the byproduct of aerobic metabolism that is a natural cellular process generating energy in living organisms (Nakai and Tsuruta, 2021; Nakamura and Takada, 2021). ROS is among the factors responsible for oxidized molecules (DNA, lipid, and protein), damaged organelles, and harmed other cells’ compartments leading to cell damage and even further tissue injury. A persistence process in which ROS formation exceeds the antioxidant (AO) defense mechanism will lead to oxidative stress (OS), which is considered the causative factor in the onset and progression of aging and various diseases (U?ran and Levent, 2021).
Intracellular ROS formation can be measured by flow cytometry using 2’,7’-dichlorofluorescein diacetate (DCFDA). After diffusing into the cells, the compound undergoes deacetylation by cellular esterase into 2’,7’-dichlorodihydrofluorescein as a nonfluorescent compound; then, it is oxidized by ROS into 2’,7’-dichlorofluorescein (DCF). DCF is a compound with high fluorescence and is quantitatively detectable with a flow cytometer. The profile shift of the fluorescent indicates the number of ROS in cells (Eruslanov and Kusmartsev, 2010).
H2O2 is a cytotoxic compound commonly used for in vitro experiments (Cheong et al., 2016). As one type of ROS, H2O2 may also act as the majority precursor for other molecules of ROS formations, which causes oxidative damage to cells. The detrimental effect of H2O2 depends on the severity, level of exposure, and exposed cell type (Chidawanyika and Supattapone, 2021). H2O2 is an important signaling cascade molecule, and it participates in the various metabolic processes of cells (Zenin et al., 2022). In contrast, it is also crucial to cancer cells, which facilitate the malignancy (proliferation, metastasis, and angiogenesis processes) and survival. Though, at a relatively high concentration, it may induce cancer cell death (Yan et al., 2017). In this examination, we used Vero and HepG2 representing a noncancerous (normal type) and cancerous cell line, respectively.
Both Vero and HepG2 cell lines have been applied extensively in pharmacological studies. Furthermore, HepG2 is a highly proliferative grown cell that is suitable for wide-arrange culture systems (Haryanti et al., 2021).
Nowadays, people rely on AO agents, especially plant-derived molecules to keep healthy and overcome stress-oxidative (SO-)-related diseases. Macaranga subpeltata is among the medicinal plants used by Indonesian traditional healers for treating common liver diseases (Widodo et al., 2019). This plant’s leaf extract, especially its ethyl acetate crude fraction [ethyl acetate crude fraction of M. subpeltata (EACFM)], has shown to have high AO properties due to its high content of phenolic compounds; otherwise, pharmacological properties data of the plant are still limited (Widodo et al., 2020). On the other hand, silymarin, a polyflavonoid compound (silidianin, silichristin, isosilibinin, and silybin) from Silybum marianum (L.) Gaertn., has been widely used for alleviating a wide array of diseases due to its cardio-, neuro-, nephro-, and hepatoprotective effects and its activity as a potent AO (Sudrajad et al., 2022). It has been described as a liver protector in folk medicine for almost 2,000 years and has been used as the gold standard drug for treating liver disorders (Surai, 2015). Silymarin is a standardized extract obtained from dry seeds of the S. marianum L. Gaertn. The main component is silibinin which has widely been employed as a standard for in vitro cytoprotective comparison against SO due to exposure to oxidants such as H2O2 (Jiang et al., 2016).
Based on the above crosstalk, this study aims to examine the influence of EACFM and silymarin on H2O2-induced OS using normal cell (Vero) and cancerous (HepG2) cell lines. Vero cells derived from the kidneys of adult African green monkeys (Cercopithecus aethiops) have widely been used for cytoprotective testing of AO compounds from a plant extract against SO (Srinivasan et al., 2015). These cells still showed stable growth characteristics during continuous passages, with a doubling time of 24 hours (Rhazi et al., 2021; Sène et al., 2022). HepG2 cell is a well-differentiated cell line immortalized from hepatocellular carcinoma of a 15-year-old Caucasian male (Sefried et al., 2018).
MATERIAL AND METHODS
Sample preparation
Plant material was obtained from Ponorogo district, Central Java Province, and was authenticated by taxonomist of Medicinal Plant and Traditional Research Centre of NIHRD-MOH, Republic of Indonesia (ref. no. YK 01.03/2/377/2021). Methanolic leaves extract of M. subpeltata was prepared by maceration according to Widodo et al. (2019); the fractionation to obtain EACFM was performed using liquid–liquid fractionation following the previous method of Widodo et al. (2020).
Cell line preparation
The cell lines (Vero and human hepatocellular carcinoma (HepG2) ATCC HB-8065) were obtained from the Cancer Chemoprevention Research Centre, Faculty of Pharmacy, Universitas Gadjah Mada. The cells were grown in Dulbecco’s Culture Media Modified Eagle Medium (DMEM, Sigma) [consisting of 2% (w/v) 4-(2-hydroxyethyl)-1-piperazineethanesulfonic acid (Sigma), 2.35% (w/v) CHNaO3 (Sigma), 10% (v/v) fetal bovine serum (FBS) (Gibco), 1% (v/v) penicillin-streptomycin (Gibco), Fungizone 0.25% (v/v) (Gibco)] at cell culture plate (Iwaki) in incubator with CO2 5% and 37°C.
Radical scavenging assay
In vitro radical scavenging assay was performed using 2,2-diphenyl-1-picrylhydrazyl (DPPH) and Trolox Equivalent Antioxidant Capacity (TEAC) methods according to a previous study (Widodo et al., 2020).
In vitro assays using cell lines were performed according to CCRC (2019) with little modifications as described in the following.
Cytotoxic test of EACFM on Vero and HepG2 cell lines
Vero and HepG2 8 × 10³ cells/100 µl were grown in DMEM at 96-well cell culture plate (Iwaki); afterwards, the cells were incubated for 24 hours (CO2 5%; 37°C). The confluent cells were treated with EACFM and silymarin (Sigma-Aldrich) at a series concentration of 0–1,000 µg/ml (incubated for 24 hours). The media were discarded, and washed with 1× PBS (Sigma-Aldrich) and adding 0.5 mg/ml 3-(4,5-dimethyl azole-2-yl)-2,5-diphenyltetrazolium bromide [50 mg Thiazolyl Blue Tetrazolium Bromide (Sigma) in 10 ml of 1× PBS] in media, and were incubated for 3–4 hours afterward. The reaction was terminated with 10% (w/v) SDS (Sigma) in 0.01 N HCl (Merck) and was kept overnight in the darkroom. The viable metabolically active cells were measured by reading absorbance at λ 595 nm (Multiskan-Thermo Scientific, Finland). Cell viability was calculated from the percentage of living cells.
Note: A0: absorbance of control media (media only without cell lines)
Ax0: absorbance of cell with media without EACFM or Silymarin
Ax1: absorbance of EACFM or silymarin with EACFM or Silymarin x1 concentration
The inhibition concentration 50% (IC50) was calculated from a linear regression (% of living cells against compound concentration).
Assessment of ROS production
Vero and HepG2 5 × 10⁴ cells in 500 μl DMEM media in each well were grown on 24-well cell culture plates (Iwaki) for 24 hours. The ROS production test was performed using H2O2 (Merck): 0, 500 and 1,000 µM, EACFM, and silymarin (Sigma) on Vero and HepG2. The media were discarded and washed with 1× PBS (pH 7.4). Cell lines were treated with EACFM and silymarin (0, 50, 100, and 150 μg/ml) and maintained for 4 hours in a cell culture incubator. The media was discarded and washed with 1× PBS; afterwards, in each cell line in each well, 500 μl of a freshly prepared solution of 20 μM DCFDA (Sigma) in a 10% supplement buffer (2 ml of FBS plus 18 ml of 1× PBS) was added. The DCFDA solution was discarded and replaced with 500 μl H2O2 solution in a 10% supplement buffer according to the desired treatment concentration and was incubated for 2 hours afterwards. H2O2 solution was discarded and washed with PBS. Cells were harvested using 0.25% (v/v) Trypsin-ethylenediaminetetraacetic acid (EDTA) (Sigma-Aldrich) without phenol red 100 μl/well and were incubated for 3 minutes; then, 1.0 ml of 10% supplement buffer was added before flow cytometric analysis.
Apoptosis evaluation
Vero and HepG2 cells 5 × 10⁵/ml media were grown for 24 hours in 6-well cell culture plate (Iwaki) until confluence and then were treated with sample tests accordingly. The culture media were discarded and washed with 1× PBS. 1,000 μl of EACFM or silymarin was added according to the concentration applied and was incubated for 4 hours. The cells were treated with H2O2 (according to concentrations) and were incubated for 12 hours. The treatment cells were harvested using 150 µl of 0.25% (v/v) trypsin-EDTA and were collected entirely in a separate conical tube each. The remaining cells were taken using 500 µl of PBS and were transferred to the same tube and centrifuged (500 rpm; 4 minutes). The cell pellets were mixed homogeneously with a 100 µl apoptosis reagent (BD PharmingnTM) (consisting of 4 μl FITC annexin V, 4 µl propidium iodide (PI), and 92 µl annexin buffer) and were placed in the dark for 15 minutes at room temperature. The cell suspensions were transferred to the microtube and added with 400 µl of annexin buffer before flow cytometric analysis.
Flow cytometric analysis
The ROS production analysis using a flow cytometer (BD Accuri C6, USA) indicated by the fluorescence intensities was measured at an excitation of λ 485 nm and emissions of λ 535 nm. The ROS intracellular was obtained from a minimum of 2,500 cells per treatment. The ROS data were presented as a fold of untreated cells obtained from shifting fluorescence mean of the treatment divided by fluorescence percentage mean of the control without treatments. Cell death evaluation was depicted as a plotting profile from a run limit of 20,000 events per sample treatment.
Data analysis
Flow cytometry analysis data were calculated using BD Accuri C6 software and Statistical Package for the Social Sciences version 16.0 for statistical analysis. All experimental studies were done in triplicate, and the data represented mean ± SD. The effect differences among treatments were subjected to analysis of variance (ANOVA; p = 0.05) followed by the Post-Hoc Duncan Multiple Range Test with a significant level of 95%.
RESULTS AND DISCUSSION
OS is a process that initiates various degenerative diseases; the body requires an intake of AOs from the diet to reduce the damaging effects of OS. Moreover, the intake is expected to increase or support endogenous AOs. EACFM had strong AO activity, IC50 DPPH of EACFM was comparable to L-ascorbic acid even better, while silymarin showed lower DPPH radical scavenging activity than EACFM (Fig. 1A). The AO capacity test using TEAC assay showed the same things; EACFM showed a greater capacity to scavenge 2,2’-azino-bis (3-ethylbenzothiazoline-6-sulfonic acid) (ABTS) radicals (Fig. 1B). These better AO properties are supported by the content of flavonoid and phenolic compounds in EACFM (Widodo et al., 2020).
The effect of EACFM and silymarin on cell viability
A recent study revealed that the EACFM has low toxicity (nontoxic) to both the normal cell lines and the cancer cells, especially at low concentrations (<125 µg/ml). When treated with EACFM lower than 125 µg/ml, the Vero cell was more susceptible to cell death than HepG2, whereas silymarin gave a contrary result. Interestingly, via treatment at a low concentration (< 50 µg/ml), silymarin stimulated the viability of Vero cells higher (>100%) than the control. Silymarin demonstrated tissue regenerative properties (Surai, 2015). Wu et al. (2015) reported that silymarin could accelerate the cell cycle, which might enhance hepatocyte proliferation after partial hepatectomy. Moreover, with no lees enticing, silymarin at the same concentration inhibited the growth of HepG2 cells, and the cytotoxic activity of silymarin against HepG2 cells was more prominent than the EACFM (Fig. 2).
Silymarin resulted in a lower IC50 both in Vero and HepG2 cells than those of EACFM, and the selectivity index (SI) of silymarin was higher than EACFM, indicating that silymarin was more selective in killing cancer cells and was relatively safer to the normal cell. SI value exhibits a specific degree of any anticancer drug, and the SI value of more than three indicates that the compound has high selectivity toward cancer cells. Doxorubicin, one of the wide-spectrum tumor medication drugs, shows a high SI value; unfortunately, clinical adverse effects are found in the systemic dosing (Haryanti et al., 2021). Therefore, finding a new anticancer is still a challenging task. IC50 states the concentration of the tested compound that causes cell line lives of 50% during the specified incubation time. The IC50 EACFM on HepG2 cells was lower than on Vero cells implicating that it had an anticancer activity (Table 1). However, EACFM is still a fraction that still contains various compounds that may have diverse pharmacological activities. Further investigation is needed, especially for compound isolation of EACFM, which is responsible for anticancer activity with higher SI.
At the same concentration, silymarin showed better cytoprotective activity on normal cells (Vero) than EACFM; furthermore, silymarin increased the cytotoxicity of H2O2 via OS-induced death to enhanced cancerous cells (HepG2) to die. The SI value of silymarin was 2.15, indicating that silymarin has good anticancer activity. Silymarin significantly increases the apoptosis rate of the cancer cells by inhibiting and blocking nuclear factor kappa B activation, inducing cytochrome C release, activating caspase-3 and caspase-9 and cleavage of poly-adenosine diphosphateribose polymerase, and also downregulating p-ERK1/2 and Bcl-2 expression (Fallah et al., 2021).
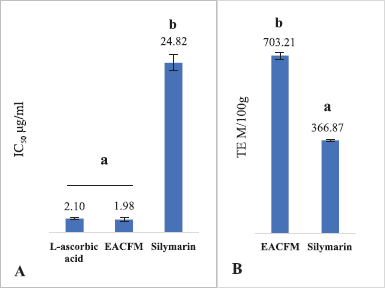 | Figure 1. The IC50 DPPH scavenging activity (A) and TEAC (B). The mean values with the same letter above showed no significant difference according to the DMRT (p = 5%). [Click here to view] |
Silymarin at low concentration could promote normal cell (Vero) viability (Fig. 2). Mili? et al. (2013) explained that silymarin has a stimulatory effect on Vero cells similar to fibroblast. Silymarin increases the synthesis of functional and structural proteins, accelerates DNA synthesis, and thus promotes cell proliferation and organ regeneration (Khazaei et al., 2022). According to Surai (2015), the role of silymarin in blocking SO is to protect the integrity of mitochondrial structure and function, trigger prosurvival signals, optimize the electron transport chain, reduce electron leakage, reduce ROS formation, and directly reduce the activity of ROS-producing enzymes in mitochondria.
The ROS production
The administration of EACFM and silymarin alleviated intracellular ROS generation on Vero and HepG2 cell lines. On Vero cells without SO’s induction (H2O2-untreated cells), the decreasing capacity of EACFM to ROS production weakened as concentration rose. However, the reduction of ROS production by silymarin on Vero cells did not increase or reduce in line with the elevation of silymarin concentration treatment (Fig. 3).
H2O2 up to the concentration of 1.0 mM increased ROS in a dose-dependent manner both in Vero and HepG2 cells. The EACFM could hamper the increase of ROS-causing SO due to H2O2 treatment. The ability of EACFM to reduce ROS on Vero cells was in line with the increase of applied concentration, especially for H2O2 1,000 µM (Fig. 4A); on the contrary, ROS production by HepG2 elevated with an increase in EACFM’s concentration (3B). In the negative control (without H2O2 treatment), both normal (Vero) and cancerous (HepG2) cell lines, treated with EACFM 50 µg/ml, decreased ROS greater than those treated at higher concentrations which were proportional to silymarin at a concentration of 50–100 µg/ml. Silymarin at 150 _µg/ml gave the best ROS reduction, especially on HepG2 cells, while ROS reduction by EACFM was higher on normal cells than on cancerous cells (Fig. 4).
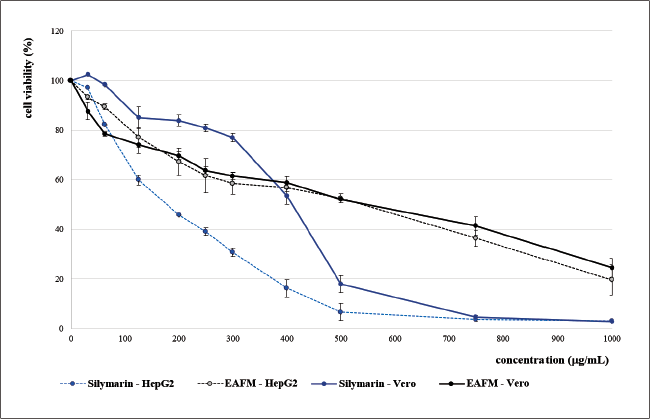 | Figure 2. Viability of Vero and HepG2 cells treated with EACFM and silymarin. [Click here to view] |
In various cancer cells, the level of ROS and the expression of AO enzymes are higher than in normal cells as a manifestation of adaptative mechanisms to intrinsic SO. ROS plays a double-edged sword in cancer; moderate elevation of ROS plays a role in the initiation, development, and level of cancer cell metastasis. However, an increase in ROS exceeding the defense mechanism threshold of the AO cancer cells can bring about the death of the cells (Kim et al., 2016; Ndombera, 2017; Perillo et al., 2020). Silymarin suppressed the growth of HepG2 cells (Fig. 2) through a decrease in ROS, and up to 150 µg/ml it still attenuated ROS production (Fig. 4B). A low concentration of EACFM could suppress the growth of HepG2 cells, also indicated by decreasing ROS production. The active cancer cells showed higher basal ROS levels than normal cells as a result of the activation of several oncogenes (Yang et al., 2018). Using a high concentration (150 µg/ml), the EACFM triggered cell death via an elevation of ROS generation levels over a critical threshold of the cancer cells. In normal cells (Vero), the EACFM treatment did not render an increase in ROS; furthermore, EACFM up to 150 µg/ml still had an impact on decreasing ROS (Fig. 4A).
 | Table 1. IC50 and SI of EACFM and silymarin on Vero and HepG2 cell lines. [Click here to view] |
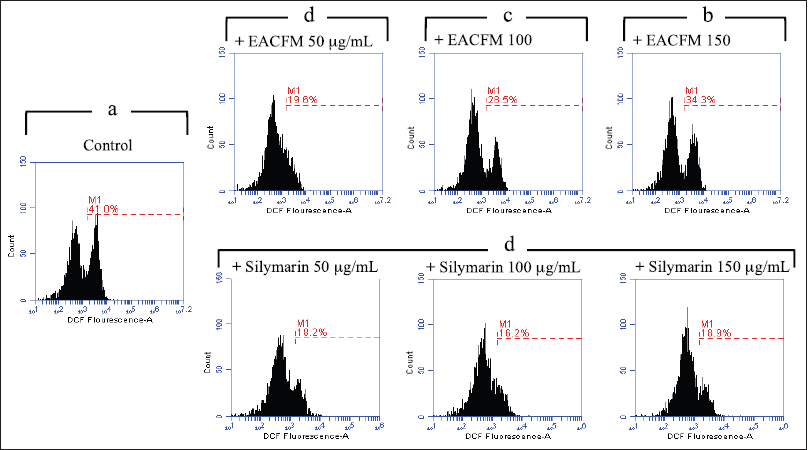 | Figure 3. The influence of EACFM and silymarin to ROS production on vero cell line untreated with H2O2. The percentage of the treatment plots followed by the same letters above indicated no significant difference (DMRT test; p = 0.05). [Click here to view] |
The effect of EACFM and Silymarin on H2O2-induced cell death cell lines
Evaluating cell death using flow cytometry would acquire four states of three occurring cell deaths, i.e., living cell, early apoptosis, late apoptosis, and necrosis. These phases can be determined by measuring the intensity of annexin V and PI. There are various alterations in cell features that encountered apoptosis or necrosis, one of which is phosphatidylserine (PS) translocation from the inner layer to the outside of the plasma membrane. PS is exposed to the outer surface of the cell membrane that subsequently reacts with Annexin V. On the other hand, PI acts as a necrotic cell death marker since it only binds to nucleic acids, the cells with intact plasma membranes, a condition in which PI could not translocate into the cell and bind to RNA and DNA; cells will give very low or absent fluorescence intensity (Vermes et al., 2000).
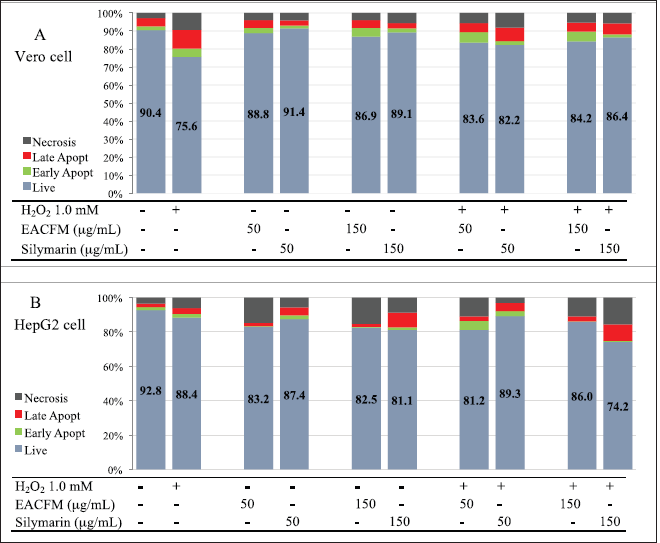
Under normal conditions, there was a death in Vero cells either via necrosis (2.95% ± 3.17%) or apoptosis (6.67% ± 3.58%), treatment with H2O2 1.0 mM for 12 hours stimulated cell deaths up to 24.41% ± 3.12%. The EACFM could reduce H2O2 cytotoxicity, and a concentration of 50 µg/ml had a proportional effect to silymarin 50 µg/ml, which was demonstrated by an increase in living cells of 9.53% while silymarin was 8.09%. A 150 µg/ml of silymarin exhibited a better cytoprotective action in living cell increment (12.54%) than that in EACFM (10.24%) (Fig. 4A).
HepG2 responds to SO in the same mode as primary hepatocyte cells (Liau et al., 2016); therefore, it is representative of an in vitro study. HepG2 cells were more resilient against H2O2 regiment than Vero cells, the same treatment with 1.0 mM H2O2 for 12 hours to HepG2 still resulted in cell viability of 88.42% ± 4.06% while viability of Vero decreased to 75.58% ± 3.11%. The ROS increased in tone with the increases in H2O2 concentration, as seen in the control treatment in Figure 4. Habtemariam and Lentini (2018) explained that ROS generation depended on the type of stimulus and the cell type, and ROS-activated caspase-3 and c-Jun N-terminal kinase as an inductive mechanism to apoptotic cell death. However, at a concentration of 50 µg/ml without H2O2 treatment, HepG2 was more sensitive to EACFM than Vero. The EACFM was more prominent in causing HepG2 cell death than silymarin at the same concentration. Using silymarin at 50 µg/ml, the number of living HepG2 was lower than Vero cells, while at the same concentration, there was an elevated viability of normal cells (Vero). On the other hand, HepG2 hepatocarcinoma cell death increased both through apoptosis and necrosis (Fig. 5B). Without H2O2 treatment, the EACFM was more pronounced in causing necrotic than apoptotic cell death of HepG2 cells, while silymarin was more likely due to apoptosis.
Silymarin consistently reduced ROS formation in the HepG2 cancerous type cell line even in the existent elevation of H2O2; however, it enhanced the HepG2 cell death. Those phenomena implicated silymarin in multiple actions. It might have a synergetic effect with H2O2 to modulate cytotoxicity to cancer cells, and it is not via ROS-dependent intoxication; otherwise, it happens through other pathways. Nakamura and Takada (2021) explained that compounds capable of suppressing intracellular ROS, such as deferasirox, would induce apoptosis of multiple myeloma cells.
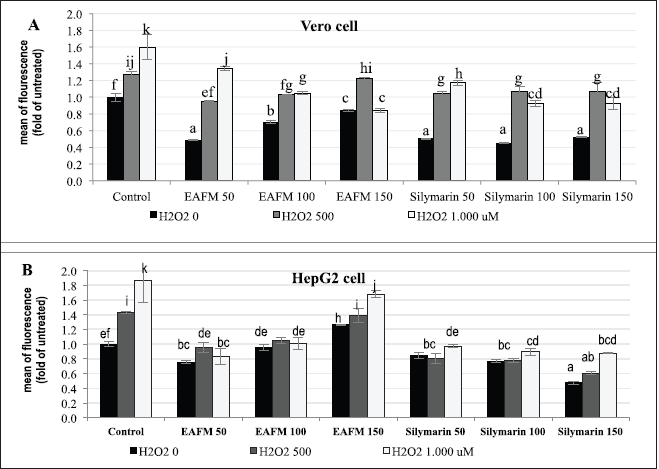 | Figure 4. The influence of EACFM and silymarin to H2O2-induced ROS production on Vero (A) and HepG2 (B) cell lines. The ROS formation represented in fold mean fluorescence compared to untreated cell line. Mean treatments of each cell line type followed by the same letters showed no significant difference (DMRT test; p = 0.05). [Click here to view] |
 | Figure 5. The influence of EACFM and silymarin to cell death of Vero (A) and HepG2 cell lines due to H2O2 treatment. [Click here to view] |
In cells treated with H2O2, cytoprotective action of EACFM and silymarin only occurred in Vero cells, while in HepG2 they had the opposite effect, namely, cell death escalating. The existence of H2O2 enhanced the action of silymarin causing HepG2 death, especially when at a concentration of 150 µg/ml while EACFM was more effective in causing HepG2 cell death at a concentration of 50 µg/ml.
CONCLUSION
The EACFM showed a high capacity of AO agent and possessed a potent in vitro AO activity that provided cell protection against H2O2-induced OS. The giving of EACFM increased the toxicity of H2O2 on the HepG2 cell line through the apoptotic and necrotic modulation; however, the fraction decreased H2O2 intoxication in the Vero cells. A low concentration of silymarin (<50 µg/ml) increased Vero cell viability, but it had shown a toxic impact on HepG2, indicating a more potent anticancer activity than EACFM. The EACFM showed a potential anticancer activity, but due to its low SI, further studies are still needed more likely to isolate the compound responsible for anticancer activity with a higher SI. Silymarin reduced ROS formation, either on treated or untreated H2O2 cell lines, which resulted in different motives, and it protected Vero cells from the detrimental effect of ROS-inducing agent (H2O2) but increased the toxicity of H2O2 in HepG2.
ACKNOWLEDGMENTS
The author thanks the Medicinal Plant and Traditional Research and Development Center (MPTMRDC), the NIHRD, Republic of Indonesia, for providing research materials and equipment.
AUTHORS’ CONTRIBUTIONS
Harto Widodo conducted the experiments, analyzed the data, and prepared the initial manuscript. Abdul Rohman monitored the experimental process, interpreted the data, and did the manuscript finalization.
CONFLICTS OF INTEREST
The authors declare there are no conflicts of interest in this work.
FUNDING
There is no funding to report.
ETHICAL APPROVAL
The commencement of the study has obtained ethical approval from the Ethical Clearance Commission of the Faculty of Veterinary Medicine, UGM (no. 0107/EC-FKH/Eks./2019).
DATA AVAILABILITY
All data generated and analyzed are included in this research article.
PUBLISHER’S NOTE
This journal remains neutral with regard to jurisdictional claims in published institutional affiliation..
REFERENCES
CCRC. Cancer Chemoprevention Reserch Centre working manual. Fakultas Farmasi UGM, Yogyakarta, Indonesia, 2019.
Cheong CU, Yeh CS, Hsieh YW, Lee YR, Lin MY, Chen CY, Lee CH. Protective effects of costunolide against hydrogen peroxide-induced injury in PC12 cells. Molecules, 2016; 21(898):1–0.
Chidawanyika T, Supattapone S. Hydrogen peroxide-induced cell death in mammalian cells. J Cell Signal, 2021; 2(3):206–11.
Eruslanov E, Kusmartsev S. Identification of ROS using oxidized DCFDA and flow-cytometry. In: Armstrong D. (Ed.). Advanced protocols in oxidative stress II. Methods in molecular biology (methods and protocols), Humana Press, Totowa, NJ, p 594, 2010.
Fallah M, Davoodvandi A, Nikmanzar S, Aghili S, Mirazimi SMA, Aschner M, Rashidian A, Hamblin MR, Chamanara M, Naghsh N, Mirzaei H. Silymarin (milk thistle extract) as a therapeutic agent in gastrointestinal cancer. Biomed Pharmacother, 2021; 142:112024.
Habtemariam S, Lentini G. Plant-derived anticancer agents: Lesson from the pharmacology of geniposide and its aglycon, genipin. Biomedicines, 2018; 6(2):39.
Haryanti S, Rahmawati N, Sholikhah IYM, Widiyastuti Y. Ficus septica, an ecosystem keystone species induced ROS mediated cytotoxicity in HepG2 hepatocarcinoma cells. The 8th International Conference on Sustainable Agriculture and Environment. IOP Conf Ser Earth Environ Sci, 2021; 905:012101.
Jiang HH, Yan FS, Shen L, Ji HF. Silymarin versus silibinin: differential antioxidant and neuroprotective effects against H2O2-induced oxidative stress in PC12 cells. Nat Prod Commun, 2016; 11(5):633–6.
Khazaei R, Seidavi A, Bouyeh M. A review on the mechanisms of the effect of silymarin in milk thistle (Silybum marianum) on some laboratory animals. Vet Med Sci, 2022; 8;289–301.
Kim H, Lee GR, Kim J, Baek JY, Jo YJ, Hong SE, Kim SH, Lee J, Lee HI, Park SK, Kim HM, Lee HJ, Chang TS, Rhee SG, Lee JS, Jeong W. Sulfiredoxin inhibitor induces preferential death of cancer cells through reactive oxygen species-mediated mitochondrial damage. Free Radic Biol Med, 2016; 91:264–74.
Liau LL, Suzana M, Azurah AGN, Chua KH. Hydrogen peroxide induces acute injury and up-regulates inflammatory gene expression in hepatocytes: an in vitro model. Sains Malays, 2016; 45(3):451–8.
Mili? N, Miloševi? N, Suvajdži? L, Žarkov M, Abenavoli L. New therapeutic potentials of milk thistle (Silybum marianum). Nat Prod Commun, 2013; 8(12):1801–10.
Nakai K, Tsuruta D. What are reactive oxygen species, free radicals, and oxidative stress in skin diseases? Int J Mol Sci, 2021; 22:10799.
Nakamura H, Takada K. Reactive oxygen species in cancer: current findings and future directions. Cancer Sci, 2021; 112:3945–52.
Ndombera FT. Anti-cancer agents and reactive oxygen species modulators that target cancer cell metabolism. Pure Appl Chem, 2017; 89(9):1333–48.
Perillo B, Donato MD, Pezone A, Zazzo ED, Giovannelli P, Galasso G, Castoria G, Migliaccio A. ROS in cancer therapy: the bright side of the moon. Exp Mol Med, 2020; 52:192–203.
Rhazi H, Safini N, Mikou K, Alhyane M, Tadlaoui KO, Lin X, Venkatesan NP, Elharrak M. Production of small ruminant morbillivirus, rift valley fever virus and lumpy skin disease virus in CelCradle™-500A bioreactors. BMC Vet Res, 2021; 17:93.
Sefried S, Ha¨ring HU, Weigert C, Eckstein SS. Suitability of hepatocyte cell lines HepG2, AML12 and THLE-2 for investigation of insulin signaling and hepatokine gene expression. Open Biol, 2018; 8:180147.
Sène MA, Xia Y, Kamen AA. Overview of recent advances in Vero cells genomic characterization and engineering for high-throughput vaccine manufacturing. Clin Transl Disc, 2022; 2:e40.
Srinivasan V, Panneerselvam R, Gunasekaran S, Palani S. Nephro-protective activity of ethanolic extract of Melia azadirachta against H2O2 induced toxicity in Vero cell line. IJABPT, 2015; 6(4):44–9.
Sudrajad H, Widodo H, Fauzi, Widiyastuti Y. Optimizing cultivation technique of Silybum marianum (L.) Gaertn. under tropical climate. Indian J Agric Res, 2022; 56(1):76–80.
Surai PF. Silymarin as a natural antioxidant: an overview of the current evidence and perspectives. Antioxidant, 2015; 4:204–47.
U?ran R, Levent A. Chapter 3: oxidative stress and liver. In: Güven A (Ed.). Oxidative stress and antioxidant defense system, Livre de Lyon, Lyon, France, vol. 1, p 92, 2021.
Vermes I, Haanen C, Reutelingsperger C. Flow cytometry of apoptosis cell death. J Immunol Methods, 2000; 243(1–2):169–90.
Widodo H, Sismindari S, Asmara W, Rohman A. Antioxidant activities of methanolic extract and its fractions of Baccaurea racemosa and Macaranga subpeltata leaves. Food Res, 2020; 4(1):127–34.
Widodo H, Sismindari S, Asmara W, Rohman A. Antioxidant activity, total phenolic and flavonoid contents of selected medicinal plants used for liver diseases and its classification with chemometrics. J Appl Pharm Sci, 2019; 9(06):099–105.
Wu JP, Tsai CC, Yu-Lan Yeh YL, Lin YM, Lin CC, Day CH, Shen CY, Padma VV, Pan LF, Huang CY. Silymarin accelerates liver regeneration after partial hepatectomy. Evid Based Complement Altern Med, 2015; 603529:14.
Yan D, Cui H, Zhu W, Talbot A, Zhang LG, Sherman JH, Keidar M. The strong cell-based hydrogen peroxide generation triggered by cold atmospheric plasma. Sci Rep, 2017; 7(10831):1–9.
Yang H, Villani RM, Wang H, Simpson MJ, Roberts MS, Tang M, Liang X. The role of cellular reactive oxygen species in cancer chemotherapy. J Exp Clin Cancer Res, 2018; 37:266.
Zenin V, Ivanova J, Pugovkina N, Shatrova A, Aksenov N, Tyuryaeva I, Kirpichnikova K, Kuneev I, Zhuravlev A, Osyaeva E, Lyublinskaya E, Gazizova I, Guriev N, Olga Lyublinskaya O. Resistance to H2O2-induced oxidative stress in human cells of different phenotypes. Redox Biol, 2022; 50:102245.