INTRODUCTION
Water is widely used in the pharmaceutical sector, being used in the most diverse stages of the production process, whether as a vehicle or raw material or for cleaning utensils and equipment (BRASIL, 2005; da Silva et al., 2008; Schymanski et al., 2015; Sumanth and Moin, 2015). Due to the chemical structure of water and its ease in forming hydrogen bonds, it becomes an excellent medium to solubilize, absorb, adsorb, or suspend various types of compounds (ANVISA, 2019a; Fatta et al., 2007; Gaur et al., 2011). Thus, in the pharmaceutical industry, water is of fundamental importance in several stages of the production process, being used as a raw material in about 90% of the manufactured products, for example, as a vehicle in pharmaceutical formulations (Carvalho et al., 2013; Petrovic et al., 2003). If contaminated, the water can interfere with the quality of medicines, causing product loss, undesirable pharmacological effects, and damage to the company, since it is one of the main components in the preparation of several liquid pharmaceutical forms, whether oral or parenteral (Cesário, 2013; Clementino et al., 2008; Kataoka, 2003; Pimenta et al., 2006). In the pharmaceutical area, quality control and constant monitoring of water quality are required by law for healthcare establishments, laboratories, pharmacies, and the pharmaceutical industry (Carvalho et al., 2013).
Therefore, to ensure the quality of medicines, the water used must have a considerable degree of purity, which can be obtained through the proper selection, installation, and validation of water purification processes, as well as distribution and storage systems (Moreno et al., 2011). Most of the contaminants in purified water come from contamination in the drinking water used in its production and materials and components of the purification system, whose removal is extremely important to guarantee the quality of the water produced and to avoid overloading elements in the system of purification, such as filters and membranes (Alves, 2013; BRASIL, 2013).
The technology to be used in water purification depends on the type of water to be obtained. To reduce the risks of chemical, biological, or microbiological contamination, the requirements of good manufacturing practices (GMP) are applied, which are always being updated. Ion exchange, reverse osmosis, and ultrafiltration are the most common and reliable methods for obtaining purified water, while the distillation process or another method of equal or superior technology is used for water purification if the objective is to obtain water for injectables (ANVISA, 2013). In addition, the combination of different analytical methods for treating and obtaining water will give rise to different treatment systems that are frequently used in the pharmaceutical industry, with the aim of obtaining water that fully meets the legally required specifications depending on its use (Brandão, 2015; Trick et al., 2008).
The electrical conductivity of water suggests the contamination of inorganic ions, such as minerals. It is a numerical formula that demonstrates the ability of water to conduct electric current, being conditioned to the temperature and the absolute concentration of ionizable dissolved matter. For example, chloride ions, which through soil and rock leaching, can be incorporated into groundwater and in high concentrations change the electrical conductivity level of the water established by legislation (dos Santos, 2017). According to Benedetti (2012), the determination of TOC is also an important parameter for assessing water quality. This parameter is used in order to evaluate water for pharmaceutical use in industrial productions by quantifying the organic compounds present in the samples; therefore, the presence of TOC in a sample can indicate contamination of water by synthetic compounds, the flow of carbon in the system, the presence of biological contaminants by the formation of biofilms, the poor state of conservation, and the inefficiency of a purification system. Therefore, a study was proposed with a new analysis routine performed daily for a month for the electrical conductivity and TOC parameters of the water used in pharmaceutical formulations of the enteral and injectable route in order to evaluate the conformity of its production and use in accordance with the principles of GMP, current legislation, and physical–chemical standards provided by the Brazilian Pharmacopoeia.
MATERIALS AND METHODS
Sample collection
Samples were collected daily, during the 31 days of March 2022, in a pharmaceutical industry based in the metropolitan area of Goiânia (central region of Goiás, Brazil), which produces parenteral, enteral, and injectable drugs. This month was chosen because it is a critical period of rain and floods in the region, causing a greater possibility of contamination of water supply sources, and therefore requiring better quality control. To carry out the collection of samples, strategic points were determined in the industry. During the collection, the water was discarded for ±3 minutes before starting the procedure of definitive collection of 500 ml of water for each point. All samples of purified water were collected in a properly cleaned polyethylene bottle and, in the case of water for injections, in sterilized bottles (Conrado and Cordeiro, 2006; USP, 2017). The samples were transported in isothermal boxes, which were taken to the physical-chemical laboratory of the industry to proceed with the conductivity and TOC analyses.
 | Table 1. Purified water test results. [Click here to view] |
Physicochemical analysis and statistical treatment
In the TOC analysis, a Mettler Toledo model 450 device was used. The equipment was stabilized with a pressure of 200 kPa and a gas flow regulator at 150 ml/minute, and the water level of the internal humidifier was checked. Then, the calibration curve was created with five points, and the direct reading was performed in a beaker containing 50 ml of water from all the bottles collected (USP, 2017). In the electrical conductivity test, the potentiometric method used a conductivity meter 912 model, Metrohm brand. The conductivity meter was calibrated using a standard solution provided by the instrument manufacturer. Then, 50 ml of water sample was transferred to a beaker, taken to the equipment, and, then, the conductivity was determined by direct reading in μS/cm (APHA, 2005). The Action Stat software (Quality version) developed by Estatcamp was used in the statistical treatment of the data (Estatcamp, 2014).
 | Figure 1. Boxplot graphic display for the (a) TOC and (b) electrical conductivity results in purified water tests. [Click here to view] |
RESULTS AND DISCUSSION
Purified water
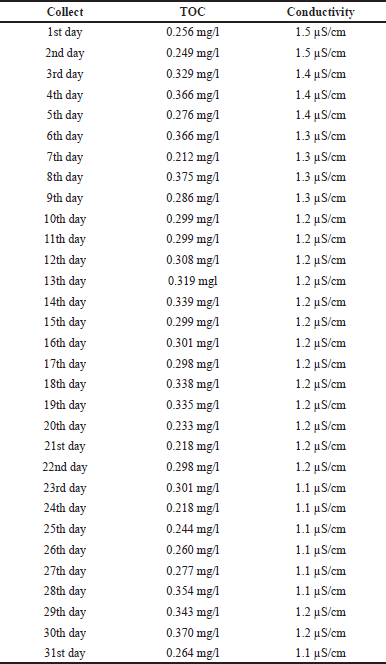
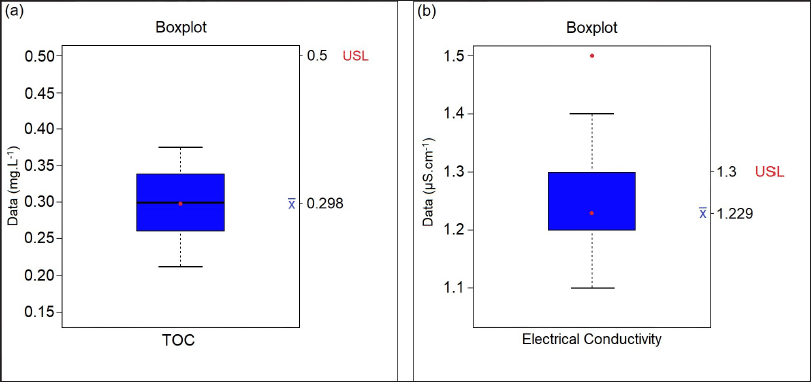
Table 1 lists all the purified water samples collected and their respective test results, of which the maximum acceptable limit, according to the Brazilian Pharmacopoeia, is 0.50 mg/l for the TOC test and 1.3 μS/cm for electrical conductivity. Through the boxplot graphs, we can show, discuss, and carry out studies of the values obtained when compared to the acceptable values for the TOC and conductivity tests. According to Montgomery (2014), the boxplot chart displays data on central tendency, dispersion, distance from symmetry, and observations far from most data (outliers or outliers), consisting of a rectangular box containing the first quartile (Q1), with 25% of the total data, the second quartile (Q2 or median) with 50% of the data, and the third quartile (Q3) with 75% of the total data and lines (whiskers) marked outside the rectangle, one below Q1 and another above Q3, representing the minimum and maximum values. Figure 1 was used to assess whether the TOC and conductivity results of the collected samples remained within specification. According to the descriptive summary of the statistical measures, a standard deviation of 0.047 was obtained, that is, below 5%, and there was no point above the acceptable limit. In addition, the trend line follows the average value, that is, without large variations for the minimum and maximum values.
For the TOC test, the upper specification limit (USL), according to the Brazilian Pharmacopoeia, is a maximum of 0.50 mg/l, so it is observed that there were no samples with values that exceeded the allowed, and the test was, therefore, in compliance (Fig. 1a). In the electrical conductivity test of purified water, which has a USL equal to 1.3 μS/cm, there were samples that presented readings above the specified limit (Fig. 1b). These extreme data occurred in the first five readings, resulting in a higher value for the standard deviation of the readings performed, exceeding 10%. Thus, it is essential to verify the variation of the result in order to investigate the cause of the increase in dissolved salts in the water, which can indirectly suggest the origin and degree of contamination by inorganic compounds. Another factor is to evaluate the results presented in the descriptive summary of the boxplot chart and then use this water in the production of medicines. In the monograph of Porto (2017), values were found on average of 0.8 μS/cm for water conductivity, taking into account the same maximum limit of up to 1.3 μS/cm.
According to GMP principles, all equipment must be properly qualified when it is installed and also during its operation and performance (ANVISA, 2019b). This means that the equipment must be calibrated as described by the manufacturer and also periodically monitored during its operation. Therefore, when unexpected deviations occur in the values of the results, one must first assess whether this equipment complied with the qualification conformities (Cesário, 2013). It is also important to verify causes related to the conditioning of the water in the period between the sample collection and the physical-chemical laboratory as it is necessary to prevent the water from suffering variations in temperature and pH. These changes cause the ionization of water molecules, increasing the concentration of H+ and OH− ions and, thus, modifying the conductivity values. The presence of carbon dioxide and chloride and ammonium ions in the water are also relevant factors, as they can be considered impurities and change the conductivity values (Porto, 2017).
 | Table 2. Descriptive summary for TOC and electrical conductivity in purified water. [Click here to view] |
 | Table 3. Water for injection test results. [Click here to view] |
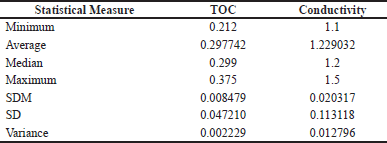
Through the descriptive summary of the statistical measures, it was possible to briefly evaluate the data obtained, such as minimum and maximum values, mean, standard deviation, and variance (Table 2). As previously mentioned, in addition to the highest value for the standard deviation in the conductivity test, the approximate value of 0.013 was also observed for the variance in this same test, being again higher when compared to the TOC test, due, naturally, to the number of readings with values distant from the value of 1.23, referring to the mean.
Water for injections
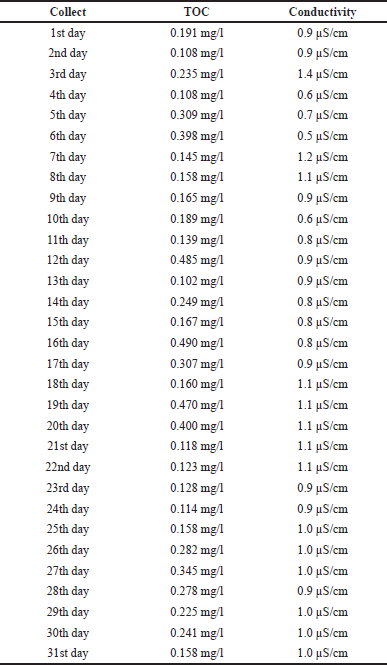
The results referring to the water for injection samples (Table 3) were obtained under the same analytical conditions and evaluated according to the same acceptance limit compared to the purified water samples described in Table 1. The dispersion of the values obtained for the analysis of TOC and electrical conductivity of water for injections is shown in Figure 2. For TOC, where the trend line is oriented towards the lower limit, there is a minimum value of 0.102 mg/l and a maximum of 0.490 mg/l, so it appears that all values are within acceptable limits according to the legislation (Fig. 2a). However, in the conductivity analysis, the reading on the third day of analysis showed a value of 1.4 μS/cm, exceeding the USL of 1.3 μS/cm (Fig. 2b). According to the analyses by Moreira (2017), the value of the standard deviation of the mean of the TOC test of an analyzed point of water for injections was 0.027 mg/l, showing little variation when compared to the value of 0.021 mg/l, as presented in the descriptive summary of water for injections (Table 4). Daily monitoring for the release of water for production is carried out through physical-chemical tests of water: electrical conductivity of water and TOC. These tests cover a wide range of organic and inorganic contaminants and are parameters that ensure the maintenance of the desired water quality in terms of physical and chemical aspects (Moreira, 2017).
The standard deviation of the mean was 0.03 in the conductivity test; however, due to the result of the sample with a critical value for the upper range exceeding that specified by the Brazilian Pharmacopoeia, the possible causes of noncompliance in the qualification of equipment will be investigated and the GMP through an investigation proposed from a failure analysis report. This report, proposed by quality assurance, conducts an investigation of possible failures of the processes involved in water quality with the objective of solving deviations and preventing future problems that may influence the formulations.
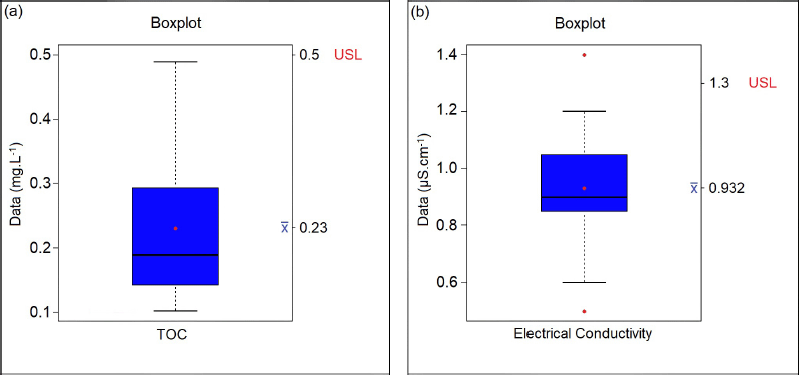 | Figure 2. Boxplot graphic display for the (a) TOC and (b) electrical conductivity results in water for injections tests. [Click here to view] |
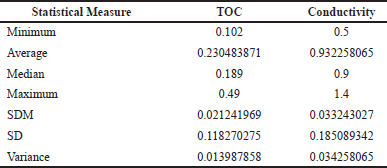 | Table 4. Descriptive summary for TOC and electrical conductivity in water for injections. [Click here to view] |
CONCLUSION
Physical–chemical parameters of water for pharmaceutical purposes were reported, exposing the results obtained from the analysis of TOC and electrical conductivity through statistical methods to inspect the quality of purified water and water for injections. Some of the electrical conductivity values showed points above the USL, requiring the opening of an RAF to investigate the possible deviations that caused the change in these values. The results presented open future perspectives regarding the rigor of the need for maintenance and qualification in the equipment of the quality control laboratory and to establish the validity of the system of purification, storage, and distribution of the water used in pharmaceutical industries, contributing to the improvement of the quality of the water used as a vehicle in pharmaceutical formulations.
AUTHOR CONTRIBUTIONS
All authors made substantial contributions to conception and design, acquisition of data, or analysis and interpretation of data; took part in drafting the article or revising it critically for important intellectual content; agreed to submit to the current journal; gave final approval of the version to be published; and agree to be accountable for all aspects of the work. All the authors are eligible to be an author as per the international committee of medical journal editors (ICMJE) requirements/guidelines.
FUNDING
There is no funding to report.
CONFLICTS OF INTEREST
The authors report no financial or any other conflicts of interest in this work.
ETHICAL APPROVALS
This study does not involve experiments on animals or human subjects.
DATA AVAILABILITY
All data generated and analyzed are included within this research article.
PUBLISHER’S NOTE
This journal remains neutral with regard to jurisdictional claims in published institutional affiliation.
REFERENCES
Alves RBT. Qualidade e diversidade microbiana da água obtida pelo sistema de purificação instalado no prédio dos laboratórios de qualidade e segurança de alimentos. dissertation, Curso de Pós-Graduação em Ciências e Tecnologia de Alimentos/UFV, Viçosa, Brazil, p 84, 2013.
ANVISA. Agência Nacional de Vigilância Sanitária. Farmacopeia Brasileira. 6ª edition, ANVISA, Brazil, 2019a.
ANVISA. Agência Nacional de Vigilância Sanitária. RDC n 301/2019. Dispõe sobre as Diretrizes Gerais de Boas Práticas de Fabricação de Medicamentos. ANVISA, Brazil, 2019b.
ANVISA. Agência Nacional de Vigilância Sanitária. Guia de Qualidade para Sistemas de Purificação de Água para Uso Farmacêutico. ANVISA, Brazil, 2013.
APHA. Standard Methods for the examination of water and wastewater. 21a edition, American Public Health Association, Washington, DC, 1082 p, 2005.
Benedetti S. Avaliação do teor de carbono orgânico total na qualidade da água: aplicação na radiofarmácia. dissertation, Instituto de Pesquisas Energéticas e Nucleares/USP, São Paulo, Brazil, 2012.
Brandão IAP. Validação do sistema de água purificada na indústria farmacêutica monography. Fundação Oswaldo Cruz, Rio de Janeiro, Brazil, 69 p, 2015.
BRASIL. Ministério da Saúde. In: Guia de Qualidade para Sistemas de Purificação de Água para Uso Farmacêutico. Agência Nacional de Vigilância Sanitária, Brazil, 2013.
BRASIL. Ministério do Meio Ambiente. In: Consumo sustentável: manual de educação. Ministério do Meio Ambiente, Brasília, Brazil, 2005.
Carvalho PLN, Abjaude SAR, Hipolito TMM, Lopes AR, Nascimento LC, Veiga SMOM. Água purificada para laboratório: qualidade microbiológica, formação de biofilme e uso do ozônio como sanificante alternativo. Revista da Universidade Vale do Rio Verde, Minas Gerais, Brazil, 10(2), pp 260–9, 2013; doi:10.5892/ruvrv.2012.102.260269 CrossRef
Cesário BC. A qualidade do sistema de purificação de Água para uso farmacêutico. IX Congresso Nacional de Excelência em Gestão, Rio de Janeiro, Brazil, 2013.
Clementino MRA, Neto PJR, Alencar JRB. Carbono orgânico total: metodologia analítica e aplicações para indústria farmacêutica. Rev Bras Farm, 2008; 89(1):74–80.
Conrado MFL, Cordeiro PPM. Gestão farmacotécnica magistral. Dachshund, Balneário Camboriú, Santa Catarina, Brazil, 646 p, 2006
Estatcamp. Software Action. Estatcamp-Consultoria em estatística e qualidade; BR. Estatcamp, São Carlos, Brazil, 2014.
da Silva AS, Severo AAL, Dutra RCC, de Lira RGP, Clementino MRA, Carvalho ALM. Revalidação de um sistema de tratamento de água: ações estratégicas da garantia de qualidade em uma indústria farmacêutica. Rev Bras Farm, 2008; 89(2):168–71.
dos Santos MJM, dos Santos VS, Alves FKS, de Oliveira HF. Alterações das características físico-químicas da água mineral no processo de industrialização. Rev Bras Inic Cient, 2017; 4(2):21–35.
Fatta D, Achilleos A, Nikolaou A, Meriç S. Analytical methods for tracing pharmaceutical residues in water and wastewater. Trends in Anal Chem, 2007; 26(6):515–33. CrossRef
Gaur S, Joshi MC, Saxena SK, Dutt HK. Analytical study of water safety parameters in ground water samples of Uttarakhand in India. J Appl Pharm Sci, 2011; 01(09):166–9.
Kataoka H. New trends in sample preparation for clinical and pharmaceutical analysis. Trends in Anal Chem, 2003; 22(4):232–44; doi:10.1016/S0165-9936(03)00402-3 CrossRef
Montgomery DC. Introdução ao Controle Estatístico da Qualidade. 4th edition, LTC, Rio de Janeiro, Brazil, 2014.
Moreira TDM. Análise físico-química de água para injetáveis em uma indústria farmacêutica do centro-oeste de minas gerais. monography, Faculdade de Filosofia Ciências e Letras do Alto São Francisco, LUZ, Brazil, p 51, 2017.
Moreno AH, Tozo GCG, Salgado HRN. Avaliação da qualidade da água purificada em farmácias magistrais da região de São Jose do Rio Preto. Rev Ciênc Farm Básica e Apl, 2011; 32(1):69–75.
Petrovic M, Gonzalez S, Barceló D. Analysis and removal of emerging contaminants in wastewater and drinking water. Trends in Anal Chem, 2003; 22(10):685–96; doi:10.1016/S0165-9936(03)01105-1 CrossRef
Pimenta AM, Montenegro MCBSM, Araújo AN, Calatayud JM. Application of sequential injection analysis to pharmaceutical analysis. J Pharm Biomed Anal, 2006; 40:16–34; doi:10.1016/j.jpba.2005.10.006 CrossRef
Porto PCC. Requalificação de performance do sistema de água em uma indústria farmacêutica. monography, Instituto de Tecnologia em Fármacos/Farmanguinhos, Rio de Janeiro, Brazil, 67 p, 2017.
Trick JK, Stuart M, Reeder S. Contaminated groundwater sampling and quality control of water analyses. Environ Geochem, 2008; 29–57; doi:10.1016/B978-0-444-53159-9.00003-6 CrossRef
Schymanski EL, Singer HP, Slobodnik J, Ipolyi IM, Oswald P, Krauss M, Schulze T, Haglund P, Letzel T, Grosse S, Thomaidis NS, Bletsou A, Zwiener C, Ibanez M, Portoles T, de Boer R, Reid MJ, Onghena M, Kunkel U, Schulz W, Guillon A, Noyon N, Leroy G, Bados P, Bogialli S, Stipanicev D, Rostkowski P, Hollender J. Non-target screening with high-resolution mass spectrometry: critical review using a collaborative trial on water analysis. Anal Bioanal Chem, 2015; 407:6237–55; doi:10.1007/s00216-015-8681-7 CrossRef
Sumanth TN, Moin A. Pharmaceutical water system-validation aspects. J Chem Pharm Res, 2015; 7(4):42–48.
USP. The United States Pharmacopeia. National formulary. United States Pharmacopeial Convention, Rockville, MD, 2017.