
INTRODUCTION
Osteoarthritis (OA) is a complex condition characterized by cartilage degeneration with pain and inflammation signs. OA is a widely spread joint disease (10% of men and 18% of women over 60 years of age), having a multifactorial etiology including joint injury, obesity, aging, and heredity (Zhuo et al., 2012). Diacerein (DCN) is a semisynthetic anthraquinone derivative used as a symptomatic slow-acting drug for OA. Its active metabolite Rhein inhibits the synthesis and release of interleukin-1 (IL-1) (Mahajan et al., 2006). Vesicles are self-contained structures surrounded at least by one lipid bilayer. Phospholipid vesicles [niosomes, liposomes (LPS), ethosomes, cubosomes, and proliposomes (PLS)] can fuse with the cell membrane serving as containers transporting substances inside and outside the cell or between organelles like hormones, proteins, neurotransmitters, and waste. These properties make their use as a promise drug delivery technique very effective in delivering active moieties to the site of action, reducing systemic side effects, and controlling drug release. LPS are spherical-shaped microscopic lipid vesicles sized from 10 nm or a few micrometers. LPS are composed of one or more phospholipid bilayers that greatly resemble cell membranes with phospholipids as the main building block. Cholesterol is commonly used to increase membrane rigidity (Lian and Ho, 2001). Both polar and nonpolar active ingredients can be entrapped since LPS are amphiphilic, where the polar one is entrapped in the core of the vesicles and nonpolar ones are entrapped within the membrane (Maherani et al., 2011). The enhanced drug delivery from LPS can be achieved in several ways, namely, designing thermolabile, pH-sensitive, photosensitive, and antibody-coated vesicles or by utilizing external stimuli such as ultrasound or magnetic field (Mura et al., 2013). LPS stability, entrapment efficiency (EE), and drug release are affected by many factors such as temperature, as the physical instability of stored LPS is strongly increased when the temperature increases from 4°C to 25°C (Anderson and Omri, 2004). PLS are dry, free-flowing granular products composed of water-soluble porous powder and phospholipids, which, upon hydration or contact with biological fluids, disperse, forming an LPS suspension. The oral route of drug administration is accompanied by poor drug bioavailability of poorly soluble drugs, poor permeability across the gastrointestinal tract membrane, or drugs subjected to the first-pass effect. Therefore, we aimed to fabricate a novel oral PLS of the selected drug model DCN (Malam et al., 2009). DCN is classified as Biopharmaceutics classification system Class II with low solubility and high permeability. DCN is sparingly water-soluble (3.197 mg/l), which results in a poor dissolution rate with low oral bioavailability (35%–56%) with a short half-life (4 hours). The increase in the aqueous solubility of DCN should result in increased bioavailability (Elsayed et al., 2014).
MATERIALS AND METHODS
Materials
DCN was kindly provided by Global Napi Pharmaceutics, Egypt. Soy phosphatidylcholine and Rhein were purchased from Carlo Erpa Reagents, Spain. Cholesterol, mannitol, and sorbitol were obtained from Pratap Chemical Industries Pvt. Ltd., India. Avicel ph 101 was obtained from Pharma Pharmaceutical Chemicals, Egypt. Potassium dihydrogen orthophosphate anhydrous, magnesium stearate, and dipotassium hydrogen orthophosphate anhydrous were obtained from Elnasr Pharmaceutical Chemical Co., Cairo (Egypt). Dicetyl phosphate (DCP) and stearyl amine (SA) were purchased from Fluka (Steinheim, Germany). Eudragit RS100 and ethyl cellulose were supplied by Fluka Chemika, Switzerland. Acetonitrile and methanol [high performance liquid chromatography (HPLC) grade] were purchased from Merck-Scratchcard, Germany. All the reagents used were of analytical grade.
Fabrication of DCN PLS
DCN/PLS powders were fabricated using a vacuum rotary evaporator (RE200, Bibby Sterling Ltd., England) using variable concentrations of soy phosphatidyl choline (SPC), mannitol, sorbitol, Avicel ph 101, DCP, and SA (Table 1). The selected formulations were prepared using different carrier powders (sieved with 80 #) in a round bottom flask heated at 60°C–70°C and rotated under a vacuum at 100 rpm for complete carrier drying for 30 minutes. Weighed amounts of DCN, cholesterol, SPC, and charge inducer were dissolved in a 10 ml mixture of 8:2 v/v chloroform/methanol. Five milliliters of the organic solvent mixture were added to a round bottom flask (100 ml) containing sorbitol at 37°C. The remaining 5 ml of the solvent was used after full drying. The flask containing PLS was placed overnight in a vacuum desiccator and then sieved with 60 #. The PLS powder was transferred into glass vials and sealed for further characterization of the formulations (Chime et al., 2013).
Characterization of DCN/PLS
Micromeritics of DCN/PLS powders
Flow properties of the prepared powder DCN/PLS were evaluated by their angle of repose investigation utilizing the fixed funnel method (Goyal et al., 2012). In brief, a glass funnel was fixed at a height of 5 cm above a white paper placed on a horizontal surface. The powder (4 g of the sample) was poured carefully through the funnel to form a heap on the horizontal surface. The angle of repose was then calculated by measuring the height of the heap (h) and the diameter of its base (D). The angle of repose (θ) was calculated as follows: tan θ = 2h/D.
Drug content and percentage yield (% yield)
A total of 100 mg of DCN/PLS was taken in a 50 ml volumetric flask containing 5 ml methanol and allowed to dissolve for DCN extraction from PLS. Aliquots of 5ml of the previous solution were further diluted with the selected media (Rahamathulla et al., 2020). Then, the drug concentration was determined spectrophotometrically (UV-1601, Shimadzu Co., Japan) by measuring absorbance at 258 nm. The weight of DCN/PLS and their initial components were used for the calculation of % yield of PLS using the following equation:
 | Table 1. Composition of different DCN/PLS formulations. [Click here to view] |
% yield = mass of PLS/mass of initial components × 100.
Vesicle size, zeta potential, and polydispersion index (PI)
The liposomal suspension was prepared with Phosphate buffer solution (PBS), pH 7.4. The dynamic light scattering method was used to measure the size of the prepared formulations. The vesicles particle size and zeta potential were measured using Zetasizer (Malvern Zetasizer 300 HAS, Malvern Instruments, UK) at 25°C. PI was also determined as a measure of particle size homogeneity for the prepared formulations (Okafor and Aigbavboa, 2019).
Entrapment efficiency (EE)
EE was determined using the ultracentrifugation technique. A liposomal suspension in PBS, pH 7.4, was centrifuged at 15,000 rpm for 1 hour (Biofuge, Primo Heraeus, Germany) (El-Shenawy et al., 2020). The amount of DCN was analyzed in the filtered supernatant using the spectrophotometric method, and EE % was calculated utilizing the following equation:
% EE = total DCN amount – free dissolved DCN/total DCN amount × 100.
In vitro drug dissolution study
The rate of DCN dissolution from the prepared PLS compared to pure DCN was studied according to United States Pharmacopoeia (USP) specification (dissolution test apparatus, SR II, six flasks, paddle type, Hanson Research Co., USA). The dissolution medium was 900 ml of PBS, pH 7.4, maintained at 37°C±1°C, and stirred at 100 rpm (Gu et al., 2017). Aliquots of 5 ml were withdrawn at a specific time interval for 12 hours and replaced by a fresh dissolution medium. The dissolved DCN amount was determined spectrophotometrically at 258 nm. The test was performed in triplicate, and the mean ± SD was recorded.
In vitro dissolution profile comparison
The comparison of in vitro dissolution profiles was based upon the independent model (difference factor, f1). f1 is the percent (%) variance between the graphical lines at different time points.
Scanning electron microscopy (SEM)
The surface morphology of PLS formulations was investigated by SEM. A drop of the selected LPS suspension was mounted on a clear glass stub, air-dried and coated with a polaron E 5100 sputter coater, and visualized under SEM (JSM-5400LV-SEM, Jeol, Japan) (Gu et al., 2017).
Fourier transform infra-red (FT-IR) spectroscopy
The FT-IR spectra were investigated from 4,000 to 400 cm−1. DCN, excipients, and selected PLS samples were dispersed in potassium bromide and compressed into discs (IR- 47, Shimadzu, Kyoto, Japan) (Barupal et al., 2010).
Differential scanning calorimetry analysis (DSC)
The DSC thermograms of the prepared pure DCN, cholesterol, SPC, sorbitol, the selected PLS, and its physical mixture were recorded (Barupal et al., 2010). Briefly, 2.5 mg samples were placed in aluminum pans and sealed with pierced lids. The thermal behavior of the samples was investigated in temperature ranges 0°C–500°C by heating at 10°C/minute under a purge of nitrogen (DSC-50, Shimadzu Co., Japan).
Powder X-ray diffractometry (PXRD) studies
The X-ray diffraction patterns for different samples were determined using the Philips 1710 automated diffractometer. The relation was provided by CuKa radiation operating at 40 kV and a current of 30 mA (l Ka = 1.5418 Å). Standard polycrystalline silicon was used for system calibration. The differential behaviors were achieved using continuous scan mode with 2q ranging from 4° to 60°. The data gained were illustrated by 2q, dÅ, and intensities were determined via the microprocessor of the PW1710 (Barupal et al., 2010).
Stability study
The selected DCN/PLS (PLS-F16) (as a powder or in hydrated form) was tested at different storage conditions (4°C ± 0.5°C, 25°C ± 2°C/60% RH, and accelerated storage condition, 40°C/75% RH) for 6 months to explore any changes in the selected parameters. Samples of the powder and the vesicles suspension were withdrawn at specified periods for 6 months and analyzed for drug content. PLS-F16 dissolution pattern was investigated through a stability study. Hydrated PLS-F16 was tested for any physical changes such as vesicles size and EE (Bhama, 2016).
Preparation of DCN/PLS controlled-release (CR) tablets
CR tablets containing selected DCN/PLS were prepared by the direct compression method. The compositions of different formulations were weighed as listed in Table 2; all the ingredients were sieved through #80. All the ingredients except magnesium stearate were mixed in a porcelain mortar for 30 minutes. Then powder blends were further mixed with magnesium stearate, and then the powders of different formulations were directly compressed into tablets.
Postcompression DCN/PLS/CR tablets evaluation
Uniformity of weight
This test was carried out by random sampling and weighing 10 tablets individually. The average weight was calculated. The mean ± SD was determined.
Drug content
Ten tablets were weighed individually and powdered. The drug content was calculated and expressed as a percentage of labeled claims according to USP specifications. The test was done in triplicate. The data were represented as the mean ± SD.
Percentage friability and hardness
DCN/PLS/CR tablets friability was measured using Roche Friabilator. The hardness of each tablet was measured using a Monsanto tablet hardness tester. The mean hardness of 10 tablets was calculated and reported. The mean ± SD was listed (Tulbah et al., 2015).
In vitro release
The in vitro release study of DCN from the selected CR tablets was carried out according to the USP dissolution II basket method at a rotation speed of 100 rpm in 900 ml of release medium at 37°C ± 1°C. The release study was carried out at pH 1.2 medium for 2 hours followed by PBS, pH 6.8, for the following 10 hours. The samples were withdrawn at specific time intervals, and DCN was assayed spectrophotometrically at 258 nm (Karn et al., 2014). DCN/PLS/CR tablets release pattern was compared to the oral marketed DCN capsules (Articu-safe®).
In vivo assessment
In vivo studies were carried out on Albino New Zealand rabbits using the prepared DCN/PLS/CR tablets (PT-F10) and DCN marketed capsules Articu-safe®. The DCN active metabolite, Rhein, was assessed utilizing the HPLC technique. Pharmacokinetic parameters of Rhein, including Cmax and Tmax, were estimated. Areas under the plasma concentration-time curves from zero to end of sampling time (AUC0–24) were calculated using the trapezoidal method. An area under the plasma concentration-time curve from zero to infinity (AUC0–∞) was also determined. All parameters were presented as mean ± SD. The statistical significance of differences between the pharmacokinetic parameters of the tested DCN/PLS/CR tablets and marketed DCN oral Articu-safe® capsules was calculated via the one-way analysis of variance with a 95% confidence interval (Arregui et al., 2018). We have used the New Zealand white rabbit as the model owing to its ease of handling and suitable size. It is easy to give the rabbit the prepared and investigated dosage forms. Also, the size of the rabbit makes it possible to draw sufficient blood samples.
Animal treatment
Nine healthy Newzeland rabbits with an average body weight of 2.25 kg were used. They had free access to water and were housed at room temperature. The animals were prevented from food for 24 hours before administration of CR tablets and capsules and blood sampling. The rabbits were divided into three groups. Group A was given nothing. Group B was given oral marketed DCN capsules (Articu-safe®, 10/200 g body weight/day) using a stomach tube. Group C was given the selected DCN/PLS/CR tablet (PT-F10) using a stomach tube (after calculation of animal dose, 10/200 g body weight/day). 2 ml blood samples were withdrawn from the marginal ear vein at different time intervals to 24 hours after administration. The blood samples were transferred into 5 ml centrifuge tubes charged with heparin and centrifuged at 4,000 rpm for 10 minutes. The resultant plasma was separated and stored at −20°C for subsequent assessment (Hill et al., 2009).
HPLC analysis of Rhein
The chromatographic system (HPLC, JASCO Corporation, Tokyo, Japan) is equipped with an HPLC pump (PU-980), an autosampler injector, and a photodiode detector (UV/visible). Separation was performed on the Peerless LC-C18/RP column (Germany) with 250 mm (length) × 4.6 mm (diameter), charged with octadecyl silane (5 μm particle) (Yaroshenkoa et al., 2014). The chromatographic conditions were as follows: mobile phase:acetonitrile/0.5% formic acid water (70:30 v/v) (prepared daily and degassed before use), column:Peerless LC-C18 column (250 × 4.6 mm, 5 μm), flow rate: 1.0 ml/minute, injection volume: 40 μl, detection: UV, at 258 nm, and column temperature: 35°C (El-Shenawy et al., 2017).
Sample preparation
Plasma was separated by centrifugation at 5,000 rpm for 10 minutes, and supernatant plasma samples were stored in the refrigerator (Beko, Turkey) at −20°C until assayed. Extraction was achieved by adding 5 ml of ethyl acetate and again thoroughly mixing for 5 minutes, followed by centrifugation at 1,600 rpm for 15 minutes, and the supernatant was transferred to a new set of labeled Eppendorf tubes. The solvent was evaporated to complete dryness at 40°C under a nitrogen stream. The dried extracts were hydrated with 100 µl of the mobile phase [acetonitrile/0.5% formic acid water (70:30 v/v)]. The resultant solutions were shacked and filtrated through 0.22 μm filter paper before transferring into autosampler vials. A 40 μl sample solution was injected and analyzed for the Rhein concentration by HPLC. Blank plasma samples were prepared by the same procedure steps (Rahman et al., 2011). The data were listed as mean values ± SD.
Statistical analysis
Similarity test, f2, was performed for the pharmacokinetic parameters to investigate the statistical differences between the tested DCN CR tablets and the marketed DCN using a statistical computer program (Gide et al., 2014).
RESULTS AND DISCUSSION
Fabrication of DCN PLS
Primary practical trials were conducted to study the effect of variation in SPC, carriers, cholesterol, DCP, and SA proportions on LPS vesicle size, EE, and in vitro dissolution of DCN rate. The trials revealed that SPC proportions less than 1:0.5, drug/SPC failed to form a vesicle, and the one higher than 1:4, drug/SPC has resulted in vesicles with sizes in the micrometer range (1,327 nm). Different carriers in a proportion less than 5 showed nonsignificant enhancement in DCN dissolution rate (0.617, 0.421, and 0.350 folds with four portions of Avicel ph101, mannitol, and sorbitol, respectively). The cholesterol proportion was constantly based on Rahamathulla et al., 2020. They used different cholesterol proportions and concluded that there was no significant effect on vesicle EE by variation in cholesterol proportions. The results of primary trials also showed that DCP and SA proportions below and above the used one (Table 1) were of nonsignificant improvement of vesicle EE and zeta potential. Based on the results obtained from the primary trials, the optimized DCN loaded PLS were fabricated according to Table 1.
PLS powder flowability
Flow properties of the prepared DCN/PLS powder formulations were evaluated by determining their angle of repose. The angle of repose (Table 4) was found to be in the range of 11.78 ± 2.3 to 27.18 ± 0.99, which indicated that their flowability was satisfactory. From the pharmaceutical industry’s point, the θ below 40 is an indication of the good flowability of powders (Xu et al., 2018).
 | Table 2. Composition of different batches of DCN/PLS/CR tablets. [Click here to view] |
 | Table 3. DCN/PLS/CR tablets characterization parameters. [Click here to view] |
 | Table 4. Characterization parameters of DCN/PLS powder formulations. [Click here to view] |
Drug content and % yield
Table 4 shows that the DCN amount in all the prepared PLS ranged between 93.23% and 99.12% as a maximum for PLS-F15. DCN has been distributed uniformly in all prepared PLS formulations (Rabanel et al., 2019). The % yield has been calculated after the film deposition has been completed and removed from the rounded flasks. The % yield was less than 100% indicating loss during the formulation process. Data represented in (Table 4) shows that PLS-F16 had the highest % yield of 81.30%.
DCN liposomal vesicle size
After hydration of the DCN/PLS powder with distilled water, LPS vesicles size was measured. The average particle size of DCN loaded LPS formulations is presented in Table 4 and illustrated in Figure 1. The mean vesicle size of the LPS formulations was in the range of 114.27 ± 15.58–533.3 ± 20.50 nm. The LPS formulation PLS-F13 containing DCN:SPC:cholesterol in the ratio of 1:4:0.1, 0.3% DCP, and five parts of sorbitol as a carrier showed the smallest vesicle size (114.27 nm), and PLS-F1 had the largest size (533.3 nm) containing DCN:SPC:cholesterol in the ratio of 1:0.5:0.1 and 20 parts of Avicel ph101 as a carrier (without charge inducer). The vesicle size was significantly differed based on the carrier used and SPC ratio. The results showed that the higher concentration of the carrier with a low concentration of SPC has resulted in the aggregation of particles (a higher amount of SPC will prevent aggregation of the particles) (Bai et al., 2011). DCN/LPS average size was consistent and large throughout the different SPC ratios employed in the PLS fabrication when no surface charge modifier was added to the formulation (239.47 ± 11.30 to 533.3 ± 20.50 nm). The addition of surface charge modifiers to the formulation resulted in changes in particle size where the smallest average size (114.27 ± 15.58 nm) was noted by the addition of 0.3 parts of DCP. DCN/PLS formulations with 0.5 and 1 parts of SA showed particle sizes of 320.54 ± 12.45 and 128.12 ± 17.90 nm, respectively (Diab et al., 2015).
Polydispersion index (PI)
PI values reflect the size homogeneity of the LPS vesicles. Heterogeneous size distribution may result in irregular pharmacokinetic parameters, which affect the drug diffusion and, subsequently, its therapeutic efficacy (Janga et al., 2012). The obtained PI values of the characterized DCN/PLS formulations lie between 0.109 and 0.462. The results confirmed that all the fabricated LPS are of satisfying homogenous size distribution.
Zeta potential of LPS vesicles
The type of charge present in the prepared DCN/PLS was determined using zeta potential. The hydrated DCN/PLS formulations will be thus stable due to the presence of the zeta potential (Junyaprasert et al., 2008). Table 4 shows the measured zeta values of all formulations of DCN/PLS between –13.5 ± 0.1.232 (PLS-F9) and +32.1 ± 1.116 mV (PLS-F16). The observed potential of negative zeta in the prepared DCN/PLS formulations is due to the negative charge of SPC (without charge inducer incorporation). Zeta values of the investigated LPS are charged enough to prevent vesicles aggregation (diverse LPS lamellae are repulsed) (Junyaprasert et al., 2008). An increase in the surface charge was also denoted raising the zeta potential readings from –38.5 (PLS-F12) up to –42.4 and –46.1 mV for formulations PLS-F13 and PLS-F14, respectively, by increasing DCP concentration from 0.3% to 0.6%. SA (cationic lipid) was added in different ratios (0.5% and 1%) to provide a positive charge on the surface of hydrated PLS (Hosny, 2010). Positively charged DCN/LPS achieved the highest levels of EE, reaching 79.52% and 91.13% when 0.5% and 1% of SA were added, respectively. The resultant surface charge of hydrated PLS by SA reversed the negative charge imparted naturally by SPC, reaching values of +15.7 and +32.1 mV for formulations PLS-F15 and PLS-F16, respectively. Results are summarized in Table 4. Earlier researches suggested that the surface charge on the LPS vesicles has a considerable influence on the drug uptake by the biological membrane (Abraham et al., 2005). The classical LPS carry a powerless charge and are classified to be neutral; henceforth, DCP and SA were included at different concentrations in the formulations (PLS-F13 to PLS-F16) to harvest -ve and +ve charged LPS, respectively (Fig. 2).
 | Figure 1. Vesicle size of DCN/PLS formula (PLS-F16). [Click here to view] |
 | Figure 2. Zeta potential of DCN/PLS formula (PLS-F16). [Click here to view] |
EE of DCN in LPS
The EE of all prepared DCN/PLS formulations is demonstrated in Figure 3. The results showed that the EE is slightly increased with the increase of SPC and the decrease of carrier concentration for all the used carriers with the maximum value for PLS-F12 containing DCN:SPC:cholesterol in the ratio of 1:4:0.1 and five parts of sorbitol as a carrier (38.43 ± 2.57). The effect of the inclusion of charge modifiers (DCP or SA) on EE was therefore investigated in DCN/PLS formulation (PLS-F12), which presented an EE of 38.43% with a mean particle size of 239.47 ± 11.30 nm and zeta potential of –38.5 ± 0.892 mV. Inclusion of DCP, a surfactant (charge inducer) used to grant more negative surface charge to the prepared LPS vesicles, resulted in an increased EE and zeta potential to 67.20% and 71.66% and –42.4 and –46.1 when 0.3 and 0.6 parts were added, respectively. Electrostatic stabilization of the LPS vesicle membrane with an increase in DCP concentration could have resulted in the prevention of vesicles aggregation (Thenge et al., 2017). Furthermore, the effective embracing of DCN (hydrophobic drug) within the vesicle hydrophobic core may enhance drug EE. The highest EE was observed with the positively charged unilamellar LPS (PLS-F15 and PLS-F16) formulated with the addition of SA. SA with different concentrations was included in the liposomal bilayer membranes, rendering the vesicle surface electrically charged. This resulted in repulsion between the bilayers and, subsequently, the distance between the different bilayers would be increased, which appear to be very close to one another in the neutral LPS; consequently, a more significant amount of DCN can be entrapped than in neutral LPS (Ola et al., 2010).
In vitro dissolution study
The in vitro dissolution profiles (Figs. 4 and 5) of DCN from the investigated PLS could be described by a standard biphasic pattern with an initial rapid phase followed by a sluggish, long-term sustained dissolution phase for 12 hours because the LPS membrane is cholesterol stabilized. The initial rapid increase in DCN dissolution as predicted may be attributed to the explosion in the exterior area of LPS due to a free DCN (unentrapped) (Paradkar and Irudayaraj, 2002). We could see an inverse relationship between the EE and the in vitro drug dissolution. The drug has had slower dissolution from PLS-F16 (with the maximum EE) than other PLS formulations. In the first 3 hours, the release of DCN indicated an initial dissolution period with the release of about 17.22% (PLS-F12 with EE of 38.43%) to 48.66% (PLS-F2 with EE of 17.16%) of DCN and a decrease in the dissolution rate afterward. The in vitro drug dissolution profiles of all investigated DCN/PLS (PLS-F1 to PLS-F16) at 12 hours were in between 46.7% and 99.54% for PLS-F16, and PLS-F2, respectively. The results showed that it takes time to dissolve DCN once the PLS is converted to LPS vesicles because the lipid bilayers are stabilized by cholesterol. Therefore, sustained DCN dissolution can be obtained (Nzai and Proctor, 1999). The efficiency of dissolution in PLS for the insoluble DCN drug was improved significantly. DCN dissolution rate was increased by 1.638 (PLS-F16) to 3.492- (PLS-F2) fold, respectively. This could be attributed to the increase in DCN dissolution rate by phospholipid molecules or to the transition of DCN from the crystalline state into an amorphous one that was proved by the DSC and PXRD study. The addition of charge inducers (DCP and SA) significantly affects the percent EE and release rate of DCN from LPS vesicles. The positively charged vesicles showed higher EE and decreased cumulative percent amount dissolved with an increase in SA concentration (Figs. 4 and 5). DCN/LPS vesicles fabricated with DCP showed the same behavior (Mohsin et al., 2011).
 | Figure 3. EE % of DCN/LPS formulations. [Click here to view] |
In vitro dissolution profiles comparison
As shown in Table 4, f1 values ranged from 30.331 to 16.324. The results showed that the f1 value increases proportionally with the dissimilarity between the pure DCN release profiles and the formulated DCN/PLS (Durgesh and Patil, 2014).
Ranking of DCN/PLS formulations
The resultant data of characterization parameters of prepared DCN/PLS formulations was arranged in an ascending manner for the cumulative percent amount released and vesicle size and descending manner for EE to obtain the best DCN/PLS formula that will be used for further investigations. The obtained results showed that PLS-F16 had satisfied characteristics depending on the parameters of characterization.
DCN: excipients compatibility investigation, FT-IR spectroscopy
FT-IR spectra of pure DCN, SPC, cholesterol, sorbitol, selected DCN/PLS formulation (PLS-F16), and PLS-F16 physical mixture were analyzed to detect any interaction between DCN and the used excipients (Fig. 6). The FT-IR spectrum of pure DCN showed characteristic peaks at 3,069.20 cm−1 (C–H, stretch, aromatic), 1,079.01 cm−1 (C–O stretch, ester), 1,678.92 cm−1 (C=O stretch COOH), and 1,768.70 cm−1 (C=O, ester). Cholesterol showed major peaks at 2,932.43 cm−1 (acetyl groups), 2,866.91 cm−1 (symmetric –CH3), and 1,056.81 cm−1 (R–O) (Tita et al., 2014). SPC showed major peaks at 1,740.06 cm−1 (C=O, ester), 2,840.71 cm−1 (C–H), and 2,908.27 cm−1 (CH2). Sorbitol showed a characteristic peak at 3,385.32 cm−1 (O–H). All the characteristic peaks of DCN and excipients were observed in the spectra of PLS-F16 without significant chemical shift or outcrop of new peaks indicating that DCN is compatible with the used excipients (Paradkar and Irudayaraj, 2002).
PXRD
X-ray diffraction study is primarily used to determine the crystallinity of a compound. In the present study, PXRD was anticipated to investigate the physical form of DCN in the fabricated PLS. PXRD of pure DCN, SPC, cholesterol, sorbitol, and PLS-F16 is presented in Figure 7. DCN showed a crystalline pattern as proved by sharp and intense diffraction peaks observed at 2θ of 5.2°, 10.7°, 17.3°, 25.6°, and 27.1° (Fig. 7A), which are similar to peaks reported in the literature. The diffraction pattern of sorbitol (Fig. 7D) showed many sharp peaks indicating its crystalline nature.
 | Figure 4. Cumulative percent DCN amount released (PLS-F1–PLS-F8), compared to pure DCN. [Click here to view] |
The diffractogram of SPC (Fig. 7B) exhibited a big and broad peak at around 20.5°, which indicated the amorphous characteristics of SPC (Yusuf et al., 2019). DCN characteristic peaks were disappeared in the diffractogram of PLS-F16, and the intensity of the remaining peaks was sharply decreased. The decline in the crystallinity of DCN in PLS formulation (PLS-F16) can be attributed to the dispersion of DCN within the PLS in an amorphous form. The transformation of DCN to an amorphous state can be further supported by DSC analysis. The amorphous characteristic of DCN might contribute to the enhanced drug dissolution from the prepared PLS.
DSC
The physical state of DCN in the selected PLS (PLS-F16) was investigated by DSC. It is evident from the DSC thermogram of pure DCN that DCN possesses crystalline behavior as it shows a sharp endothermic peak at 256.1°C, corresponding to its melting point (Fig. 8A). SPC showed peaks (Fig. 8B) at 138.25°C, 145.64°C, 200.88°C, and 267.13°C. Cholesterol showed a sharp peak (Fig. 8C) at 146.22°C. Sorbitol showed a sharp peak (Fig. 8D) at 98.34°C. The endothermic peak of DCN appeared in the thermogram of the physical mixture (Fig. 8E) with a slight shift and disappeared in PLS-F16 (Fig. 8F), indicating the transition of DCN to the amorphous form (Hiremath et al., 2009).
SEM
The surface morphology of pure DCN, hydrated DCN/PLS (PLS-F16), and their corresponding physical mixtures were investigated by SEM, and the images are represented in Figure 9. Figure 9D shows that pure DCN exists in the crystalline form. The same crystalline state was present in the physical mixture of PLS, PLS-F16 (Fig. 9A, B, and C). The absence of a crystalline pattern of DCN in PLS (Fig. 9E) proves the conversion of DCN to an amorphous state (Kim et al., 1985).
Stability testing of the selected formulations
Stability studies were performed to predict the PLS-F16 shelf life by speeding up its degradation. The resultant data are illustrated in Figures 10 and 11 and Table 5. To perform the stability studies, PLS-F16 was prepared in large amounts and stored in tightly closed vials. The hydrated PLS-F16 was also prepared in a large volume and divided into tightly closed vials and stored until investigation. Vesicle size and EE results of the investigated samples are summarized in Table 5. The drug content of the PLS-F16 on day 0 was 95.23% with 128.12 nm and EE of 91.13%. The powder of PLS-F16 stored at different storage conditions was found to be stable after 6 months. However, hydrated PLS-F16 stored for 6 months at different storage conditions showed a slight change in drug content and an increase in vesicle size, indicating possible vesicles aggregation. The results showed that as the storage temperature increased, the size of the vesicles increased and the EE decreased. It could be concluded that PLS is more stable than LPS over the wide range of variation in storage conditions (Song et al., 2020). Moghddam et al. (2016) concluded that the stability testing of DCN niosomes suggests that the vesicles were stable only for 2 months at refrigeration temperature. So, the DCN niosomes dispersion formula should be stored under refrigerated conditions for greater stability. The reason behind higher leakage at higher temperatures may be the higher fluidity of the lipid bilayer at higher temperatures.
Preparation of DCN/PLS CR tablets
DCN/PLS formulations, namely, PLS-F3, PLS-F6, PLS-F9, PLS-F12, and PLS-F16 (with ideal particle size, EE, and adequate in vitro release), were selected to be fabricated as CR tablets with different ratios of two polymers, namely, Eudragit RS100 and ethyl cellulose. Ten CR tablet formulations were prepared and characterized.
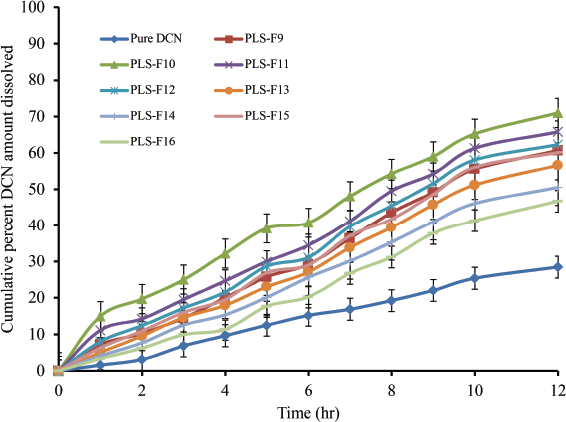 | Figure 5. Cumulative percent DCN amount released (PLS-F9–PLS-F16), compared to pure DCN. [Click here to view] |
 | Figure 6. FT-IR spectra of (A) pure DCN, (B) SPC, (C) cholesterol, (D) sorbitol, (E) PLS-F16 physical mixture, and (F) PLS-F16. [Click here to view] |
 | Table 5. Vesicle size and EE of hydrated PLS-F16 stored at different conditions for 6 months. [Click here to view] |
 | Figure 7. PXRD pattern of (A) pure DCN, (B) SPC, (C) cholesterol, (D) sorbitol, and (E) PL-F16. [Click here to view] |
Postcompression characterization
All formulations were tested for physical parameters like hardness, weight variation, and percentage friability. The results were found to be within the pharmacopoeial limits (Table 3). It was found that the prepared DCN/PLS/CR tablets met the criteria for the drug content uniformity test under the USP 31 specifications. DCN content in all formulations ranged from 90.83% ± 1.243% to 102.63% ± 3.687% of the theoretical label claim. This study indicated that all the prepared formulations showed acceptable values for hardness and % friability, 4.566 ± 0.700 to 6.233 ± 0.450 kg/cm2 and 0.105 ± 0.0672 to 0.648 ± 0.0945, respectively. Tablet weight variation test also showed accepted ranges between 438.2 ± 6.921 and 451.3 ± 4.562 mg.
In vitro release study
The results of the in vitro DCN release study showed the significant effect of used polymers on the release pattern of DCN. Marketed DCN capsules released DCN at a rate of 100% at 3 hours, faster than all DCN/PLS/CR tablets. DCN-PLS/CR tablet formulation batches PT-F2, PT-F4, PT-F6, PT-F8, and PT-F10 (contain EC) showed the powerful capability of DCN release delaying (CR pattern) compared to the formulations fabricated with Eudragit RS100 (Maqbool et al., 2020). PT-F10 (contains 225 mg EC) showed the minimum drug release of 38.2% at 12 hours with maximum CR manner. In vitro DCN release profiles from different CR tablets are illustrated in Figures 12 and 13. PT-F10 was used for the in vivo study in the present investigation.
 | Figure 8. DSC thermograms of (A) pure DCN, (B) SPC, (C) cholesterol, (D) sorbitol, (E) PLS-F4 physical mixture, and (F) PLS-F16. [Click here to view] |
 | Figure 9. Scanning electron microscope images of (A, B, and C) PLS-F16 physical mixture, (D) pure DCN, and (E) hydrated PLS-F16. [Click here to view] |
In vivo assessment
The plasma drug concentration against time profiles after oral administration of PT-F10 and marketed DCN capsules (Articu-safe®) is presented in Figure 14. Results revealed that better absorption was shown by the DCN/PLS/CR tablet (PT-F10). The obtained Cmax of the DCN cap and PT-F10 was 3,679 ± 413.49 and 7,455 ± 262.69 ng/ml, respectively, whereas Tmax was 3 ± 0.458 and 8 ± 0.4 hours, respectively (p < 0.05). AUC0-24 in the DCN cap and PT-F10 were 17,106 ± 307.04 and 74,737.5 ± 448.40 ng.hour/ml, respectively. AUC0–∞ in the DCN cap and PT-F10 were 17,268.55 ± 343.78 and 913,013.7 ± 553.48 ng.hour/ml, respectively. Mean residence time0–∞ for the DCN cap and PT-F10 were 5.388 ± 0.289 and 11.267 ± 0.609 hour, respectively. Cmax/AUC0–24 in the DCN cap and PT-F10 were 0.2150 ± 0.0021 and 0.0997 ± 0.0071 hours−1, respectively. The pharmacokinetic parameters obtained from PT-F10 were significantly different compared to the DCN cap. The significant AUC values observed with the DCN cap and PT-F10 also show that DCN from PT-F10 has increased bioavailability (Cho et al., 2014; Morgen et al., 2012). The higher values of Cmax, Tmax, and AUC0–24 of PT-F10 compared to Articu-safe® capsules (p < 0.05) indicate superior bioavailability of DCN from the investigated DCN/PLS/CR tablet over the ordinary commercial DCN capsules.
 | Figure 10. Percent drug content of stored PLS-F16 and hydrated PLS-F16 at different storage conditions. [Click here to view] |
 | Figure 11. Cumulative percent DCN amount dissolved at 12 hours from stored PLS-F16 at different storage conditions. [Click here to view] |
 | Figure 12. Cumulative percent DCN amount released from DCN/PLS/CR tablets formulations (PT-F1-PT-F5) versus marketed DCN capsules. [Click here to view] |
 | Figure 13. Cumulative percent DCN amount released from DCN/PLS/CR tablets formulations (PTF6- PT-F10) versus marketed DCN capsules. [Click here to view] |
 | Figure 14. Mean plasma concentration-time curves of DCN after oral administration of PT-F10 or Articu-safe® capsules to Albino New Zealand rabbits. [Click here to view] |
CONCLUSION
Within our present study, a positively charged PLS formulation for oral administration of DCN was successfully developed utilizing film deposition/direct compression methods with enhanced dissolution rate and oral bioavailability of DCN. The used ratios of SPC, carrier, and charge inducer predominantly affected vesicle size, EE, and cumulative percent DCN amount released. A DCN/PLS formula (PLS-F16) (contains SA as charge inducer) with a surface charge of + 32.1 mV offered a high encapsulation of 91.13% with a particle size mean of 128.12 nm and slow DCN release through 12 hours (46.7%). Moreover, PLS-F16 was more stable than LPS over the wide range of variation in storage conditions. Oral delivery of DCN by CR tablets showed that increased DCN bioavailability with high levels of DCN (compared to DCN commercial capsules) was found in Albino New Zealand rabbit’s plasma. Finally, positively charged DCN/PLS is capable of protecting and delivering high concentrations of highly metabolized drugs such as DCN.
ACKNOWLEDGMENTS
The authors are grateful to the Research Laboratory of Pharmaceutics and Pharmaceutical Technology Department, Faculty of Pharmacy, Al-Azhar University, Assiut, for the financial support and their efforts to finish this work. They are also grateful to Al-Azhar Centre of Nanosciences and Applications, Al-Azhar University, Assiut, Egypt.
FUNDING
The Research Laboratory of Pharmaceutics and Pharmaceutical Technology Department, Faculty of Pharmacy, Al-Azhar University, Assiut, for the financial support.
CONFLICT OF INTERESTS
The authors declare no conflicts of interest regarding the publication of this paper.
ETHICAL APPROVAL
The procedures were approved by the Animal Ethics Committee of Zagazig University, Faculty of Pharmacy, Zagazig, Egypt (Approval No. ZU-IACUC/8/C/111/2021).
DATA AVAILABILITY
All data generated and analyzed are included within this research article.
PUBLISHER’S NOTE
This journal remains neutral with regard to jurisdictional claims in published institutional affiliation.
REFERENCES
Abraham SA, Waterhouse DN, Mayer LD, Cullis PR, Madden TD, Bally MB. The liposomal formulation of doxorubicin. Methods Enzymol, 2005; 391:71–97. CrossRef
Anderson M, Omri A. The effect of different lipid components on the in vitro stability and release kinetics of liposome formulations. Drug Deliv, 2004; 11:33–9. CrossRef
Arregui JR, Kovvasu SP, Betageri GVJAP. Daptomycin proliposomes for oral delivery: formulation, characterization, and in vivo pharmacokinetics. AAPS PharmSciTech, 2018; 19(4):1802–9. CrossRef
Bai C, Peng H, Xiong H, Liu Y, Zhao L, Xiao X. Carboxymethylchitosan-coated proliposomes containing coix seed oil: characterisation, stability and in vitro release evaluation. Food Chem, 2011; 129(4):1695–702. CrossRef
Barupal A, Gupta V, Ramteke S. Preparation and characterization of ethosomes for topical delivery of aceclofenac. Indian J Pharm Sci, 2010; 72(5):582. CrossRef
Bhama S. Formulation and evaluation of proniosomes for anticancer drugs. JKK Nattraja College of Pharmacy, Kumarapalayam, India, 2016.
Chime SA, Onyishi IV. Lipid-based drug delivery systems (LDDS): recent advances and applications of lipids in drug delivery. Afr J Pharm Pharmcol, 2013; 7(48):3034–59. CrossRef
Cho JH, Kim YI, Kim DW, Yousaf AM, Kim JO, Woo JS, Yong CS, Choi HG. Development of novel fast-dissolving tacrolimus solid dispersion-loaded prolonged release tablet. Eur J Pharm Sci, 2014; 54:1–7. CrossRef
Diab R, Khameneh B, Joubert O, Duval R. Insights in nanoparticle-bacterium interactions: new frontiers to bypass bacterial resistance to antibiotics. Curr Pharm Des, 2015; 21(28):4095–105. CrossRef
Durgesh R, Patil M. Comparison of in vitro dissolution profiles of marketed dicyclomine hydrochloride tablets. Inter J Adv Pharm Sci, 2014; 5(3):2109–19.
Elsayed I, Abdelbary AA, Elshafeey AH. Nanosizing of a poorly soluble drug: technique optimization, factorial analysis, and pharmacokinetic study in healthy human volunteers. Int J Nanomedicine, 2014; 9:2943–53. CrossRef
El-Shenawy AA, Abdelhafez WA, Ismail A, Kassem AAJAP. Formulation and characterization of nanosized ethosomal formulations of antigout model drug (febuxostat) prepared by cold method: in vitro/ex vivo and in vivo assessment. AAPS PharmSciTech, 2020; 21(1):1–13. CrossRef
El-Shenawy AA, Ahmed MM, Mansour HF, Abd El Rasoul SJAP. Torsemide fast dissolving tablets: development, optimization using Box–Bhenken design and response surface methodology, in vitro characterization, and pharmacokinetic assessment. AAPS PharmSciTech, 2017; 18(6):2168–79. CrossRef
Gide MA, Duan JZ, Riviere K, Marroum P. In vivo bioequivalence and in vitro factor (f2) for dissolution profile comparisons of extended release formulations: how and when do they match? Pharm Res, 2014; 28:1144–56. CrossRef
Goyal U, Gupta A, Rana AC, Aggarwal G. Self microemulsifying drug delivery system: a method for enhancement of bioavailability. Int J Pharm Sci Res, 2012; 3(1):66.
Gu Z, Shi X, Omari-Siaw E, Zhu Y, Li H, Guo M, Yang X, Yu J, Xu X. Self-microemulsifying sustained-release pellet of Ginkgo biloba extract: preparation, in vitro drug release and pharmacokinetics study in beagle dogs. J Drug Deliv Sci Technol, 2017; 37:184–93. CrossRef
Hill S, Varker AS, Karlage K, Myrdal PB. Analysis of drug content and weight uniformity for half-tablets of 6 commonly split medications. J Manag Care Pharm, 2009; 15(3):253–61. CrossRef
Hiremath PS, Soppimath KS, Betageri GV. Proliposomes of exemestane for improved oral delivery: formulation and in vitro evaluation using PAMPA, Caco-2 and rat intestine. Int J Pharm, 2009; 380(1-2):96–104. CrossRef
Hosny KM. Ciprofloxacin as ocular liposomal hydrogel. AAPS PharmSciTech, 2010; 11(1):241–6. CrossRef
Janga KY, Jukanti R, Velpula A, Sunkavalli S, Bandari S, Kandadi P, Veerareddy PR. Bioavailability enhancement of zaleplon via proliposomes: role of surface charge. Eur J Pharm Biopharm, 2012; 80(2):347–57. CrossRef
Junyaprasert VB, Teeranachaideekul V, Supaperm T. Effect of charged and non-ionic membrane additives on physicochemical properties and stability of niosomes. AAPS PharmSciTech, 2008; 9(3):851–9. CrossRef
Karn PR, Jin SE, Lee BJ, Sun BK, Kim MS, Sung JH, Hwang SJ. Preparation and evaluation of cyclosporin A-containing proliposomes: a comparison of the supercritical antisolvent process with the conventional film method. Int J Nanomedicine, 2014; 9:5079. CrossRef
Kim KH, Frank MJ, Henderson N. Application of differential scanning calorimetry to the study of solid drug dispersions. J Pharm Sci, 1985; 74(3):283–9. CrossRef
Lian T, HO R. Trends and developments in liposome drug delivery systems. J Pharm Sci, 2001; 90:667–80. CrossRef
Mahajan A, Singh K, Tandon VR, Kumar S, Kumar H. Diacerein: a new symptomatic slow acting drug for osteoarthritis. J Sci, 2006; 8(3):173–5.
Maherani B, Arab-Tehrany E, R Mozafari M, Gaiani C, Linder M. Liposomes: a review of manufacturing techniques and targeting strategies. Curr Nanosci, 2011; 7:436–52. CrossRef
Malam Y, Loizidou M, Seifalian AM. Liposomes and nanoparticles: nanosized vehicles for drug delivery in cancer. Trends Pharm Sci, 2009; 30(11):592–9. CrossRef
Maqbool I, Akhtar M, Ahmad R, Sadaquat H, Noreen S, Batool A, Khan SU. Novel multiparticulate pH triggered delayed release chronotherapeutic drug delivery of celecoxib-β-cyclodextrin inclusion complexes by using Box-Behnken design. Eur J Pharm Sci, 2020; 146:105254. CrossRef
Mohsin M, Hossin A, Haik Y. Thermomechanical properties of poly (vinyl alcohol) plasticized with varying ratios of sorbitol. Mater Sci Eng, 2011; 528(3):925–30. CrossRef
Moghddam SR, Ahad A, Aqil M, Imam SS, Sultana Y. Formulation and optimization of niosomes for topical diacerein delivery using 3-factor, 3-level Box-Behnken design for the management of psoriasis. Mater Sci Eng C Mater Biol Appl, 2016; 69:789–97. CrossRef
Morgen M, Bloom C, Beyerinck R, Bello A, Song W, Wilkinson K, Steenwyk R, Shamblin S. Polymeric nanoparticles for increased oral bioavailability and rapid absorption using celecoxib as a model of a low-solubility, high-permeability drug. Pharm Res, 2012; 29(2):427–40. CrossRef
Mura S, Nicolas J, Couvreur P. Stimuli-responsive nanocarriers for drug delivery. Nat Mater, 2013; 12:991–1003. CrossRef
Nzai J, Proctor A. Soy lecithin phospholipid determination by fourier transform infrared spectroscopy and the acid digest/arseno-molybdate method: a comparative study. J Am Oil Chem Soc, 1999; 76(1):61–6. CrossRef
Okafor C, Aigbavboa C (ed.). Geo-experimental investigation of nsukka sandy sand: an evaluation of its electrochemical properities and angle of repose using the fixed funnl method. In: 14th International Postgraduate Research Conference: Contemporary and Future Directions in the Built Environment, pp 1–570, 2019.
Ola H, Yahiya SA, El-Gazayerly ON. Effect of formulation design and freeze-drying on properties of fluconazole multilamellar liposomes. Saudi Pharm J, 2010;18(4):217–24. CrossRef
Paradkar MM, Irudayaraj J. Determination of cholesterol in dairy products using infrared techniques: 1. FTIR spectroscopy. Int J Dairy Techno, 2002; 55(3):127–32. CrossRef
Rabanel JM, Adibnia V, Tehrani SF, Sanche S, Hildgen P, Banquy X, Ramassamy C. Nanoparticle heterogeneity: an emerging structural parameter influencing particle fate in biological media? Nanoscale, 2019; 11(2):383–406. CrossRef
Rahamathulla M, HV G, Veerapu G, Hani U, Alhamhoom Y, Alqahtani A, Moin A. Characterization, optimization, in vitro and in vivo evaluation of simvastatin proliposomes, as a drug delivery. AAPS PharmSciTech, 2020; 21:1–15. CrossRef
Rahman MM, Roy S, Das SC, Jha MK, Begum T, Ahsan MQ, Islam MS, Reza MS. Evaluation of various grades of hydroxypropylmethylcellulose matrix systems as oral sustained release drug delivery systems. J Pharm Sci Res, 2011; 3(1):930.
Song Ff, Tian Sj, Chen Fs, Sun Xy, Zhang BB. Carboxymethyl chitosan-decorated proliposomes as carriers for improved stability and sustained release of flaxseed oil. J Food Sci, 2020; 85(10):3237–43. CrossRef
Thenge RR, Patond V, Ajmire P, Barde L, Mahajan N, Tekade NJIjoP. Preparation and characterization of co-crystals of diacerein. Indo J Pharm, 2017; 28(1):34. CrossRef
Tita B, Ledeti I, Bandur G, Tita D. Compatibility study between indomethacin and excipients in their physical mixtures. J Them Anal Calorim, 2014; 118(2):1293–304. CrossRef
Tulbah AS, Ong HX, Morgan L, Colombo P, Young PM, Traini D. Dry powder formulation of simvastatin. Expert Opin Drug Deliv, 2015; 12(6):857–68. CrossRef
Xu M, Wang S, Zhang X, Zhang N. Determination of aloe-emodin, rhein, emodin, chrysophanol, and physcione in Qinghuo Tablets by HPLC-FLD. Drug Clin, 2018; 33(12):3107–11.
Yaroshenko IS, Khaimenov AY, Grigoriev AV, Sidorova AA. Determination of Rhein in blood plasma by HPLC with UV detection and its application to the study of bioequivalence. J Anal Chem, 2014; 69(8):793–9. CrossRef
Yusuf H, Nugraheni RW, Setyawan D. Effect of cellulose derivative matrix and oligosaccharide on the solid state and physical characteristics of dimethyl dioctadecyl ammonium liposomes for vaccine. Res Pharm Sci, 2019; 14(1):1. CrossRef
Zhuo Q, Yang W, Chen J, Wang Y. Metabolic syndrome meets osteoarthritis. Nat Rev Rheumato, 2012; 8(12):729–37. CrossRef