
INTRODUCTION
Glucosamine is an amino monosaccharide (Figure 1) (Chen et al., 2006) and is a natural component of cartilage which produces varieties of chemicals involved in the building of tendons, ligament, cartilage, and fluid surrounding the joints (Kirkham and Samarasinghe, 2009). The cartilage breaks down in an osteoarthritis patient (Hag et al., 2003). The glucosamine supplement may either increase the content of the cartilage or inhibit the enzyme destroying the cartilage (Papich, 2016). Therefore, it is a popular over-the-counter nutraceutical supplement frequently combined with chondroitin for the treatment of osteoarthritis and other joint pain (Dasgupta and Klein, 2014). Oral administration of glucosamine has been reported to show the clinical effect of re-establishing the lost cartilage and slowing down the joint deterioration without significant adverse effects (Reginster et al., 2012).
There are several published research studies on the development of an analytical method for the analysis of glucosamine using the HPLC method (Hadad et al., 2012; Harmita et al., 2017; Shao et al., 2004). However, glucosamine lacks chromophore and hence it is a prerequisite to derivatized glucosamine using a suitable derivatizing agent to impart UV-absorbing chromophore so that it can be detected in the UV region (Zhou et al., 2004). As per the literature survey, there is no research carried out for the estimation of glucosamine by infrared spectroscopy. The use of IR spectroscopy for quantitative analysis has several advantages compared to other analytical methods such as HPLC which require the toxic solvent for the operator as well as for the environment (Fahelelbom et al., 2020). The infrared spectroscopy method stands out when there is a need for the replacement of a method that requires the use of a large amount of organic solvents compared to the method that does not use them. This method allows the quantification of substances without the use of any solvent, particularly organic solvents, which makes the method environment-friendly by following the principles of green chemistry.
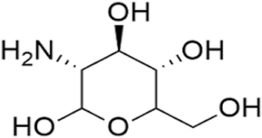 | Figure 1. Chemical structure of glucosamine. [Click here to view] |
This work describes the simple and environment-friendly infrared spectroscopy method as a green tool for the quantification of glucosamine in marketed tablets.
MATERIALS AND METHOD
Instrumentations
The estimation of glucosamine was carried out in a Shimadzu FTIR connected to an IR solution software. A mechanical pellet press machine equipped with a pressure gauge was used to create the thin transparent glucosamine pellets. Other types of equipment used are analytical weighing balance and mortar and pestle. Table 1 presents the FTIR conditions used for the analysis.
Chemical and reagents
Standard glucosamine HCl and glucosamine sulfate potassium chloride tablets 750 mg (Jointace) were purchased from a pharmacy shop. Potassium bromide (KBr) IR grade was also used.
Qualitative analysis
The qualitative analysis of glucosamine was carried out by the KBr method using FTIR in the mid-infrared region. 1 mg of glucosamine standard was weighed and mixed with 100 mg of IR grade KBr using a mortar and pestle. After properly mixing glucosamine and KBr (1:100), a thin translucent pellet was prepared by pressing the mixture under the mechanical pellet press at 10 tons for 2 minutes. The sample was also made in translucent pellets using the same procedure. The transmittance spectra of both standard and sample glucosamine were obtained in the IR solution software in the range of 4000–400 cm−1 in 20 scans. The spectrum of the glucosamine sample obtained was compared with that of the spectra of glucosamine standard to verify the similarity between the two specta.
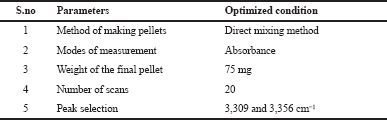 | Table 1. FTIR conditions. [Click here to view] |
Quantitative analysis
Standard calibration curve
For the estimation of glucosamine in the sample, the standard calibration curve was obtained by plotting different concentrations of the standard glucosamine HCl against their absorbance intensity. The different concentrations of glucosamine ranging from 1 to 7%w/w were prepared by homogeneous mixing of glucosamine HCl with KBr. 75 mg of each mixture was pressed in a mechanical press under a pressure of 10 tons for 2 minutes to get a uniform thin translucent pellet. The spectrum of each concentration was obtained in absorbance mode in 20 scans. The absorbance intensity of each concentration at 3309 and 3356 cm−1 wavenumbers was selected which is the characteristic band of glucosamine (amine group). Table 2 shows the parameters of the standard calibration curve obtained.
Estimation of glucosamine in pharmaceutical dosage form
Ten glucosamine tablets (Jointace) were weighed and the average weight was calculated. The tablets were ground into a fine powder. Weight of powder equivalent to 7 mg of glucosamine was weighed and mix thoroughly with 93 mg of KBr. 75 mg of the homogenous mixture was made into a translucent pellet and the absorbance spectrum was measured. The amount of glucosamine in the tablet was determined using Eq. (1) and the percentage of glucosamine content was calculated from Eq. (2) as follows:
where Ca is the concentration of glucosamine in the sample (%w/w), Aa is the absorbance intensity of the sample pellet, Cb is the concentration of glucosamine in the standard, Ab is the absorbance intensity of the standard pellet, and Ct is the theoretical concentration of glucosamine in the sample.
RESULT
Qualitative analysis
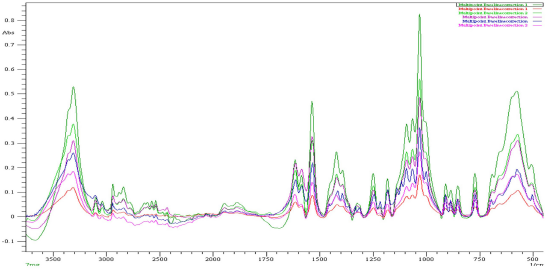
The spectrum of the glucosamine sample obtained was compared with that of the spectrum of the glucosamine standard to verify the similarity between the two spectra. Figure 2 shows an overlay spectrum of the standard glucosamine and glucosamine tablet (Jointace). It is clearly shown that the same absorption band is observed in both spectra. The similarity between the spectra is strongly indicative of the identity of glucosamine in the pharmaceutical marketed tablet.
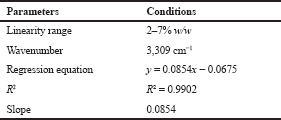 | Table 2. Standard calibration data of glucosamine HCl. [Click here to view] |
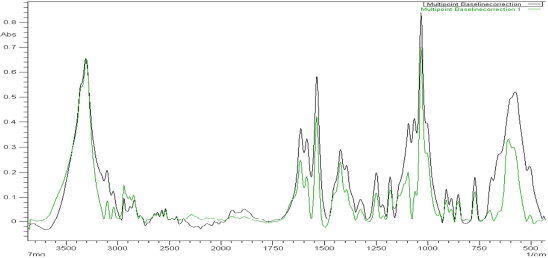 | Figure 2. Overlay spectrum of standard glucosamine HCl and glucosamine tablets (Jointace). [Click here to view] |
 | Figure 3. Overlay spectrum of different concentrations of standard glucosamine HCl. [Click here to view] |
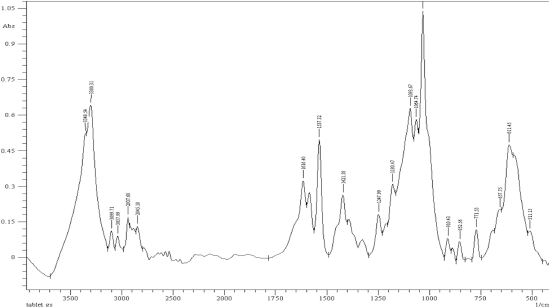 | Figure 4. FTIR spectra of glucosamine tablets (Jointace) in absorbance mode. [Click here to view] |
Quantitative analysis
The absorbance of different concentrations of the standard glucosamine ranging from 2 to 7%w/w was measured at 3309 cm−1 and the overlay spectrum of the standard glucosamine in absorbance mode was established, as shown in Figure 3. The absorbance of the glucosamine tablet was also measured, as shown in Figure 4. A comparison between the absorbance at 3309 cm−1 of both reference standard and glucosamine tablet was carried out and the amount of glucosamine content and percentage purity glucosamine was calculated as shown in Table 3.
Method validation
Linearity
The linearity of the standard glucosamine HCl was carried out in the concentration range of 2–7%w/w. Table 4 shows the linear concentration range and its proportional increase in absorbance. The calibration curve was constructed by plotting the concentration of glucosamine against the absorbance intensity at the 3309 and 3356 cm−1 wavenumbers and all the regression parameters were calculated. Excellent linearity was obtained as indicated by the coefficient correlation value of both wavenumbers as shown in Figures 5 and 6.
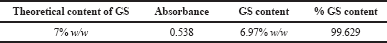 | Table 3. Determination of glucosamine in tablet. [Click here to view] |
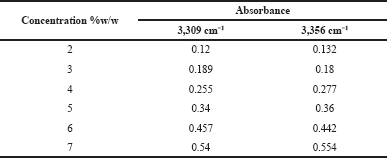 | Table 4. The linearity of the glucosamine HCl. [Click here to view] |
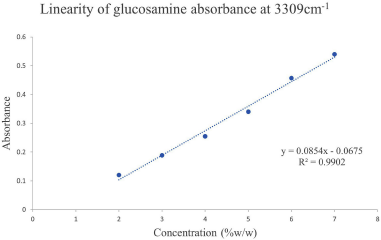 | Figure 5. Calibration curve of glucosamine absorbance at 3309 cm−1. [Click here to view] |
Precision
The precision of the analytical method is the degree of closeness in the measured values. The precision of the proposed method was assessed by the intra-day and inter-day precision studies. The intraday and inter-day precision studies were carried out by measuring the absorbance of glucosamine standards at a concentration 5%w/w in six replicates and the % RSD (Relative standard deviation) was calculated. The result obtained was precise as indicated by the %RSD of 0.431871 and 1.291162 for intra-day and inter-day studies, respectively, as shown in Table 5.
Accuracy
The accuracy of the method is the closeness of the measured value to the actual value. The accuracy of the method was evaluated by calculating the percentage recovery of the glucosamine by standard addition method at 50%, 100%, and 150% levels. 2, 4, and 6 mg standard glucosamine HCl were added to a known amount of the sample, and a pellet of spiked concentration was prepared and absorbance was measured in three replicates. Table 6 shows the accuracy studies where the percentage recovery at all the levels was between 98% and 100%, which indicates that the method is accurate.
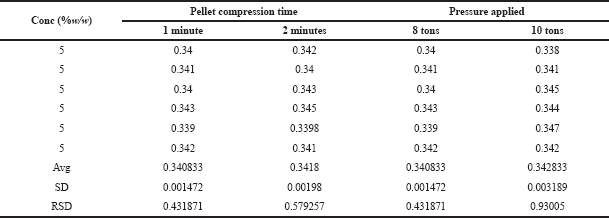
Robustness
The reliability of the method was assessed by the robustness studies. The robustness is the ability of the method to remain unaffected by small changes in the methodology. The robustness of the proposed method was carried out by small deliberate alterations in the parameters, such as time and pressure applied to create the translucent pellet. The %RSD obtained in the study was between 0.4 and 0.9 as shown in Table 7, indicating that the proposed method is reliable.
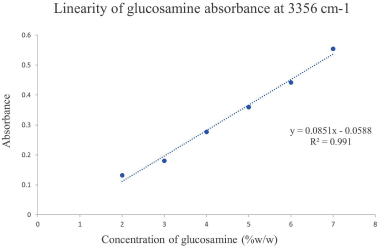 | Figure 6. Calibration curve of glucosamine absorbance at 3356 cm−1. [Click here to view] |
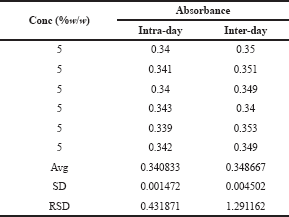 | Table 5. The precision study of glucosamine HCl. [Click here to view] |
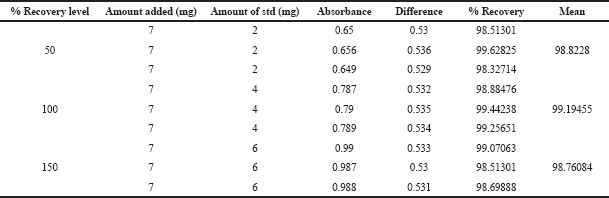 | Table 6. Accuracy study of glucosamine HCl. [Click here to view] |
 | Table 7. Robustness study of glucosamine HCl. [Click here to view] |
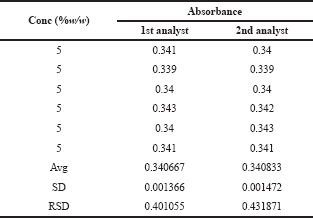
Ruggedness
The reproducibility of the test result was measured by the ruggedness studies. Ruggedness is the ability to remain uninfluenced by alteration in external factors, such as variation in the operation and environmental conditions. The reproducibility of the test result was carried out by the two different analysts and the %RSDs obtained were 0.401055 and 0.431871 as present in Table 8, indicating that the method is reproducible.
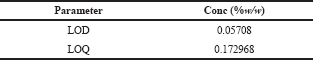
Limit of quantification and limit of detection
LOD (limit of detection) and LOQ (limit of quantification)is the lowest amount of analyte that can be detected and quantified. It is calculated from the slope of the calibration curve and the standard deviation using Equations (3) and (4) as follows:
where σ is the standard deviation and S is the slope of the calibration curve. The LOD and LOQ of the proposed method are presented in Table 9 and the low value of both parameters indicates the high sensitivity of this method.
 | Table 8. Ruggedness study of glucosamine HCl. [Click here to view] |
 | Table 9. LOD and LOQ of the glucosamine HCl. [Click here to view] |
DISCUSSION
The analysis of glucosamine using FTIR as a green analytical tool was accomplished by an environment-friendly method. The FTIR spectrum of glucosamine in bulk and the marketed tablet for the qualitative and quantitative estimation was obtained directly by scanning the pellets obtained from the solid powder of the glucosamine without the use of any solvent, which reduces the solubility challenges of glucosamine.
Glucosamine analysis by UV spectroscopy and HPLC coupled with a normal detector, such as UV and fluorescence detector, requires the derivatization step before the analysis since glucosamine does not contain chromophores or fluorophores that enable the detection of the analyte in the UV-visible region. However, the FTIR method did not depend on the detection in the UV-visible region, eliminating the requirement of an extra derivatization step which is tedious and time-consuming. Therefore, the FTIR method is environment-friendly and economical with a short analysis time.
When the validated parameters for the method developed were evaluated, the method shows excellent linearity as indicated by the regression coefficient value obtained and the %RSD of the validated parameters are below the limit (<2%) signifying that the proposed method is precise, accurate, reproducible, and reliable. The LOQ value obtained acknowledges the high sensitivity of the method.
CONCLUSION
A green analytical method using FTIR spectroscopy in the mid-infrared region for the analysis of the glucosamine was developed and validated. The proposed method was found to be sensitive, accurate, precise, reliable, and reproducible. The novelty of the method arises from excluding the need for the use of any solvent and derivatization step which is requisite for other analytical methods, such as chromatographic and UV spectrophotometric methods, for the analysis of glucosamine. The virtue of the present work includes a simple, fast, economical, and environment-friendly method compared to the other methods. Therefore, it can be used for quality control of routine analysis.
CONFLICT OF INTEREST
Authors declared that they have no conflicts of interest.
FUNDING
None.
REFERENCES
Chen J, Lee Y, Cheng T, Hsiao H, Chen R. Determination of glucosamine content in nutraceuticals by capillary electrophoresis using in-capillary OPA labeling techniques. J Food Drug Anal, 2006; 14:203–6. CrossRef
Dasgupta A, Klein K. Antioxidants in food, vitamins, and supplements: prevention and treatment of disease. The University of Texas, Elsevier Inc, Houston, TX, 2014.
Fahelelbom K, Saleh A, Mansour R, Sayed S. First derivative ATR-FTIR spectroscopic method as a green tool for the quantitative determination of diclofenac sodium tablets. F1000Res, 2020; 9:1–14. CrossRef
Hadad G, Abdel-Salam R, Emara S. Determination of glucosamine and carisoprodol in pharmaceutical formulations by LC with pre-column derivatization and UV detection. J Chromatogr Sci, 2012; 50:307–15. CrossRef
Hag I, Murphy E, Dacre J. Osteoarthritis. Postgrad Med J, 2003; 79;933. CrossRef
Harmita H, Jatmika C, Nugraha M. Determination of levels of glucosamine hydrochloride and chondroitin sulfate in mixtures in tablet and cream forms using high-performance liquid chromatography with fluorescence. Int J Appl Pharm, 2017; 9(1):144–9. CrossRef
Kirkham S, Samarasinghe R. Glucosamine. J Orthop Surg, 2009; 17(1):72–6. CrossRef
Papich MG, Glucosamine chondroitin sulfate. Saunders Handbook of Veterinary Drugs, pp 357–8, 2016, Raleigh, North Carolina. CrossRef
Reginster JY, Neuprez A, Lecart MP, Sarlet N, Bruyere O. Role of glucosamine in the treatment for osteoarthritis. Rheumatol Int, 2012; 32(10): 2959-2967. CrossRef
Shao Y, Alluri R, Mummert M, Koetter U. A stability-indicating HPLC method for the determination of glucosamine in pharmaceutical formulations. J Pharm Biomed Anal, 2004; 35:625–31. CrossRef
Zhou J, Waszkuc T, Mohammed F. Single laboratory validation of a method for determination of glucosamine in raw materials and dietary supplements containing glucosamine sulfate and/or glucosamine hydrochloride by high-performance liquid chromatography with FMOC-Su derivatization. J AOAC Int, 2004; 87(5):1083–92. CrossRef
GRAPHICAL ABSTRACT
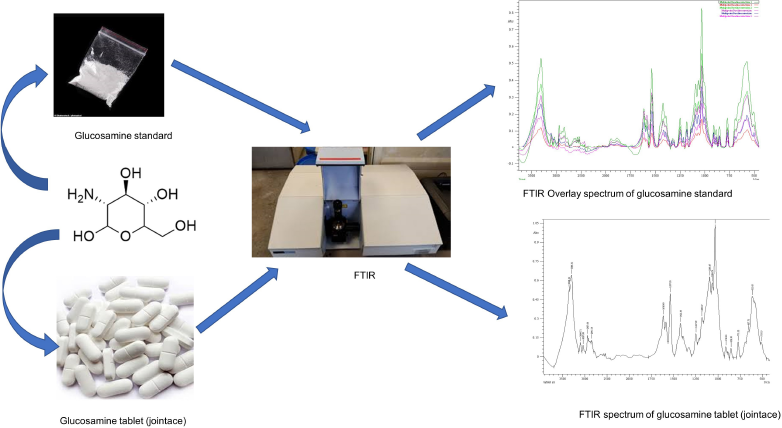 | [Click here to view] |