
INTRODUCTION
Cardamom belongs to the Zingiberaceae family containing various phytochemical compounds such as phenols, starch, tannins, terpenoids, flavonoids, proteins, and sterols, which are also known as perennial herbs (Moulai-Hacene et al., 2020). Based on previous reports, essential oils from cardamom species have antibacterial, antifungal, and antioxidant properties, and they have been shown to inhibit the growth of cancer cells (Thinh et al., 2021). Cardamom is the queen of spices used as a culinary ingredient and traditional medicine for asthma, teeth and gum infections, and digestive and kidney disorders (Ashokkumar et al., 2020). Cardamom fruit is widely used as a traditional medicine for indigestion and obesity. Chewing cardamom can also freshen the breath and clean the teeth. Based on ethnopharmacology, cardamom is widely used to treat depression, gallbladder issues, bronchitis, infections, influenza, impotence, and dysentery (Singletary, 2022). Ivanovi? et al. (2021) reported that cardamom is a potential antioxidant, antimicrobial, and antibacterial inhibitor of bacteria and a skin permeation agent. Several studies have also described the antioxidant ability of cardamom (Amma et al., 2015) because of the presence of phytochemical compounds such as terpenoids, phenolic acids, and flavonoids. Furthermore, cardamom is known to have an antioxidant ability.
Cardamom contains secondary metabolites that are pharmacologically efficacious. Some secondary metabolites reported in cardamom are phenolic compounds and flavonoids, which are used as antioxidants. Phenolics as antioxidants play a role in increasing the activity of antioxidant enzymes or inhibiting enzymes that indirectly induce prooxidant effects by attenuating reactive oxygen species (ROS) production (Ballard et al., 2018). In addition to phenolic compounds, cardamom plants contain flavonoid compounds. Flavonoid compounds can be used as antioxidants using the 2,2-diphenyl-1-picrylhydrazyl (DPPH) method based on free radical chelating activity. For the position and number of hydroxyl groups, degree of polymerization, and combination of 4-carbonyl groups, C2=C3 double bonds could affect the antioxidant activity of flavonoids using the 2,2-azino-bis-(3-ethylbenzothiazoline-6-sulphonic acid) method (Zeng et al., 2020).
Extraction is important in recovering phenolic and flavonoid compounds, which is influenced by several factors such as solvent ratio (Sajid et al., 2019), type of solvent (Qomaliyah et al., 2019), and extraction time (Soos et al., 2019). Extraction using conventional methods has several disadvantages, such as low extraction efficiency, high solvent consumption, high extraction temperature, and long extraction time (Cujic et al., 2016). Consequently, modern extraction techniques in optimizing extraction variables must be used to increase extraction efficiency. The Box–Behnken design (BBD) is an extraction optimization method based on the response surface method for the optimization of experiments, which is widely used by researchers in investigating and optimizing the parameters of the extraction process. Apart from optimizing the extraction process, the BBD also plays a role in explaining and identifying the relationship among parameters or independent variables such as solvent ratio, ethanol concentration, and extraction time that affect the extraction yield (Lin et al., 2020). The BBD is widely applied in the pharmaceutical, food engineering, agrochemical, and other industries, which plays a role in extracting biologically active compounds in humans to provide polysaccharides, phenolic compounds, and proteins. The use of the BBD is considered beneficial because it does not contain extreme cubic region points based on the results of the combination of two factorial independent variables in the cubic area caused by physical constraints in the experiment; thus, the test cannot be carried out (Ahmad et al., 2020). The response surface methodology is an effective mathematical method and statistical technique for optimizing complex experimental processes (Ahmad et al., 2020). Based on Ekram and Nashwa’s (2019) research, optimizing polyphenol extraction from Malva parviflora L. leaf using the BBD is an effective natural ingredient source of DPPH radical scavenging bioactive products. However, information regarding the optimization of cardamom fruit extraction using the BBD combined with three independent variables, namely solvent ratio, ethanol concentration, and extraction time, for the recovery of polyphenolic compounds (phenolic and flavonoid) is lacking.
This study aimed to obtain optimal conditions for extraction based on independent variables, including solvent ratio, ethanol concentration, and extraction time, to yield total phenolic content (TPC), total flavonoids, and antioxidant activity using the BBD. This research can provide knowledge and information about the commercial use of cardamom as an alternative plant that is effective in the field of pharmacology for future studies.
METHODS
A flowchart of this research is shown as follows:
 | [Click here to view] |
Plant sample preparation
Dried cardamom fruit samples were obtained from the Tropical Biopharmaceutical Research Center, Bogor Agricultural University, Indonesia, with geographic coordinates of 6°18′ 6°47′10 (southward) and 106°23′45–107° 13′30 (westward), which is located in the western part of the Java island, a wet tropical climate area with rainfall of 2.500–5.00 mm/year, an average temperature of 20°C–30°C, and an annual average temperature of 25°C. The air humidity is 70%, and the wind speed is relatively low, with an average of 1.2 m/s. The cardamom fruit was washed with water. Later, an oven set at 45°C was used to dry the fruit for 2 days and 1 night. After drying, the sample was ground and filtered through a 100-mesh sieve to obtain dried cardamom fruit powder and prepared for extraction.
The Box–Behnken Design and extraction
Dried cardamom fruit, which is rich in phenolic and flavonoid compounds, was extracted by maceration using 2 g of the provisions based on the variables shown in Tables 1 and 2.
Total phenolic content
Analysis of TPC was carried out on the basis of the method of Calvindi et al. (2020) with modifications. Moreover, 20 ml of the sample extract was placed in a 96-well microplate, then 120 μl of Folin–Ciocalteu (10%) reagent was added, and the plate was placed in a dark room for 5 minutes. Afterward, 80 μl of an Na2CO3 solution was added to the sample (10%), and the mixture was incubated again in the same place for 30 minutes. The absorbance was measured using a microplate reader (Epoch BioTek, USA) at a wavelength of 750 nm. The unit of gallic acid equivalent in mg was used to express the TPC in a sample (gallic acid standard variation, 20–300 ppm) per gram dry weight (DW; mg EAG g−1). Triplicate analysis is required for each sample.
 | Table 1. Code of the three independent variables of the Box–Behnken design. [Click here to view] |
Total flavonoid content (TFC)
The TFC was analyzed on the basis of the method of Calvindi et al. (2020) with modifications. In a 96-well microplate, 120 μl of distilled water and 50 μl of the sample extract were added to the plate. In addition, 10 μl of aluminum chloride (10%), 10 μl of glacial acetic acid, and 50 μl of proanalytical ethanol were added to the microplate. The absorbance of the sample was measured using a microplate reader after the sample was incubated for 30 minutes in the dark and at room temperature (Epoch BioTek, USA) and a wavelength of 415 nm. The unit of quercetin equivalent (QE) in mg per g (mg/g) of fruit based on DW was used to express the TFC. Quercetin with a concentration of 0–50 ppm was used as the standard.
Determination of DPPH antioxidant activity
Analysis of the radical scavenging activity of the 2,2-diphenylpicrylhydrazyl (DPPH) method was carried out on the basis of the method of Nurcholis et al. (2017) with modifications. In a 96-well microplate (Costar, USA), 100 μl of cardamom fruit extract was added to 100 μl or 125 M of DPPH solution dissolved in proanalytical ethanol. Furthermore, absorbance was measured at a wavelength of 515 nm using a microplate reader after being incubated for 30 minutes at room temperature in the dark. The unit of Trolox equivalent in mol TE/g DW was used to express the antioxidant activity of DPPH. Trolox with a concentration of 0–50 ppm was used as the standard.
 | Table 2. Experimental design was Box–Behnken design with three independent variables: solvent ratio (A), ethanol concentration (B), and extraction time (C). [Click here to view] |
Determination of iron-reducing antioxidant strength
The ferric reducing antioxidant power (FRAP) method for antioxidant activity determination was used on the basis of Benzie and Devaki (2017). Ten microliters of dried cardamom fruit extract and 300 μl of FRAP reagent were added to a 96-well microplate (Costar, USA). The absorbance was measured at a wavelength of 593 nm using a microplate spectrophotometer (BioTek, Winooski, USA) after being incubated for 4 minutes at 37°C in a dark room. One milliliter of 10 mM (2,4,6-Tri-(2-pyridyl)-5-triazine) (TPTZ) solution was mixed into 40 mM HCl and 1 ml of 20 mM FeCl3 solution, and then 10 ml of 300 mM acetate buffer with pH 3.6 was added to the mixture to make a FRAP reagent. The FRAP reagent was incubated for 30 minutes at 37°C. The activity of the iron-reducing antioxidant power of FRAP was expressed in mol TE/g DW. Trolox with a concentration of 0–800 ppm was used as the standard.
Statistical analysis
The extraction optimization results were analyzed using the Design Expert 13.0 (trial version) program. The output of the optimization stage is the recommendation of several new formulas that are optimal based on the program. The significance of the mathematical model was verified using branched statistical analysis of variance inference (ANOVA), which was used to identify the linear models, quadratic models, and interaction regression coefficients for each response. The optimum extraction verification results were analyzed using the Excel and SPSS programs.
Identification of phytochemical compounds by gas chromatography–mass spectrometry (GC–MS)
Gas chromatography–mass spectrometry (GC–MS) analysis was conducted in the PerkinElmer Clarus 600 GC system on the basis of the method of Naz et al. (2020) using organic extracts. The Rtx-5MS column was used as the capillary column that completes this system (with an internal diameter of 30 m × 0.25 mm, film thickness of 0.25 m, and maximum temperature of 350°C) combined with PerkinElmer Clarus 600C-MS. Helium (99.99% purity) was used as carrier gas at a constant flow rate of 1.0 ml/minute, whereas the temperature of the injection, transfer channel, and ion source was set at 290°C. Eventually, ionizing energy of 70 eV with electron multiplier voltage was obtained from autotune. The oven temperature that lasts for 2 minutes was programmed from 60°C to 280°C at a speed of 3°C/min. The raw sample was filtered after being diluted with a suitable solvent (1/100, v/v). The split ratio was 30:1, and the diluted crude extract was injected using a syringe. All data were obtained by collecting a mass spectrum scan with a range of 40–550 sma. The peak area was used to express the composition of the percentage of crude extract constituents. For the identification and chemical classification of a compound, the retention time (RT) of GC was used. Subsequently, the mass spectrum was obtained from the mass spectrum standard library. In addition, the National Institute of Standards and Technology (NIST) database was used. Spectrum components that have not been identified were compared with spectrum components in the NIST library and RT. On the basis of the tested extracts, information about the name, molecular weight, and structure of the compounds contained therein was obtained
Identification of phytochemical compounds by LC–MS/MS
The chemical profile by liquid chromatography–tandem mass spectrometry (LC–MS/MS) analysis was obtained on the basis of the research method of Djamila et al. (2020). Quantitative and qualitative analysis of phytochemical compounds with LC–MS/MS instruments was based on a triple mass spectrometer model with a combined system of the Shimadzu Nexera Ultra High-Performance Liquid Chromatography Flight (UHPLCF) model and Shimadzu LCMS 8040. Liquid chromatography with a gradient pump model LC-30 AD, degasser model DGU-20A3R, column oven model CTO-10Asvp, and automatic model equipment autosampler from Shimadzu (SIL) was performed. The column was separated by chromatography on Agilent using the Poroshell model 120 (with EC-C18 size of 2.7 m, 4.6 mm × 150 mm).
RESULTS AND DISCUSSION
TPC, TFC, DPPH, and FRAP response surface analysis
The BBD, which is part of the response surface method, was used to investigate the optimization of total phenolic and total flavonoid extraction from Amomum compactum fruit with three variables, namely solvent ratio (A), ethanol concentration (B), and extraction time (C). Parameter assessment of this optimization was used to determine the antioxidant activity. Response surface analyses for TPC, TFC, DPPH, and FRAP, and ANOVA from BBD are presented in Tables 3 and 4. For the total flavonoid and antioxidant content, DPPH showed quadratic model regression [Eqs. (1) and (2)]. By contrast, the entire phenolic content and FRAP showed a linear regression model [Eqs. (3) and (4)], which was used to obtain the following equations (ignoring significant terms).
Y = 22.44126 − 0.501085A − 0.684391B + 0.285254C + 0.010005AB + 0.005160AC
− 0.005903BC + 0.003209A2 + 0.005071B2 − 0.008154C2 (1)
Y = 0.294716 − 0.004814A − 0.012427B + 0.130449C + 0.000024AB + 0.002060AC
− 0.004697BC + 0.001895A2 + 0.000148B2 + 0.049604C2 (2)
Y = 0.396915 + 0.284740A − 0.009917B − 0.035500C (3)
Y = 1.18264 + 0.260870A − 0.011649B + 0.585000C (4)
 | Table 3. Polynomial equations of response surface analysis for the four responses were tested for TPC, total flavonoids, DPPH radicals, and FRAP. [Click here to view] |
The quadratic regression model obtained from the determination of the TPC showed the effect of extraction time (C), the ratio of solvent and ethanol concentration (AB), ratio of solvent and extraction time (AC), and the square of the percentage of solvents (A2) and the court of ethanol concentration (B2). The increase of the TFC was indicated by a positive sign [Eq. (1)]. The antioxidant activity of DPPH by reducing radicals also obtained a quadratic regression model, which indicated the effect of extraction time (C), solvent ratio and ethanol concentration (AB), solvent ratio and extraction time (AC), and the square of the solvent ratio (A2). In addition, the court of ethanol concentration (B2) and the court of extraction time (C2) showed an increased response, which was indicated by a positive sign for the determination of total flavonoids [Eq. (2)]. Later, analysis of the TPC and FRAP obtained linear regression models, showing that the effect of solvent ratio (A) had an increased response to the TPC [Eq. (3)], and the effect of solvent ratio (A) and extraction time (C) showed a positive response, which increased the reducing activity of the ferroin analog FRAP [Eq. (4)].
Fitting of RSM models
Statistical analysis of the inference of variance (ANOVA) was performed to evaluate the significance of the mathematical model used for selecting the best model for TPC, TFC, DPPH, and FRAP with 95% confidence intervals. The variance (ANOVA) models shown included R2, AdjR2, F-value, and p value. The value of R2 is considered valid if it is close to one, which was used to evaluate the model’s performance (Dos et al., 2020). Meanwhile, the AdjR2 value was used to compare the experimental results with the theoretical results, which obtained a range value of 0.4197–0.9442 and a p value of <0.05 in this study (Table 4), showing significant results and indicating that the model was suitable (Ahmad et al., 2020).
Based on the result of ANOVA (Table 4), F-statistics were used to test the regression model in which the model was considered significant if p < 0.05. The results (Table 4) show significant regression for the linear TPC (F = 29.50, p < 0.0001) and FRAP (F = 4.38, p = 0.0294) models and quadratic TFC (F = 20.45, p = 0.0020) and DPPH (F = 27.30, p = 0.0010) models. The positive and significant correlation between total phenolic and flavonoid contents with antioxidant activity of radical scavenging obtained R2 = 0.9801 and p < 0.005, and the antioxidant activity of FRAP obtained R2 = 0.5441 and p < 0.005.
Optimization of extraction by the response surface
Optimization of extraction is important to the pharmaceutical field to obtain antioxidant compounds (e.g., polyphenol compounds) (Azahar et al., 2020). Dried cardamom fruit was extracted by maceration based on the combination of solvent ratio, ethanol concentration, and extraction time (Table 1) as independent variables. As shown in Table 1, the predicted values and midpoint of the three independent variables were presented on the basis of the initial single-factor experiment results, showing that an experimental design consists of 15 factorial experiments with three replications from the center point (Table 2). The best results were used as responses to the combination of experimental design independent variables (Table 2) resulting from the BBD, thereby affecting the response variables and producing different average results (Table 5) for the total phenolic, flavonoid, DPPH, and FRAP test responses.
Based on the measurement results of the phenolic, flavonoid, DPPH, and FRAP content shown in Table 5, the combination of solvent ratio of 1:15, 70% ethanol, and extraction time of 3 days obtained a maximum TPC of 4.6019 mg/g DW, and the combination of solvent ratio of 1:15, 96% ethanol, and extraction time of 2 days obtained the maximum TFC of 11.1399 mg/g DW. Moreover, free radical scavenging activity using the DPPH method with a combination of solvent ratio of 1:15, 96% ethanol, and extraction time of 2 days obtained a maximum activity of 0.508592 mol TE/g DW, whereas the maximum activity of FRAP antioxidant activity with a combination of solvent ratio of 1:15, 70% ethanol, and extraction time of 3 days obtained 7.21074 mol TE/g DW. This result indicates that a high solvent ratio, the use of ethanol with different concentrations, and the length of extraction affect the activity results of each test. These results are supported by the research of Chaves et al. (2020), which states that optimum extraction is possible in aqueous solutions with 35%–90% ethanol concentrations.
 | Table 4. Regression coefficient (β), coefficient of determination (R2), and F-value from a linear model of response surface for TPC and FRAP and response surface quadratic model for total flavonoid content and radical scavenging activity of DPPH. [Click here to view] |
 | Table 5. Experimental Box–Behnken design with three independent variables and experimental data levels of total phenolic content (TPC), total flavonoids (TFC), DPPH radicals, and FRAP. [Click here to view] |
 | Figure 1. Response surface plots showing the interaction effect of the independent variables of ethanol concentration (%) with solvent-solid ratio (ml/g) (A), Solventsolid ratio (ml/g) with extraction time (d) (B), and ethanol concentration (%) with extraction time (d) (C) on response to total phenolic content (TPC). [Click here to view] |
Effect of liquid–solid ratio and extraction time on TPC
The TPC of A. compactum fruit is presented in Figure 1, showing that the highest TPC was obtained in a solvent ratio of 1:15 with 70% ethanol concentration (Fig. 1a), a combined solvent ratio of 1:15 with an extraction time of 3 days (Fig. 1b), and a combination of 3 days extraction time with 70% ethanol concentration (Fig. 1c). The effect of the total solvent ratio affects the total phenolic increase. As shown in Figure 1, the phenolic content increases with the increase of solvent ratio and extraction time. In addition, the highest total phenolic compound content is 4.6019 mg QE/g DW, where Figures 1a and b show a solvent ratio of 1:15, and Figures 1b and c show the combination of solvent ratio with extraction time of 3 days. Methanol, ethanol, or water or a combination of these three solvents is often used to extract phenolic compounds from various plants such as leaves, roots, or fruits containing many phenolic compounds, including tannins, flavonoids, sterols, and acids (Dos et al., 2020). As shown in Figure 1, the TPC increases with the increase of extraction time and solvent ratio. Lin et al. (2020) stated that the TPC content was strongly influenced by the extraction time, radical scavenging of DPPH, and FRAP, and it would increase significantly with the solvent (liquid–solid) ratio and reach a maximum point at a solid–liquid ratio of 60 ml/g.
Effect of liquid–solid ratio and ethanol concentration on TFC
This flavonoid is a polyphenol derivative compound with a low molecular weight and a single aromatic ring (Dos et al., 2020). The content of TFC with a C-4 keto compound group and C-3 or C-5 hydroxyl group from the flavone and flavonol groups will form a stable acid complex using the (AlCl3) method with an ortho-acid group and hydroxyl group in ring A or B of the flavonoid compound group (Yahya et al., 2020). The TFC of A. compactum fruit is presented in Figure 2, showing that the highest total flavonoid was obtained in a solvent ratio of 1:15 with an ethanol concentration of 96% (Fig. 2a), a combined solvent ratio of 1:15 with an extraction time of 2 days (Fig. 2b), and a combination of 2 days extraction time with 96% ethanol concentration (Fig. 2c). As shown in Figure 2, the flavonoid content increases with the ratio of solvent and ethanol concentration. Figures 2a and c, as well as Figures 2b and c with a solvent ratio of 1:15, show that with 96% ethanol concentration the TFC is high (11.1399 mg QE/g DW). This result is in line with the research of Shi et al. (2021), which states that ethanol concentration affects the TFC during extraction, which is an essential factor influencing extraction efficiency. In addition, an ethanol concentration of 60%–80% shows a decrease in the TFC, whereas ethanol concentrations between 80% and 90% will increase the TFC. Meanwhile, a high solvent ratio factor will result in the maximum flavonoid content. This result is in line with the research of Zhang et al. (2019), which states that the liquid–solid ratio with a liquid–solid contact area will affect flavonoid extraction, where high TFC values are obtained from liquid to solid ratios ranging from 10 to 35 ml/g.
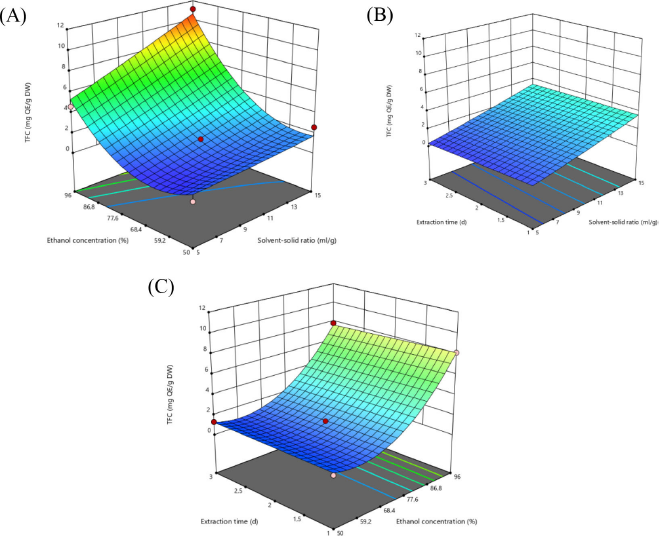 | Figure 2. Response surface plots showing the interaction effect of the independent variables of ethanol concentration (%) with solvent-solid ratio (ml/g) (A), Solvent-solid ratio (ml/g) with extraction time (d) (B), and ethanol concentration (%) with extraction time (d) (C) on response to total flavonoid content (TFC). [Click here to view] |
 | Figure 3. Response surface plots showing the interaction effect of the independent variables of ethanol concentration (%) with solvent-solid ratio (ml/g) (A), Solvent-solid ratio (ml/g) with extraction time (d) (B), and ethanol concentration (%) with extraction time (d) (C) on the response of DPPH radical scavenging activity. [Click here to view] |
Effect of liquid–solid ratio and ethanol concentration on DPPH radical scavenging bioactivity
The high content of phenolic compounds from plants causes high antioxidant capacity. The polyphenolic compounds found in these plants show a characteristic inhibition pattern of oxidative reactions in vitro and in vivo (Oussaid et al., 2017). The structure and composition of phenolic compounds significantly affect antioxidant activity. The mechanism for scavenging DPPH free radicals is based on electron donation from phenolic compounds (Mun’im et al., 2017). The bioactivity of DPPH radical scavenging from A. compactum fruit is presented in Figure 3, showing that the highest radical scavenging was obtained in a 1:15 solvent ratio with 96% ethanol concentration (Fig. 3a), a combined solvent ratio of 1:15 with an extraction time of 2 days (Fig. 3b), and a combination of 2 days extraction time with 96% ethanol concentration (Fig. 3c). Figures 3a and b, as well as Figures 3a and c with an ethanol concentration of 96%, explain that with a solvent ratio of 1:15 the maximum total DPPH radical scavenging activity is 0.508592 mol TE/g DW. This result is in line with the research of Zhang et al. (2019), which states that a high percentage of ethanol concentration will dramatically affect the radical scavenging activity of DPPH and decrease at low ethanol concentrations with the decrease of the liquid–solid ratio. Therefore, in this study, the rate of ethanol with a concentration of 96% could produce maximum DPPH radical reduction.
Effect of liquid–solid ratio and extraction time on antioxidant activity of FRAP
Antioxidants using the FRAP method (reductants) can reduce oxidants and donate electrons, where the higher the FRAP, the higher the antioxidant ability (Wang et al., 2021). Antioxidant activity using the FRAP method of A. compactum fruit is presented in Figure 4. The maximum ROS radical scavenging activity is obtained in a solvent ratio of 1:15 with 70% ethanol concentration (Fig. 4a), a combination of 1:15 solvent ratio with extraction time of 3 days (Fig. 4b), and a combination of 3 days extraction time with 70% ethanol concentration (Fig. 4c). Figures 4a and b, as well as Figures 4b and c with an extraction time of 3 days, show that with a solvent ratio of 1:15 the maximum antioxidant activity is 7.21074 mol TE/g DW. These results are consistent with the research of Lin et al. (2020), which stated that the value of the antioxidant activity of FRAP obtained high results with low wave power and high extraction time. The antioxidant activity of FRAP will increase with the decrease of ethanol concentration (Zhang et al., 2019).
 | Figure 4. Response surface plots showing the interaction effect of the independent variables of ethanol concentration (%) with solvent-solid ratio (ml/g) (A), solvent-solid ratio (ml/g) (A), Solvent-solid ratio (ml/g) with extraction time (d) (B), and ethanol concentration (%) with extraction time (d) (C) on the response of FRAP antioxidant activity. [Click here to view] |
Optimum extraction formulation and validation
The BBD from the Design Expert 13.0 program resulted in the optimum extraction formula for A. compactum fruit, including 78 selected combinations with the highest desirability value of 0.801 (Fig. 5). The desirability value can determine the degree of accuracy of the optimal solution. The closer to 1 the desirability value, the higher the optimization accuracy. Therefore, under optimal conditions, the model validation and response values are not significantly different from the predictions (Mang et al., 2015). The best combination of the program is a solvent ratio of 1:15, with 96% ethanol and an extraction time of 1.676 days. Afterward, the best combination was verified on the same A. compactum fruit sample but extracted with the selected mixture (Table 6). The verification results in Table 6 are analyzed on the basis of the residual standard error (RSE) and p value in the one-sample t-test analysis, which is the value of a model selected based on the comparison of the actual with the predicted value. An RSE value <5% indicates no significant difference between the actual value and the predicted value, implying that the model used is suitable (Sulaiman et al., 2017). Based on the results of the one-sample t-test analysis, a p value of > 0.05 indicates that the predicted value obtained from the optimization results of BBD is based on the verification results. The p value states that the prediction results match the obtained data (Greenland, 2016).
Phytochemical analysis using GC–MS and LC–MS/MS fruit extract of A. compactum
The complex mixture of chemical compounds found in plant extracts has an essential role in several biological activities (Naz et al., 2020). The results of GC–MS were used to identify the content of phytochemical compounds from cardamom extract. Medicinal plants contain several chemical compounds, such as polyphenol metabolites, which play an essential role in fighting oxidative stress (Yu et al., 2015). Given their chemical structure rich in hydrogen alkyl groups, these metabolites are the main constituents of antioxidants and metal chelate (Gulcin, 2020).
The content of phytochemical compounds in the ethanolic extract of dried cardamom fruit can be analyzed and identified on the basis of the chromatogram results. Figure 6 shows that the chromatogram was used rather than the library contained in the instrument to obtain 69 peaks, whose peak width and initial threshold are 0.005 and 20, respectively. The compounds that have been identified are listed in Table 7. As shown in Table 7, chromatogram analysis of the dried cardamom fruit extract (A. compactum) obtained various types of compounds with different RT. By using GC–MS, most of the compounds identified had a molecular mass below 300 g/mole. RT is the time required for a compound to be determined on its way through the chromatographic column. The compounds identified in the dried cardamom fruit extract were classified into several groups of compounds, namely hydrocarbons, monoterpenes, sesquiterpenes, chlorinated organic compounds, oxygenated monoterpenes, purine nucleosides, phenolics, terpenoids, aromatic alcohols, benzene, organ oxygen, and organonitrogens, phenylethanolamine, propylamine, alkaloids, amides, alcohols, furans, carboxylic acids, phenols, ketones, and fatty acids. The results of this research are consistent with the results of the identification of metabolites obtained by Ivanovi? et al. (2021), which stated that cardamom, which has a distinctive aroma and taste, contains mostly fatty acids, pigments, proteins, sugars, cellulose, starch, silica, and calcium oxalate with 1,8-cineol (20%–60%), which is a terpenoid compound, and terpinyl acetate (20%–50%), which is a fatty acid group, being the most dominant compounds. The abovementioned phenolic and flavonoid compounds have an essential role in bioactivity, one of which is an antioxidant, which is based on the research of Ivanovi? et al. (2021), indicating that cardamom is widely used in the pharmaceutical field as an antioxidant because of the presence of phenolic compounds, flavonoids, and other biologically active constituents such as tannic acid, gallic acid, 4,5-caffeoylquinic acid, and caffeic acid. Eventually, based on the research of Singletary (2022), flavonoid compounds (such as kaempferol, quercetin, saponins, tannins, and sterols), monoterpenes (such as 1,8-cineole and 1,8-pinene), phenolics (such as ferulic acid and p-coumaric), alkaloids, and amino acids in the extract of cardamom were also obtained, where the extract of dried cardamom fruit was included in the food of the test animals. Therefore, an increase in antioxidant defense and a decrease in inflammation can be observed in these animals. Phenylephrine, which was found at RT of 6.392 and 17.928, belongs to the class of polyphenolic compounds, where other polyphenolic compounds such as oleuropein, tyrosol, coumaric acid, caffeic acid, vanillic acid, ferulic acid, kaempferol, and quercetin have potent antioxidant activity (Stagos, 2020).
 | Figure 5. Contour plot desirability of the optimum extraction formula of cardamom (Amomum compactum) (A), on TPC (B), TFC (C), DPPH (D), and FRAP (E) [Click here to view] |
 | Table 6. Experimental data validated the predictive value of TPC, total flavonoids, DPPH radical scavenging activity, and FRAP antioxidant activity at optimal extraction conditions. [Click here to view] |
 | Figure 6. Chromatogram results of A. compactum fruit samples using GC–MS. Retention time: ethylbenzene (2.894), 1,8-cineole (4.901), terpenoids (7.704), phenolics (18.089), fatty acids (17.743), and heneicosane (19.117). [Click here to view] |
 | Table 7. Identification of volatile compounds found in A. compactum fruit extract using GC–MS. [Click here to view] |
 | Figure 7. Chromatogram results of A. compactum fruit samples using LC–MS/MS. Retention time: benzoic acid (3.90), amino acids (7.28), coumarins (10.11), amino alcohols (10.37), flavonoids (12.07), linoleic acid (13.28), oleic acid (14.24), palmitic acid (15.10), and malonic acid (15.52). [Click here to view] |
 | Table 8. Identification and quantification of phytochemical compounds found in A. compactum fruit extract using LC–MS/MS. [Click here to view] |
In addition to phenolic compounds, the results of the chromatogram show terpenoid compounds such as beta-pinene, D-limonene, 1.8-cineole, sabinene, beta-pinene, beta-myrcene, fenchone, linalool, delta-terpineol, 4-terpineol, R-3.7-dimethyl-1,5-octadiene-3,7-diol, 3-cyclohexene-1-methanol, myrtenol, 2.3-pinanediol, santene, alpha-selinene, beta-bisabolene, alpha-amorphene, bicyclogermacrene, and cadinane. This result is in line with the research of Sinurat et al. (2020), which states that terpenoid compounds such as 1,8-cineole and linalool have antioxidant activity, and several other sesquiterpenoids have antifungal and insecticidal activity. In addition to phenolic and terpenoid group compounds, the results of cardamom fruit chromatograms also contain alkaloid compounds such as 2H-thiopyran, which is in accordance with the research of Gan et al. (2017), indicating that phenols and alkaloids are compounds that play an important role in antioxidant activity. However, compared with phenol compounds, alkaloids have a higher correlation with antioxidants.
Apart from using GC–MS to identify phytochemical compounds contained in dried cardamom fruit extract, the LC–MS/MS instrument is also used to identify compounds whose molecular mass is higher than the compounds obtained from GC–MS. As shown in Figure 7, the results of the chromatogram of cardamom fruit showed several compounds belonging to different groups of compounds, consisting of groups of flavonoid compounds, amino acids, oleic acid, malonic acid, benzoic acid, benzene, linoleic acid, palmitic acid, and minerals.
The use of LC–MS/MS to analyze the chemical composition of a plant extract is more effective because this instrument is considered as a powerful and precise analytical tool (Djamila et al., 2020). As shown in Table 8, approximately 20 compounds have been identified, one of which is a group of flavonoid compounds, namely betagarin, at RT of 12.066. Betagarin, also known as salvigenin, is a natural product commonly found in Salvia candidissima and Salvia chionopeplica. This compound belongs to the Lamiaceae family. One of the compounds found in this family is betagarin, which has high pharmacological bioactivity and antioxidant and anticancer activity (Yaris et al., 2021). These flavonoid compounds were found in a reasonably high percentage of 91.7%. Flavonoids serve as scavengers of oxidizing molecules and various free radicals and oxygen. These flavonoids have a linear correlation with increased antioxidant activity (Ghasemzadeh et al., 2012). In addition to flavonoid compounds, polyphenolic compounds, namely coumarins, were also identified (99.96%). Coumarin belongs to the group of aromatic organic compounds, also known as hydroxycinnamic acid, which has a distinctive aroma and vanilla-like smell. Coumarin compound and its derivatives, such as 4-methyl chromen-2-one, have antioxidant activity because a stable quinoid structure is formed when hydrogen is added (Yasameen et al., 2017). This result is in line with the research of Bubols et al. (2013), which states that, in the presence of a benzopyrone ring, flavonoids and coumarins are known to be potential sources of exogenous antioxidants. Another study reported that polyphenols can protect cell constituents damaged by oxidative stress because these compounds serve as potent free radical scavengers (Zaha et al., 2018). In addition, acidic compounds such as benzoic, tetradecanoic, linoleic, oleic, palmitic, and malonic acid were found. Based on the research of Zaha et al. (2018), such acids are a group of fatty acids; for example, oils from palmitic and linoleic acids can be used in dietary supplements to prevent chronic diseases caused by excessive fat content. The oil contained in these fats can serve as powerful antioxidants because they contain phenolic compounds, tocopherols, flavonoids, and various fatty acids.
CONCLUSION
This study was the first to extract dried cardamom fruit using the BBD with three independent variables (solvent ratio, ethanol concentration, and extraction time) to optimize the extraction combination variables of cardamom fruit (A. compactum), which was proven to be adequate to obtain the following conditions: The optimal extraction from the Design Expert 13.0 program was obtained at a solvent ratio of 1:15 ml/g, 96% ethanol, and extraction time of 1.676 days with a desirability value of 0.801. The effect of independent variables on polyphenol extraction for antioxidant activity was significantly good based on the verification results, which were analyzed by the one-sample t-test and residual standard error (RSE) test. A p value of > 0.05 and %RSE of < 5% indicate the high accuracy of the optimization, which is considered effective. Based on analysis of the phytochemical compounds contained in cardamom fruit (A. compactum) using GC–MS and LC–MS/MS, the content of compounds such as phenolics, flavonoids, terpenoids, alkaloids, polyphenols, and fatty acids has antioxidant activity.
ACKNOWLEDGMENT
This research was supported by the PDUPT Research Program of IPB University (1925/IT3.L1/PN/2021).
AUTHOR CONTRIBUTIONS
All authors made substantial contributions to conception and design, acquisition of data, or analysis and interpretation of data; took part in drafting the article or revising it critically for important intellectual content; agreed to submit to the current journal; gave final approval of the version to be published; and agree to be accountable for all aspects of the work. All the authors are eligible to be an author as per the international committee of medical journal editors (ICMJE) requirements/guidelines.
FUNDING
There is no funding to report.
CONFLICTS OF INTEREST
The authors report no financial or any other conflicts of interest in this work.
ETHICAL APPROVALS
This study does not involve experiments on animals or human subjects.
DATA AVAILABILITY
All data generated and analyzed are included within this research article.
PUBLISHER’S NOTE
This journal remains neutral with regard to jurisdictional claims in published institutional affiliation.
REFERENCES
Ahmad A, Muneeb UR, Adil FW, Hamed AES, Fahad AAM, Saleh NM, Hossam MA, Tahir MM, Parvaiz A. Box-Behnken response surface design of polysaccharide extraction from Rhododendron arboreum and the evaluation of its antioxidant potential. Molecules, 2020; 25:3835. CrossRef
Amma KPP, Sasidharan I, Sreekumar MM, Sumathykutty MA, Arumughan C. Total antioxidant capacity and change in phytochemicals of four major varieties of Cardamom oils during decortication. Int J Food Prop, 2015; 18(6):1317–25. CrossRef
Ashokkumar K, Murugan M, Dhanya MK, Warkentin TD. Botany, traditional uses, phytochemistry and biological activities of cardamom [Elettaria cardamomum (L.) Maton]—a critical review. J Ethnopharmacol, 2020; 246:112244. CrossRef
Azahar NF, Siti SAG, Uswatun HZ, Paiman B, Mohd Izuan EH. Optimization of the antioxidant activities of mixtures of Melastomataceae leaves species (M. malabathricum Linn Smith, M. decemfidum, and M. hirta) using a Simplex Centroid Design and their anti-collagenase and elastase properties. Appl Sci, 2020; 10:7002. CrossRef
Ballard CR, Marostica MR. Health benefits of flavonoids. In: Segura-Campos MR (ed.). Bioactive compounds: health benefits and potential applications, Elsevier Inc., Amsterdam, the Netherlands, pp 185–201, 2018. CrossRef
Benzie IFF, Devaki M. The ferric reducing/antioxidant power (FRAP) assay for non-enzymatic antioxidant capacity: concepts, procedures, limitations and applications. In: Anal Biochem (ed.). Measurement of antioxidant activity & capacity, pp 77–106, 2017. CrossRef
Bubols GB, Damiana DRV, Alexander MR, Gilsane VP, Rosa MLR, Vera El, Solange CG. The antioxidant activity of coumarins and flavonoids. Mini Rev Med Chem, 2013; 13(3):318–34. CrossRef
Calvindi J, Syukur M, Nurcholis W. Investigation of biochemical characters and antioxidant properties of different winged bean (Psophocarpus tetragonolobus) genotypes grown in Indonesia. Biodiversitas, 2020; 21(6):2420–4. CrossRef
Chaves JO, de Souza MC, da Silva LC, Lachos-Perez D, Torres-Mayanga PC, Machado AP da F, Forster-Carneiro T, Vázquez-Espinosa M, González-de-Peredo AV, Barbero GF, Rostagno MA. Extraction of flavonoids from natural sources using modern techniques. Front Chem, 2020; 8:507887. CrossRef
Cujic N, Savikin K, Jankovic T, Pljevljakusic D, Zdunic G, Ibric S. Optimization of polyphenols extraction from dried Chokeberry using maceration as traditional technique. Food Chem, 2016; 194:135–42. CrossRef
Djamila B, Bellil I, Akkal S, Bensouici C, Khelifi D. LC-MS/MS analysis, antioxidant and antibacterial activities of Algerian fir (Abies numidica de LANNOY ex CARRIERE) ethyl acetate fraction extracted from needles. J King Saud Univ Sci, 2020; 32(8):3321–7. CrossRef
Dos Santos C, Mizobucchi AL, Escaramboni B, Lopes BP, Angolini CFF, Eberlin MN, de Toledo KA, Núñez EGF. Optimization of Eugenia punicifolia (Kunth) D. C. leaf extraction using a simplex centroid design focused on extracting phenolics with antioxidant and antiproliferative activities. BMC Chem, 2020; 14(1):34. CrossRef
Ekram A. AE, Nashwa FSM. Optimization of the extraction of polyphenols and antioxidant activity from Malva parviflora L. leaves using Box-Behnken Design. Prep Biochem Biotechnol, 2019; 49(9):876–83. CrossRef
Gan J, Ying F, Zhao H, Xian L, Hong Z. Correlations between antioxidant activity and alkaloids and phenols of Maca (Lepidium meyenii). J Food Qual, 2017; (3):1–10. CrossRef
Ghasemzadeh A, Maryam A, Omid S, Hawa ZEEJ. Flavonoid compounds and their antioxidant activity in extract of some tropical plants. J Med Plants Res, 2012; 6(3):2639–43. CrossRef
Greenland S, J. Senn S, J. Rothman K, B. Carlin J, Poole C, N. Goodman S, G. Altman D. Statistical, P values, confidence intervals, and power: a guide to misinterpretations. Eur J Epidemiol, 2016; 31:337–50. CrossRef
Gulcin I. antioxidants and antioxidant method: an update overview. Arch Toxicol, 2020; 94(3):651–715. CrossRef
Ivanovi? M, Kaja M, Maša IR. Comparative study of chemical composition and antioxidant activity of essential oils and crude extracts of four characteristic Zingiberaceae herbs. Plants, 2021; 10:501. CrossRef
Lin D, Qing M, Yiwen Z, Zeyen P. Phenolic compounds with antioxidant activity from strawberry leaves: a study on microwave-assisted extraction optimization. Prep Biochem Technol, 2020; 50(9):874–82. CrossRef
Mang DY, Abdou AB, Njintang NY, Djiogue EJM, Loura BB, Mbofung MC. Application of desirability-function and RSM to optimize antioxidant properties of mucuna milk. J Food Meas Charact, 2015; 9(4):495–507. CrossRef
Moulai-Hacene F, Mokhtaria YB, Soumla K, Abdelkader H. Chemical composition and antimicrobal properties of Elettaria cardamomum extract. Pharmacogn J, 2020; 12(5):1058–63. CrossRef
Mun’im A, Siti N, Ririn S, Rezi RS. Optimization of microwave-assisted extraction of active compounds, antioxidant activity and Angiotensin Converting Enzyme (ACE) inhibitory activity from Peperomia pellucida (L.) Kunth. J Young Pharm, 2017; 9(1):s73–8. CrossRef
Naz R, Thomas HR, Asghari B, Asia N, Humaira Y, Muhammad NH, Rumana K, Sami U, Wajha K, Zahid A. GC-MS analysis, antimicrobial, antioxidant, antipoxygenase and cytotoxic activities of Jacaranda mimosifolia methanol leaf extracts and fractions. PLoS One, 2020; 15(7):e0236319. CrossRef
Nurcholis W, Khumaida N, Syukur M, Bintang M. Evaluation of free radical scavenging activity in ethanolic extract from promising accessions of Curcuma aeruginosa RoxB. Molecules, 2017; 12(2):133–8. CrossRef
Oussaid S, Chibane M, Madani K, Amrouche T, Achat S, Dahmoune F, Houali K, Rendueles M, Diaz M. Optimization of the extraction of phenolic compounds from Scirpus holoschoenus using a simplex centroid design for antioxidant and antibacterial applications. LWT, 2017; 86:635–42. CrossRef
Qomaliyah EN, Artika IM. Nurcholis W. Optimization of extraction process for extract yields, total flavonoid content, radical scavenging activity and cytotoxicity of Curcuma aeruginosa RoxB. Rhizome. Int J Res Pharm Sci, 2019; 10(3):1650–9. CrossRef
Sajid M, Wo?niak MK, P?otka-Wasylka J. Ultrasound-assisted solvent extraction of porous membrane packed solid samples: a new approach for extraction of target analytes from solid samples. Microchem J, 2019; 144:117–23. CrossRef
Shi G, Jiaxin S, Tao W, Fei R, Famou G, Yuan Z. UPLC-ESI-MS/MS analysis and evaluation of antioxidant activity of total flavonoid extract from Paeonia lactiflora seed peel and optimization by Response Surface Methodology (RSM). BioMed Res Int, 2021; 7304107. CrossRef
Singletary K. Cardamom Potential Health Benefits. Food Sci, 2022; 57:1. CrossRef
Sinurat JP, Visensius K, Reh MBK, Rinaldo B. Analysis of total terpenoids from Maniltoa Grandiflora (A. Gray) scheff leaves using TLC and HPLC methods. Stannum: Jurnal Sains dan terapan Kimia, 2020; 2(2):40–4. CrossRef
Soós Á, Bódi É, Várallyay S, Molnár S, Kovács B. Mineral content of propolis tinctures in relation to the extraction time and the ethanol content of the extraction solvent. LWT, 2019; 111:719–26. CrossRef
Stagos D. Antioxidant activity of polyphenolic plant extracts. Antioxidants, 2020; 9:19. CrossRef
Sulaiman ISC, Mahiran B, Hamid RM, Wei JC, Siti EA, Maznah I. Effects of temperature, time, and solvent-ratio on the extraction of phenolic compounds and the anti-radical activity of Clinachantus nutans Lindau leaves by response surface methodology. Chem Cent J, 2017; 11(54). CrossRef
Thinh BB, Roman VD, Thanh VQ. Chemical composition of essential oil of Amomum xanthioides Wall. Ex Baker from Northern Vietnam. Biointerface Research in Applied Chemistry, 2021; 11(4):12275–84. CrossRef
Wang Y, Fengju O, Chunying T, Dan JQ. Optimization for the extraction of polyphenols from Inonotus obliquus and its antioxidation activity. Prep Biochem Biotechnol, 2021; 1864642. CrossRef
Yahya NA, Roswanira AW, Mariani AH, Naji AM, Mohamad AMH, Nursyafreena A, Siti EH. Statistical Optimization and Characterization of Acoustically Extracted Ananas comocus peel powder with enhanced antioxidant capacity. Jurnal Teknologi (Science & Engineering), 2020; 82(4):1–10. CrossRef
Yaris E, Leyla BA, Ismail Y, Eyyup T, Mustafa AY, Mehmet A, Erhan K, Mehmet F, Abdulselam E, Ufuk K. Isolation of secondary metabolites of two endemic species: Salvia rosifolia Sm. and Salvia cerino-pruinosa Rech. f. var. elazigensis (Lamiaceae). J Food Meas Charact, 2021; 15(6):1. CrossRef
Yasameen AM, Ahmed AA, Abdul AK, Abu BM. Antioxidant Activity of Coumarins. Sys Rev Pharm, 2017; 8:1.
Yu XL, Li YN, Zhang H, Su YJ, Zhou WW, Zhang ZP. Rutin inhibits amylin-induced neurocytotoxicity and oxidative stress. Food Funct, 2015; 6(10):3296–306. CrossRef
Zaha A, El-Agbar, Rajashri R, Naik, Ashok KS. Fatty acids analysis and antioxidant activity of fixed oil of Quercus infectoria, grown in Jordan. Oriental J Chem, 2018; 34(3):1368–74. CrossRef
Zeng Y, Song J, Zhang M, Wang M, Zhang Y, Suo H. Comparison of In Vitro and In Vivo antioxidant activities of six flavonoids with similar structures. Antioxidants, 2020; 9:732. CrossRef
Zhang L, Yuhuan J, Xuening P, Puyue H, Xiang G, Qun L, Zichao L. Simultaneous optimization of ultrasound-assisted extraction for flavonoids and antioxidant activity of Angelica keiskei using Response Surface Methodology (RSM). Molecules, 2019; 24:3461. CrossRef