INTRODUCTION
Riociguat is a novel drug by Bayers used for the treatment of pulmonary hypertension (PH) and chronic thromboembolic pulmonary hypertension (CTPH) (Ali et al., 2012). Chemically, the drug is known as methyl 4,6-diamino-2-[1-(2-fluorobenzyl)-1H-pyrazo-lo[3,4-b]pyridin-3-yl]-5-pyrimidinyl (methyl)carbamate with a molecular formula and weight of C20H19FN8O2 and 422.42 g/mol, respectively (Fig. 1).
As per the literature review, few analytical methods have been reported for the drug Riociguat by high performance liquid chromatography (HPLC) (Temgire et al., 2018) and by LC-MS/MS (Nayak et al., 2018), and to best of our knowledge, a bio-analytical LC-MS method has been reported by Gnoth et al. (2015). These chromatographic methods primarily depend upon complicated and interactive factor optimizations like the use of buffers, flow rate, temperature, injection volume, gradient flow, pH, etc., to attain a stable method with consistent performance (Goeroeg, 2012; Orlandini et al., 2013).
Recently, the use of quality by design (QbD) approach has become quite popular in practice in various fields including analytical method development as analytical QbD (AQbD) (Kumar et al., 2015; Monks et al., 2012). It is well documented that the critical analytical attributes (CAAs) affect the performance of analytical method and provides science-based and risk-based understanding (Rozet et al., 2011). AQbD helps to understand the risks associated with the interaction and other variables in method optimization (Nethercote and Ermer, 2012). It also defines the CAAs and quality target method profile to identify critical method parameters using risk assessment and screening, method optimization using experimental designs, modelization and optimum search through response surface methodology (RSM) to initiate the analytical design space, and propose control strategies for continuous improvement (Lionberger et al., 2008).
For the present study, RSM based on central composite design (CCD) has been reported to develop a rapid, sensitive, robust, effective, and economical LC-MS/MS method employing AQbD approach for estimation of Riociguat in bulk drug and pharmaceutical formulation based on fitted polynomial equation with experimental model.
EXPERIMENTAL STUDY
Standards and reagents
Riociguat standard was given as a gift sample from IPC, New Delhi, India. The commercially available tablet formulation of Riociguat, Adempas 0.5, 1.0, and 1.5 mg tablets (Bayers, Health care pharmaceuticals) was used for the assay. Formic acid of analytical grade was purchased from SD Fine Chemicals, Mumbai, India. LC-MS grade acetonitrile was procured from Sigma-Aldrich, Mumbai, India, and LC-MS grade water was procured from Milli-Q RO framework (Millipore, Bedford, USA) were utilized. Design Expert software version 10.0 was used for QbD.
Preparation of mobile phase
Formic acid (1 ml) was mixed in 1,000 ml of water and passed through a 0.45-μ channel layer utilizing a Millipore filtration unit.
Preparation of the standard solution
Riociguat standard (100 mg) was accurately weighed into a 100 ml volumetric flask, dissolved with acetonitrile, and made up to 100 ml to produce a concentration of 1 mg/ml. The stock solution was stored at 8°C until analysis.
Preparation of working solution and quality control (QC) samples
From the standard stock solution, further dilutions were made to produce a concentration of 1,000 ng/ml. Similarly, the QC samples of low-quality control (LQC) 0.5 ng/ml, middle-quality control (MQC) 30 ng/ml, and high-quality control (HQC) 100 ng/ml were prepared.
Preparation of sample solution (0.5, 1, and 1.5 mg)
Twenty tablets were taken from each dosage form, weighed precisely, and powdered. From which the powdered tablets equivalent to 10 mg of Riociguat was precisely weighed and transferred into a 10 ml volumetric flask. 5 ml of acetonitrile was added and sonicated for about 30 minutes to dissolve the content and the volume was made up to 10 ml using acetonitrile. Furthermore, the dilutions were prepared for each dosage form to produce the QC samples of LQC 0.5 ng/ml, MQC 30 ng/ml, and HQC 100 ng/ml.
Optimization and development of LC-MS/MS method
For the present study, the method optimization was carried out using Shimadzu 8030 system (Tokyo, Japan) with triple quadruple mass system equipped with electrospray ionization interface, LC-20AD siphon, CBM-20 alite controller, and SIL-20AC auto-sampler with 107 vial limit and lab solution was utilized. The separation was carried out using Zorbax C18 column (50 mm × 4.6 mm × 5 μm) as a stationary phase and isocratic elusion was achieved using the mobile phase consists of 0.1% formic acid: acetonitrile (10:90 v/v) with a flow rate of 1.0 ml/minute and an injection volume of 10 μl (Fig. 2). Acetonitrile was used because of its low viscosity to reduce internal pressure. It was observed that Riociguat is a weakly acidic drug with pKa value of 4.34 ± 0.02. Hence, 0.1% formic acid was used for the best retention time of the acidic drug.
Nitrogen and argon gases were used for nebulization and collision, respectively. The mass conditions optimized for Riociguat is as follows: heat block temperature and desolvation line temperature were set at 230°C and 250°C, respectively. The multiple reaction monitoring (MRM) mode was used for Riociguat using drying gas and nebulizer flow set at 15 and 3 l/minute, respectively.
The parameters acetonitrile percentage (%), flow rate (ml) (LC parameters), and heat block temperature (mass parameter) were optimized through design of experiment as they play a significant role in separation and ionization to produce a highly sensitive method. These three factors were studied using CCD.
Validation of LC-MS/MS method
The developed method was validated as per the guidelines for accuracy, precision, specificity, linearity, limit of detection (LOD), limit of quantification (LOQ), and system suitability parameters (International Council for Harmonization ICH, 2005).
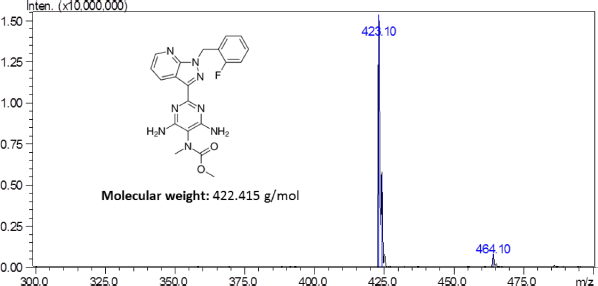 | Figure 1. Mass scan spectra of Riociguat. [Click here to view] |
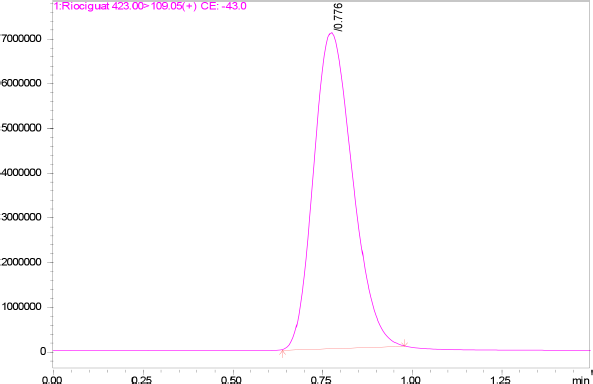 | Figure 2. MRM chromatogram of Riociguat. [Click here to view] |
Accuracy
The recovery studies were carried out to determine the method accuracy at three QC samples at low, middle, and high by standard addition method, where a known amount of standard is added to produce the final concentration of 0.5, 30, and 100 ng/ml.
Precision
The method precision was studied based upon the intraday and interday precision studies by carrying out the repeatability (n = 6) of the QC samples. The peak area and percent relative standard deviation (%RSD) was calculated.
Specificity
The specificity of the method was studied for any endogenous interference from the excipients at the retention time of Riociguat.
Linearity
The method linearity was prepared for Riociguat over the concentration range of 0.5, 1, 5, 10, 30, 50, 70, 90, and 110 ng/ml. Three replicate injections of each concentration were analyzed to determine the linear regression and correlation coefficient.
Detection limit and quantification limit
The detection and quantification limits were calculated based on the signal-to-noise ratio of 3:1 and 10:1, respectively.
System suitability study
The system suitability studies of Riociguat (30 ng/ml) were carried out by analyzing six replicate injections of the standard solution in LC-MS/MS. From the replicate injection, the acceptance criteria for tailing factor, asymmetric factor, and number of theoretical plates were studied.
RESULTS AND DISCUSSION
Optimization of LC-MS/MS method (experimental design)
The independent factors (variables) were assessed at four levels [low (−), medium (0), high level (+), and at axial points −α and +α] to analyze the interactions of factors on method characteristics for the response of peak area and tailing factor (dependent factors). Twenty experiments were carried out for estimating the experimental variance considering the center points. The significance of the model on independent variables was determined by analysis of variance (ANOVA). The obtained responses were randomized and a 30 ng/ml solution of Riociguat was used for all 20 experiments. Tables 1 and 2 summarize the factors and their levels in CCD. The computer-generated polynomial equation for the experimental design is as follows:
Y = X0 + X1A + X2B + X3C + X4AB + X5AC + X6BC + X7A2 + X8B2 + X9C2
where Y is the response, X0 is the intercept, X1 to X9 regression coefficient of the polynomial equation, and A, B, and C represent the independent variables
Effect of method optimization variable on response A (peak area)
High F-value of 11.88 indicates the significance of the model. Probability (p) value less than 0.05 indicates the significance of the model. In this case, A, AB, A2, and C2 are significant model terms and the model is not significant if the values are greater than 0.100. The model reduction is carried out to improve the model if many insignificant factors are present. The obtained model can be used to navigate the design space based on the predicted (Pred R2) and adjusted coefficient of determination (Adj R2). The significant model terms indicate that the peak area is very much affected by acetonitrile percentage. The polynomial equation obtained after reduction for this model is as follows:
Peak area = 1.438 E + 005 + 28,288 A + 50,788.88 AB − 22,508.06 A2 – 55,418.44 C2
The results indicate that the model was statistically significant (p < 0.05) from the model, lack and sum of fit. In the above polynomial equation, the positive and negative signs indicate the synergistic and antagonistic effects of the factors. The statistical results of the factors are shown in Table 3.
Effect of method optimization variable on response B (tailing factor)
High F-value of 3.30 indicates the significance of the model. Probability (p) value less than 0.05 indicates the significance of the model. In this case, AB and AC are significant model terms and the model is not significant if the values are greater than 0.100. The model reduction is carried out to improve the model if many insignificant factors are present. The obtained model can be used to navigate the design space based on the predicted (Pred R2) and adjusted coefficient of determination (Adj R2). The significant model terms indicate that the peak area is very much affected by all the three factors in terms of interaction. The polynomial equation obtained after reduction for this model is as follows:
 | Table 1. Selected independent variables and levels for the CCD. [Click here to view] |
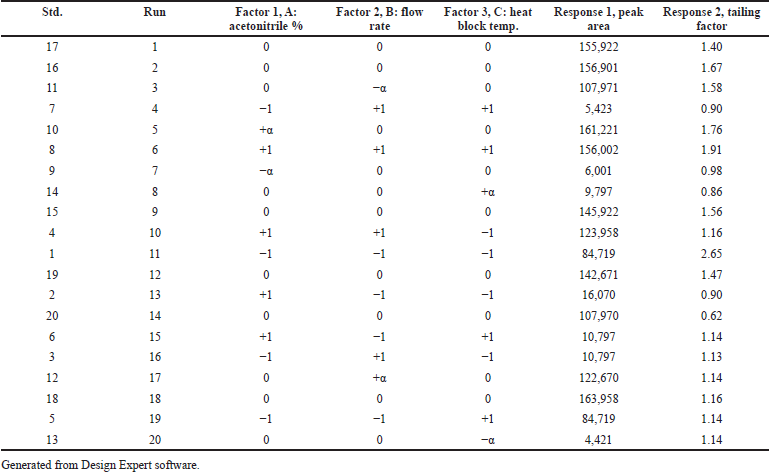 | Table 2. Experimental runs and responses obtained for the CCD. [Click here to view] |
Tailing factor = 1.34 + 0.35 AB + 0.34 AC
The results indicate that the model was statistically significant (p < 0.05) from the model, lack and sum of fit. In the above polynomial equation, the positive sign indicates the synergistic effect of the factors.
From the RSM, the optimum values revealed an acetonitrile percentage (90%), flow rate (1.0 ml), and heat block temperature (230°C) with composite desirability of 0.826 (Fig. 3). From the predicted values, an experimental run was carried out for which the minimal tailing factor and maximum peak area were obtained with an experimental error of 2.47% and 2.17% with the 95% confidence level, respectively. Figure 4 shows the interaction of factors through perturbation plots.
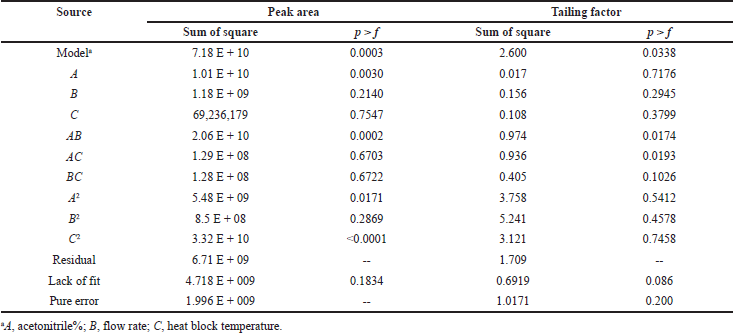 | Table 3. Statistical results of peak area and tailing factor. [Click here to view] |
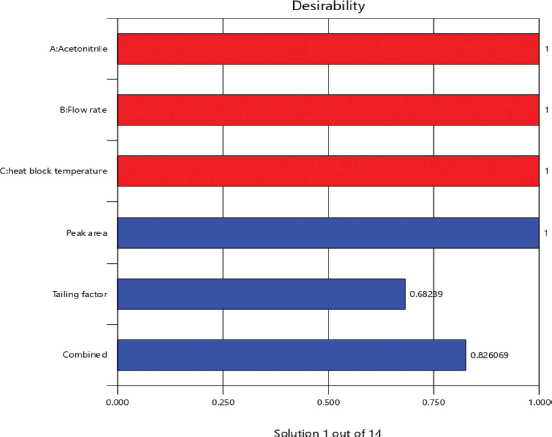 | Figure 3. Desirability for optimization of factors through bar graph. [Click here to view] |
METHOD VALIDATION
The specificity of the method was studied for any endogenous interference from the excipients at the retention time of Riociguat. From Figure 2, it was observed that no endogenous interferences were seen at the retention time of the drug. The accuracy of the developed method was determined by recovery studies for three QC samples (Table 4). The recovery results obtained were found to be in the range of 98.1%–101.8%, which also suggests the suitability of the developed method for routine experimental analysis of the formulations (Table 5). The intraday and interday precision studies were used to carry out the repeatability studies (n = 6) of the QC samples. The %RSD results were found to be <1% for intraday precision and <2 for interday precision (Table 4). The obtained results were found to be within the limit. The method linearity was evaluated over the concentration range of 0.5–110 ng/ml. The linear regression coefficient was found to be y = 170,550x + 177,597 with an R2 of 0.9995. Furthermore, the detection and quantification limit was calculated based on the signal-to-noise ratio, for which the detection limit was found to be 0.1 ng/ml and LOQ was found to be 0.5 ng/ml. The system suitability studies of Riociguat (30 ng/ml) were carried out for tailing factor, asymmetric factor, and number of theoretical plate. The studied factors were found to be within the limit of %RSD less than 1% (Table 6).
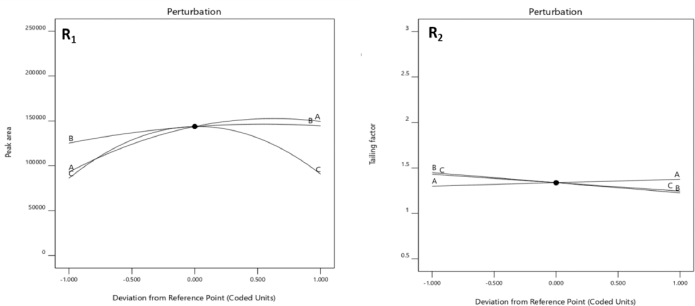 | Figure 4. The effect of peak area (A), flow rate (B), heat block temperature (C) on peak area (R1), and tailing factor (R2) through perturbation plots. [Click here to view] |
 | Table 4. Accuracy and precision results of Riociguat. [Click here to view] |
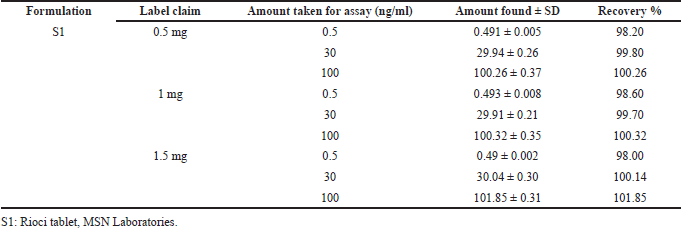 | Table 5. Recovery results for Riociguat in the formulation. [Click here to view] |
 | Table 6. System suitability study for 30 ng/ml standard. [Click here to view] |
CONCLUSION
A simple and rapid analytical method has been successfully developed using the QbD-based approach for the estimation of Riociguat in bulk and in its formulations using the Design Expert® software version 10.0. The independent factors were analyzed using ANOVA and their effect has been reported as perturbation plots. The optimal setting of the conditions was within the analytical design space using the desirability function. Furthermore, the developed method was validated as per the ICH guidelines for accuracy, precision, specificity, linearity, LOD, LOQ, and system suitability parameters. The present method is simple, accurate, precise, and economical for the analysis of Riociguat in comparison to previous articles.
CONFLICT OF INTEREST
All the authors declare that there are no conflicts of interest.
FUNDING
The authors thank Tamil Nadu Pharmaceutical Sciences Welfare Trust, Chennai, for awarding the fellowship amount of Rs.12,000 for the research work.
REFERENCES
Ali JM, Hardman G, Page A, Jenkins DP. Chronic thromboembolic pulmonary hypertension: an underdiagnosed entity? Hosp Pract, 2012; 40(3):71–9. CrossRef
Gnoth MJ, Hopfe PM, Czembor W. Determination of riociguat and its major human metabolite M-1 in human plasma by stable-isotope dilution LCMS/MS. Bioanalysis, 2015; 7(2):193–205. CrossRef
Goeroeg S. The paradigm shifting role of chromatographic methods in pharmaceutical analysis. J Pharm Biomed Anal, 2012; 69:2–8. CrossRef
ICH Q2 (R1): Validation of analytical procedures: text and methodology. In: International Conference on Harmonization, 2005 Nov. [ONLINE] Available via https://www.fda.gov/downloads/drugs/guidances/ucm073384.pdf (Accessed 20 December 2019).
Kumar L, Reddy MS, Managuli RS, Pai G. Full factorial design for optimization, development and validation of HPLC method to determine valsartan in nanoparticles. Saudi Pharm J, 2015; 23(5):549–55. CrossRef
Lionberger RA, Lee SL, Lee L, Raw A, Lawrence XY. Quality by design: concepts for ANDAs. AAPS J, 2008; 10(2):268–76. CrossRef
Monks K, Molnár I, Rieger HJ, Bogáti B, Szabó E. Quality by design: multidimensional exploration of the design space in high performance liquid chromatography method development for better robustness before validation. J Chromatogr A, 2012; 1232:218–30. CrossRef
Nayak R, Narenderan ST, Meyyanathan SN, Krishna LVS. Analytical method development and validation for the determination of Riociguat in their formulations by LC-MS/MS. J Glob Pharm Tech, 2018; 10(12):19–23.
Nethercote P, Ermer J. Quality by design for analytical methods: implications for method validation and transfer. Pharm Tech, 2012; 36(10):74–9.
Orlandini S, Pinzauti S, Furlanetto S. Application of quality by design to the development of analytical separation methods. Anal Bioanal Chem, 2013; 405(2–3):443–50. CrossRef
Rozet E, Ziemons E, Marini R, Boulanger B, Hubert P. Quality by design compliant analytical method validation. Anal Chem, 2011; 84(1):106–12. CrossRef
Temgire PR, Sobia G, Kumar MV, Mohan S, Smita N, Vaidhun B. Development and validation of reverse-phase high-performance liquid chromatography method for quantitative estimation of riociguat in tablet dosage form. J Pharm Res, 2018; 12(4):461–5.