
INTRODUCTION
Two or more drugs can be combined to increase efficacy, decrease toxicity, and reduce drug resistance to implement a promising approach for obtaining better health treatment (Foucquier and Guedj, 2015). Genistein (GEN), an isoflavone aglycone from Glycine max, was reported due to its beneficial function not only for daily consumption but also for health enhancement (Sirotkin, 2014). Soy GEN increased human immunity and proved to be potential antibreast cancer and immunomodulatory agents for postmenopausal women (Ryan-Borchers et al., 2006; Sakai and Kogiso, 2008; Yuliani et al., 2016). Curcumin (CUR), a secondary metabolite contained in Curcuma longa L., was commonly consumed to increase human immunity (Catanzaro et al., 2018). A recent study reported the potential activity of CUR as a therapeutic agent against pneumonia and acute respiratory distress syndrome caused by virus infection (Liu and Ying, 2020). The molecular mechanism of combination flavonoid immunomodulatory agents was studied (Hosseinzade et al., 2019). Other recent studies demonstrated the synergistic effect of combination GEN and CUR as an antitrypanosomal agent (Ettari et al., 2019).
The increasing research interest on the combination of GEN and CUR should be supported with the development of an analytical method to ensure the quality and safety of the product. GEN and CUR were reported to have UV-Vis absorbance in the range of 200–800 (Kadam et al., 2018; Luan et al., 2017). However, the interference between GEN and CUR spectral profiles near 260 nm can become the limitation for performing simultaneous conventional UV-Vis method (Priyadarsini, 2014; Yatsu et al., 2016). Chromatographic techniques such as high-performance liquid chromatography (HPLC) and high-performance thin-layer chromatography (HPTLC) can be applied in the analysis of drugs, foods, and herbal products (Dwiastuti et al., 2018; Prabaningdyah et al., 2017; Riswanto et al., 2015; Satpathy et al., 2017; Yuliani et al., 2018). However, chromatographic methods were quite expensive and time-consuming compared to the spectroscopic method (Suhandy and Yulia, 2017).
The aim of this study was to combine UV-Vis spectroscopy with chemometrics techniques for analyzing GEN and CUR simultaneously without any separation stages. Spectral data of UV-Vis can be processed using an appropriate chemometrics algorithm for both quantitative and qualitative analyses (Hussain et al., 2018; Kambira et al., 2020). Multivariate calibration of PCR and partial least squares (PLS) regression was generated to quantitatively analyze the content of GEN and CUR in the binary mixture. Sparse partial least square-discriminant analysis (sPLS-DA), a supervised pattern recognition model, was built to differentiate between GEN, CUR, the mixture of GEN and CUR, and its solvent.
MATERIALS AND METHODS
Materials and instrumentation
GEN and CUR standards were purchased from Sigma Aldrich. The solvent used in this study was methanol (BLANK) obtained from Merckmillipore. A system of UV-Vis Spectrophotometer type UV 1,800 (Shimadzu, Japan) equipped with quartz cuvette 1 cm (Hellma, Plainview, NY) was controlled using UVProbe Software (Shimadzu, Japan) to scan and record all UV-Vis spectra of samples. An ultra-micro-analytical balance RADWAG® series of UYA 2.3Y (max. 2.0 g, minute 0.01 mg, and readability 0.1 ¼g) was utilized in this study. A set of Socorex® micropipettes was used in preparing the solutions. The data of UV spectral were exported to Excel 2016 (Microsoft Inc., Redmond, WA) and saved in the format files of .csv.
Chemometrics software
Multivariate calibrations and spectral preprocessing were carried out using R Studio software version 1.1.456 with “pls” and “prospectr” packages, respectively (Mevik and Wehrens, 2007; Stevens et al., 2020). sPLS-DA modeling and tuning were generated using “mixOmics” package (Rohart et al., 2017).
Standard solutions preparation
Accurate weights of 9.585 mg of GEN and 9.755 mg of CUR were transferred into two separated 50 ml volumetric flasks for each compound, followed by dilution with BLANK into the volume. These solutions were labeled as GEN and CUR stock solution.
Preparation of calibration and validation standard solutions
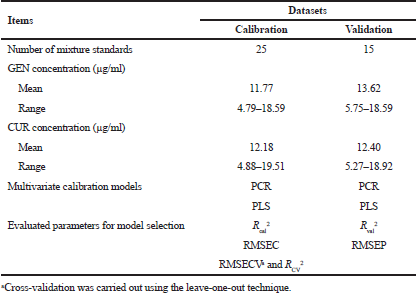
A set of calibration and validation solutions containing GEN and CUR was prepared from the stock solutions to obtain 25 concentration variation of calibration solutions and 15 concentration variation of validation solutions as presented in Table 1. The concentration variation for both calibration and validation solutions was randomly assigned using Excel 2016 (Microsoft Inc., Redmond, WA).
Solutions for the sPLS-DA study were prepared in four classes as to which they would be categorized as follows: blank/solvent solution or BLANK, GEN solution, CUR solution, and binary mixture containing GEN and CUR. GEN solutions were prepared by transferring 400, 405, 410, and 415 ¼l of GEN stock solution into a 5 ml volumetric flask, followed by dilution with BLANK into the volume. CUR solutions were prepared by transferring 400, 405, 410, and 415 ¼l of CUR stock solution, followed by dilution with BLANK into the volume. Fifteen binary mixtures of GEN and CUR were obtained from the calibration and validation set solutions chosen randomly.
Spectroscopic analysis for generating multivariate calibration
All prepared solutions were scanned using UV-Vis Spectrophotometer type UV 1,800 (Shimadzu, Japan) at 200–800 nm with an interval of 2 nm. The absorbance values of every single wavelength point obtained from the scanning process were collected and statistically analyzed using the R studio software. Absorbance data of calibration and validation solution were treated and preprocessed into five types of UV-Vis spectral, namely, original, first derivative, second derivative, standard normal variate (SNV), and Savitzky-Golay (SG) smoothing with a window width of 11 points and polynomial order three.
Two multivariate calibration models of PCR and PLS were generated and applied in order to generate a suitable predictive model for each compound. Multivariate calibration model performance was evaluated by assessing several statistical parameters such as coefficient of determination for calibration (Rcal2), cross-validation (RCV2), validation (Rval2), root mean square error of calibration (RMSEC), root mean square error of cross validation (RMSECV), and root mean square error of prediction (RMSEP). In addition, cross-validation as internal validation was carried out using the leave-one-out technique. The selected multivariate calibration model for each compound was determined by evaluating values of R2 and their root mean square error values.
 | Table 1. Information on calibration and validation data sets for model selection and statistical analysis. [Click here to view] |
Modeling and tuning of sPLS-DA model
GEN, CUR, their binary mixture, and BLANK as a solvent were discriminated statistically by employing sPLS-DA technique. The sPLS-DA classification model was visualized by 3D and background plot generated using the maximum prediction distance. Classification performance of generated sPLS-DA model was evaluated using the area under the receiver operating characteristic (AUROC). The sPLS-DA performance was determined as a classification error rate and a balanced error rate (BER). Analysis of classification error rate and BER resulted in the optimum number of components which obtained the best performance considering the misclassification error rate and BER. Hence, the final result of sPLS-DA was built by applying the optimum number of components to the model and visualized as an individual sPLS-DA plot.
RESULTS AND DISCUSSION
Spectroscopic analysis
The conventional spectroscopy technique was commonly utilized to quantitatively analyze a single component of analyte using one or two wavelength detection approaches (Edwards et al., 2001). However, determining multiple components in a mixture by multiple wavelength spectroscopic detection is now challenging due to the reality of broad range drug combination or other real samples (Dzulfianto et al., 2018; Suhandy and Yulia, 2017). GEN, one of the isoflavone aglycones, was characterized by the UV absorption at 260 nm due to the presence of chromophore and auxochromes of hydroxyl from its polyphenolic structure (Maskey et al., 2003; Riswanto et al., 2020; Yatsu et al., 2016). CUR showed identical absorption in the wavelength range from 350 to 450 nm and in the UV region range of 250–270 nm (Priyadarsini, 2014).
Figure 1 shows the UV spectral profiles and chemical structures of GEN, CUR, and their combination. GEN showed the maximum absorption at 260 nm, while CUR spectral was characterized by maximum absorption at 420 nm and the presence of a smaller absorption peak at 262 nm. Notably, the spectral overlapping at 260–262 nm contributed to the limitation of simultaneous analysis of UV-Vis spectroscopy technique. Fortunately, it is possible to employ the chemometrics technique such as multivariate calibration and discriminant analysis to overcome this problem. The simultaneous analysis of GEN and CUR can be carried out by the UV-Vis method using appropriate chemometrics and parameters selection techniques.
Multivariate calibration
Multivariate calibration was initially conducted by preprocessing raw data of scanned spectral into five types of UV-Vis spectral such as original, first derivative, second derivative, SNV, and SG. The purpose of spectral preprocessing was to improve the subsequent bilinear calibration model and make it possible to select a type of preprocessed spectra which resulted in the best multivariate calibration model (Rinnan et al., 2009). Two models of multivariate calibration, namely, PCR and PLS, were developed for all types of spectra. PLS regression was generated using a linear combination of the predictor variables rather than the original, while PCR was built to reduce the number of predictor variables by using their first few principal components (Miller and Miller, 2010).
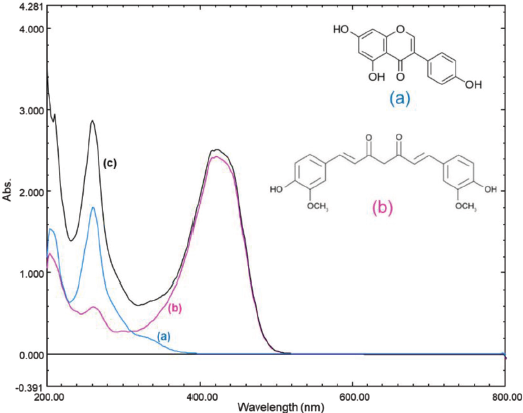 | Figure 1. The UV-Vis spectral profiles and chemical structures of GEN (a), CUR (b), and their binary mixture (c). [Click here to view] |
Table 2 presents the statistical performance of PCR and PLS models for analyzing GEN and CUR simultaneously. PCR of SG spectra and PCR of original/normal spectra were selected as multivariate calibration models for GEN and CUR, respectively. Statistical parameters, namely, R2 (Rcal2, RCV2, and Rval2) and RMSE (RMSEC, RMSECV, and RMSEP) were assessed for selecting the best predictive multivariate calibration model for each compound. The highest value of R2 and the lowest value of RMSE were considered as selection criteria since the highest R2 represents smaller differences between the actual and predicted values, while the lowest RMSE indicates better fit with minimum errors (Irnawati et al., 2020). Cross validation was conducted in this study using the leave-one-out technique in order to avoid the over-optimistic of prediction (Shen et al., 2018).
Figure 2 showing multivariate calibration properties of the selected model for GEN and CUR. The equation for correlating between the actual and the predicted values of GEN was y = 1.0651x−0.853 (R2 = 0.994). The prediction plot of the GEN equation is shown in Figure 2a. The regression coefficient plot of the GEN model is shown in Figure 2b and provided useful information along with confidence intervals from different wavelengths (Jann, 2014). It should be noted that valleys and peaks at a certain wavelength are indicated to be important for GEN determination. The equation for correlating between the actual and the predicted values of CUR was y = 0.969x + 0.498 (R2 = 0.983). The prediction plot of the CUR equation is shown in Figure 2c. The regression coefficient plot of the CUR model is shown in Figure 2d. The important wavelength for generating a multivariate calibration model of CUR was observed at the range of 350–500 nm indicated by the presence of an extensive peak at this region. Surprisingly, the important wavelengths for both GEN and CUR were found at a similar wavelength range compared to the maximum absorption wavelength from their original spectra. From the regression coefficient plots, it was confirmed that UV-Vis spectroscopy is a suitable analytical method for analyzing GEN and CUR. In addition, the visible spectrum range of >500 nm resulted in a very low contribution towards multivariate calibration modeling since there was no significant absorption in this region.
sPLS-DA modeling
In this study, sPLS-DA modeling has been developed. sPLS-DA, a variant of PLS-DA, provided useful advantages in high dimensional data analysis due to its ability to achieve variable selection and dimension reduction simultaneously (Chung and Keles, 2010; Ruiz-Perez and Narasimhan, 2018). Although the PLS algorithm was commonly designed to overcome regression problems, it can be employed as classifier tools in discrimination studies (Lê Cao et al., 2011).
Figure 3 shows the 3D visualization and background prediction of sPLS-DA performance generated using maximum prediction distance. It means the maximum distance is applied to the predicted dummy variables and predicts the category of classes due to the largest dummy value (Rohart et al., 2017). It can be visually seen that the solvent, GEN, CUR, and binary mixture containing GEN and CUR were located in a separated region marked with different colors. However, this visualization was generated without any detailed parameters tuning. It is important to evaluate the sPLS-DA performance with a further model assessment.
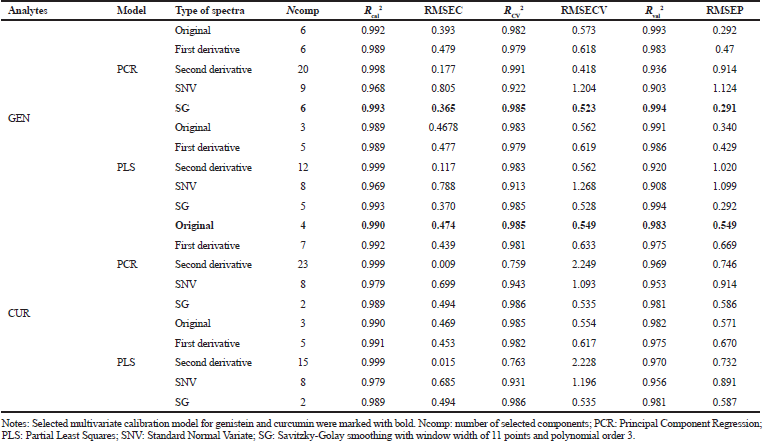 | Table 2. Statistical performance of principal component regression (PCR) model and partial least squares (PLS) model for analyzing GEN and CUR. [Click here to view] |
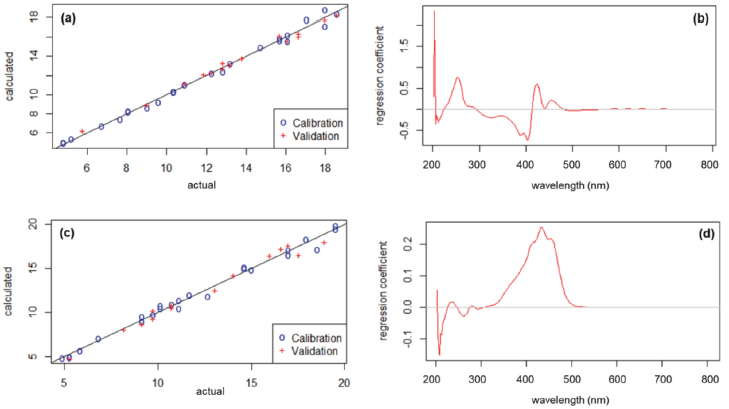 | Figure 2. Multivariate calibration properties of selected model for genistein [prediction plot (a) and regression coefficient plot (b)] and curcumin [prediction plot (c) and regression coefficient plot (c)]. [Click here to view] |
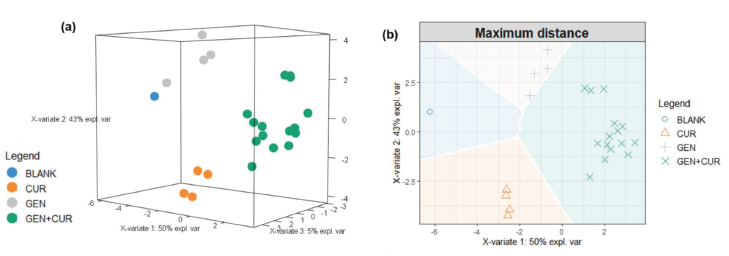 | Figure 3. 3D visualization (a) and background prediction (b) of sPLS-DA performance generated using maximum prediction distance. BLANK = methanol; CUR = curcumin; GEN = genistein; GEN + CUR = binary mixture of GEN and CUR. [Click here to view] |
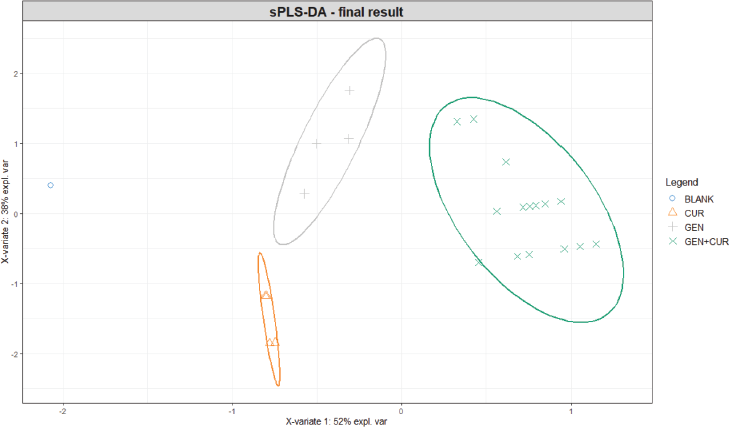
The capability of the sPLS-DA model for discriminating between classes was evaluated using the AUROC which consisted of area under the curve (AUCuthe curve) and receiver operating characteristics (ROCpperating c). ROC represents probability and AUC represents the degree of separability of the model (Narkhede, 2018). Table 3 presents the results of the AUROC analysis of Component 1 and Component 2. As a common PLS model, the first two principal components contained the most information and variance compared to other components. With the higher AUC, a better model was obtained to distinguish between the true positive and true negative values. The solvent of BLANK and binary mixture of GEN and CUR were correctly discriminated compared to others. The chance of the sPLS-DA model to discriminate spectral patterns between CUR and others and GEN and others was 86.4% and 68.2%, respectively. However, the engagement of Component 2 in generating the sPLS-DA model improved the chance of the model to distinguish GEN from other classes up to 96.6%.
 | Table 3. Results of the AUROC analysis on component 1 and component 2. [Click here to view] |
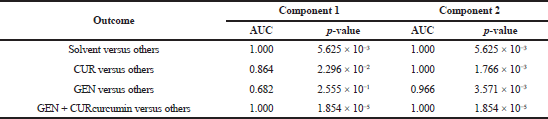
 | Figure 4. Classification error rate (a) and BER (b) plot from sPLS-DA tuning process. [Click here to view] |
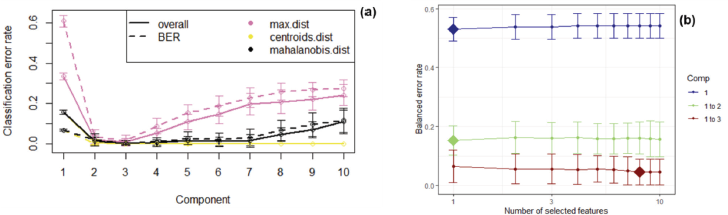
 | Figure 5. Final individual plot results of tuned sPLS-DA model. BLANK = methanol; CUR = curcumin; GEN = genistein; GEN + CUR = binary mixture of GEN and CUR. [Click here to view] |
Tuning parameters and numerical outputs of the sPLS-DA model were carried out in this study to implement the repetition and stratification of cross validation for model comparison. Three parameters should be chosen: the number of components, the number of variables “keepX” to select on each component, and the prediction distance. The cross-validation process was executed by applying 5-fold cross validation repeated 30 times. Figure 4 shows the classification error rate (a) and BER (b) plot from sPLS-DA tuning process. Ten first components were stated in the list of initial “keepX” as variables. The number of components of three was selected since the classification error rate graph showed the lowest error rate towards all types of prediction distance. Balance error rate graph illustrates that the suggested list of “keepX” for three components was 1, 1, and 8.
Figure 5 shows the final individual plot after the sPLS-DA tuning model. All classes including BLANK, GEN, CUR, and GEN CUR mixture were explicitly separated. In addition, based on our findings, the parameters and numerical output tuning can be contextually applied to improve sPLS-DA model performance with the consideration of its error rate towards classification ability.
CONCLUSION
UV-Vis spectroscopy combined with multivariate calibrations was successfully generated for simultaneous determination of binary mixture containing GEN and CUR without any separation process. Multivariate calibration models for GEN and CUR were PCR of SG spectra and PCR of original spectra, respectively. The development of sPLS-DA as a statistical classifier method allowed the discrimination of GEN, CUR, and their mixture, as well as BLANK as a solvent. The parameters and numerical outputs tuning contributed not only to evaluating sPLS-DA model but also to enhancing its performance by selecting the minimum error rate for generating the final model.
This UV-Vis method and chemometrics techniques’ combination proved to be rapid, simple, effective, and low cost compared to other methods with a separation process such as HPLC or HPTLC. However, it is quite interesting to develop spectroscopic or other analytical methods employed with chemometrics technique using natural product samples, for example, the combination of soybean and Curcuma longa L. extracts containing GEN and CUR.
ACKNOWLEDGMENTS
The authors are grateful to the Faculty of Pharmacy, Universitas Gadjah Mada, Yogyakarta, Indonesia, for the provided facilities. This research was financially funded by Doctoral Thesis Research Grant (Penelitian Disertasi Doktor), the Ministry of Research and Technology/National Agency for Research and Innovation, with Contract Letter no. 2066/UN1/DITLIT/DIT-LIT/PT/2020 (Amendment Letter no.: 3089/UN1.DITLIT/DIT-LIT/PT/2020), awarded to Prof. Dr. apt. Sudibyo Martono, MS.
CONFLICT OF INTEREST
All the authors declared there is no conflict of interest.
AUTHORS’ CONTRIBUTION
Florentinus Dika Octa Riswanto carried out the main laboratory works and initial publication writing. Abdul Rohman supervised the experimental works in the field of chemometrics. Suwidjiyo Pramono supervised the manuscript and data analysis. Sudibyo Martono provided the research funding, stated the conceptualization, and gave the final approval for publication.
ETHICAL APPROVALS
This study does not involve experiments on animals or human subjects.
PUBLISHER’S NOTE
This journal remains neutral with regard to jurisdictional claims in published institutional affiliation.
REFERENCES
Catanzaro M, Corsini E, Rosini M, Racchi M, Lanni C. Immunomodulators inspired by nature: a review on curcumin and Echinacea. Molecules, 2018; 23(11):1–17. CrossRef
Chung D, Keles S. Sparse partial least squares classification for high dimensional data. Stat Appl Genet Mol Biol, 2010; 9(1):1–29. CrossRef
Dwiastuti R, Marchaban, Istyastono EP, Riswanto FDO. Analytical method validation and determination of free drug content of 4-n-butylresorcinol in complex lipid nanoparticles using RP-HPLC method. Indones J Chem, 2018; 18(3):496–502. CrossRef
Dzulfianto A, Riswanto FDO, Rohman A. The employment of UV-spectroscopy combined with multivariate calibration for analysis of paracetamol, Propyphenazone and caffeine. Indones J Pharm, 2018; 28(4):191–7. CrossRef
Edwards AC, Hooda PS, Cook Y. Determination of nitrate in water containing dissolved organic carbon by ultraviolet spectroscopy. Int J Environ Anal Chem, 2001; 80(1):49–59. CrossRef
Ettari R, Previti S, Maiorana S, Allegra A, Schirmeister T, Grasso S, Zappalà M. Drug combination studies of curcumin and genistein against rhodesain of Trypanosoma brucei rhodesiense. Nat Prod Res, 2019; 33(24):3577–81. CrossRef
Foucquier J, Guedj M. Analysis of drug combinations: current methodological landscape. Pharmacol Res Perspect, 2015; 3(3):e00149. CrossRef
Hosseinzade A, Sadeghi O, Biregani AN, Soukhtehzari S, Brandt GS, Esmaillzadeh A. Immunomodulatory effects of flavonoids: possible induction of T CD4+ regulatory cells through suppression of mTOR pathway signaling activity. Front Immunol, 2019; 10:1–12. CrossRef
Hussain J, Mabood F, Al-Harrasi A, Ali L, Rizvi TS, Jabeen F, Gilani SA, Shinwari S, Ahmad M, Alabri ZK, Al Ghawi SHS. New robust sensitive fluorescence spectroscopy coupled with PLSR for estimation of quercetin in Ziziphus mucronata and Ziziphus sativa. Spectrochim Acta A Mol Biomol Spectrosc, 2018; 194:152–7. CrossRef
Irnawati, Riyanto S, Martono S, Rohman A. The employment of FTIR spectroscopy and chemometrics for authentication of essential oil of curcuma mangga from candle nut oil. Food Res, 2020; 4(1):42–8. CrossRef
Jann B. Plotting regression coefficients and other estimates. Stata J, 2014; 14(4):708–37. CrossRef
Kadam PV, Yadav KN, Bhingare CL, Patil MJ. Standardization and quantification of curcumin from curcuma longa extract using UV visible spectroscopy and HPLC. J Pharmacogn Phytochem, 2018; 7(5):1913–8.
Kambira PFA, Notario D, Gunawan U, Dhamayanti S, Ningrum RWK, Ambarita SGO, Polin G. Combination UV-Vis spectroscopy and partial least square for detecting adulteration paracetamol and piroxicam in traditional medicines. J Pharm Sci Community, 2020; 17(1):41–50. CrossRef
Lê Cao KA, Boitard S, Besse P. Sparse PLS discriminant analysis: biologically relevant feature selection and graphical displays for multiclass problems. BMC Bioinformatics, 2011; 12(1):253. CrossRef
Liu Z, Ying Y. The inhibitory effect of curcumin on virus-induced cytokine storm and its potential use in the associated severe pneumonia. Front Cell Dev Biol, 2020; 8:1–10. CrossRef
Luan F, Tang LL, Chen XX, Liu HT. Simultaneous determination of daidzein, genistein and formononetin in coffee by capillary zone electrophoresis. Separations, 2017; 4(1):1–8. CrossRef
Maskey RP, Asolkar RN, Speitling M, Hoffmann V, Grün-Wollny I, Fleck WF, Laatsch H. Flavones and new isoflavone derivatives from microorganisms: isolation and structure elucidation. Z Naturforsch Sect B J Chem Sci, 2003; 58(7):686–91. CrossRef
Mevik BH, Wehrens R. The pls package: principal component and partial least squares regression in R. J Stat Softw, 2007; 18(2):1–23. CrossRef
Miller JM, Miller JC. Statistics and chemometrics for analytical chemistry. 6th edition, Pearson Education Limited, Harlow, UK, 2010.
Narkhede S. Understanding AUC - ROC curve [ONLINE], 2018. Available via https://towardsdatascience.com/understanding-auc-roc-curve-68b2303cc9c5 (accessed 27 September 2020).
Prabaningdyah NK, Riyanto S, Rohman A, Siregar C. Application of HPLC and response surface methodology for simultaneous determination of curcumin and desmethoxy curcumin in curcuma syrup formulation. J Appl Pharm Sci, 2017; 7(12):058–64.
Priyadarsini KI. The chemistry of curcumin: from extraction to therapeutic agent. Molecules, 2014; 19(12):20091–112. CrossRef
Rinnan Å, van den Berg F, Engelsen SB. Review of the most common pre-processing techniques for near-infrared spectra. Trends Analyt Chem, 2009; 28(10):1201–22. CrossRef
Riswanto FDO, Endang Lukitaningsih RR, Martono S. Analytical method validation and determination of pyridoxine, nicotinamide, and caffeine in energy drinks using thin layer chromatography-densitometry. Indones J Chem, 2015; 15(1):9–15. CrossRef
Riswanto FDO, Rohman A, Pramono S, Martono S. Employing an R software package rsm for optimizing of genistein, daidzein, and glycitein separation and its application for soy milk analysis by HPLC method. Indones J Chem, 2020; 20(5):1184–98. CrossRef
Rohart F, Gautier B, Singh A, Lê Cao KA. mixOmics: an R package for ‘omics feature selection and multiple data integration. PLoS Comput Biol, 2017; 13(11):1–19. CrossRef
Ruiz-Perez D, Narasimhan G. So you think you can PLS-DA? IEEE 8th International Conference Computational Advances in Bio and Medical Sciences, Las Vegas, NV, 2018, p 207225. CrossRef
Ryan-Borchers TA, Park JS, Chew BP, McGuire MK, Fournier LR, Beerman KA. Soy isoflavones modulate immune function in healthy postmenopausal women. Am J Clin Nutr, 2006; 83(5):1118–25. CrossRef
Sakai T, Kogiso M. Soy isoflavones and immunity. J Med Investig, 2008; 55(3–4):167–73. CrossRef
Satpathy S, Patra A, Hussain MD, Ahirwar B. Simultaneous estimation of genistein and daidzein in Pueraria tuberosa (Willd.) DC by validated high-performance thin-layer chromatography (HPTLC) densitometry method. J Liq Chromatogr Relat Technol, 2017; 40(10): 499–505. CrossRef
Shen S, Wang J, Zhuo Q, Chen X, Liu T, Zhang SQ. Quantitative and discriminative evaluation of contents of phenolic and flavonoid and antioxidant competence for Chinese honeys from different botanical origins. Molecules, 2018; 23(5):1–20. CrossRef
Sirotkin AV. Phytoestrogens and their effects. Eur J Pharmacol, 2014; 741(1):230–6. CrossRef
Stevens A, Ramirez-Lopez. An introduction to the prospectr package [ONLINE], 2020. Available via https://cran.r-project.org/web/packages/prospectr/vignettes/prospectr.html (accessed 27 September 2020).
Suhandy D, Yulia M. The use of partial least square regression and spectral data in UV-visible region for quantification of adulteration in Indonesian palm civet coffee. Int J Food Sci, 2017; 2017(6274178):1–7. CrossRef
Yatsu FKJ, Koester LS, Bassani VL. Isoflavone-aglycone fraction from glycine max: a promising raw material for isoflavone-based pharmaceutical or nutraceutical products. Braz J Pharmacogn Soc Bras Farmacognosia, 2016; 26(2):259–67. CrossRef
Yuliani SH, Gani MR, Istyastono EP, Riswanto FDO. Optimization of genistein and daidzein extraction from a tempeh- fermented product of soybean. J Pharm Pharmacogn Res, 2018; 6(4):231–41.
Yuliani SH, Istyastono EP, Riswanto FDO. The cytotoxic activity on T47D breast cancer cell of genistein-standardized ethanolic extract of tempeh - a fermented product of soybean (Glycine max). Orient J Chem, 2016; 32(3):1619–24. CrossRef