
INTRODUCTION
Apium graveolens (celery) is a member of the Apiaceae (Umbelliferae) or the parsley family. This plant grows well in the tropical and subtropical regions of Asia and Africa (Kooti and Daraei, 2017; Shams et al., 2015) and is extensively used as a vegetable, spice, and medicinal herb. Apart from its diuretic, laxative, and sedative effects, it has been empirically used also to decrease blood pressure and improve joint problems. Various pharmacological studies have proven that A. graveolens has hepatoprotective, antioxidant, larvicidal, anticancer, antidiabetic, anti-inflammatory, antimicrobial, analgesic, antiulcer, antispasmolytic, anti-infertility, antiplatelet, hypocholesterolemic, and cardiotonic properties (Al-Asmari et al., 2017). These biological activities have been attributed to its phytoconstituents, including limonene, selinene, apigenin, luteolin, and kaempferol (Kooti and Daraei, 2017).
Phytochemicals are present with varying compositions and levels depending on several factors, including the cultivar or genetic factor of plants, geographical origins, agricultural practices, harvesting and postharvesting processes, and extraction procedures (Kartini and Azminah, 2012; Kartini et al., 2014, 2019; Oktaviyanti et al., 2019; Shawky and Abou El Kheir, 2018; Stan et al., 2014). Chemical compounds control the safety and efficacy of herbal products. How to maintain their consistency has been the focal project of the research and development of herbal medicines. Therefore, all of the factors mentioned above, including geographical origin, need to be thoroughly understood to maintain the consistency of the quality, safety, and efficacy of A. graveolens-based products. There have been various approaches proposed for this requirement, namely determination of one or more compounds as either active or markers and fingerprint analysis (Xie et al., 2006). Determining the concentration of a single or a group of bioactive or marker compound(s) can be considered as an approach, even though it has a number of limitations. A. graveolens contains various chemical compounds with a slight difference in concentration, which is potentially attributable to geographical origin. For this reason, information on the levels of a few compounds is deemed inadequate. Instead, it must be accompanied by an analytical method that allows researchers to describe the chemical compounds in a crude drug with more details. Profiles or fingerprints of chemical compounds, which can be identified by chromatography or spectroscopy, are believed to be the most appropriate approach. Fingerprints depict the entire chemical characteristics of the test plant (Tistaert et al., 2011).
Fourier-transform infrared (FTIR) is an efficient spectroscopic technique applicable to identifying the fingerprints of medicinal plants. The FTIR spectrum consists of complex data describing all the signals of chemical compounds contained in a sample. Changes in the position and intensity of peaks in the FTIR spectrum are associated with changes in the composition of chemical compounds in said sample. Therefore, the FTIR spectrum can be used to distinguish the geographical origin of the same plant species or closely related species, even though the overall composition of chemical compounds in each of them is unknown (Rohman et al., 2014; Sun et al., 2010). Visual discrimination of the FTIR spectra of a species coming from different geographical locations is challenging because the signal intensity is the only distinguishing factor. In response to this, chemometrics becomes necessary to facilitate the fingerprinting of chemical compounds in medicinal plants (Gad et al., 2013). This study was designed to classify A. graveolens based on their geographical origin by FTIR-based fingerprinting coupled with several chemometric methods, which, in this study, are principal component (PC) analysis (PCA), cluster analysis (CA), and discriminant analysis (DA).
MATERIALS AND METHODS
Materials
Apium graveolens var. secalinum Alef. leaves were determined by the Center for Information and Development of Traditional Medicine, University of Surabaya (certificate number: 1403/D.T/VII/2019), and by B2P2TOOT Tawangmangu (certificate number: YK.01.03/2/290/2020). Plant materials were collected in June 2019 from several provinces on Java Island, i.e., six samples from Jawa Timur, one sample from Jawa Barat, three samples from Jawa Tengah, and three samples of commercially available A. graveolens crude drugs (Table 1). The chemicals used were potassium bromide (KBr, spectroscopy grade, from Merck, Darmstadt, Germany). As for the research equipment, it included a Jasco FT/IR-4200 spectrophotometer (Japan) with a deuterated triglycine sulfate detector, moisture content balance (Moisture Analyzer HB43 Mettler-Toledo GmbH, Laboratory & Weighing Technologies, Switzerland), and analytical balances (Ohaus).
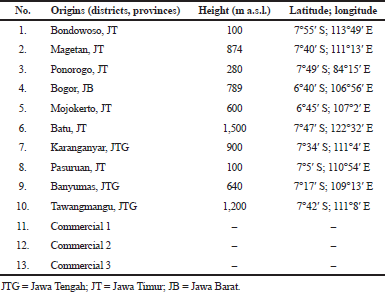 | Table 1. The geographical origins of A. graveolens. [Click here to view] |
Crude drugs preparation
The aerial parts of A. graveolens (Fig. 1) were cut, and then the leaves were separated from the petioles. Afterward, these leaves were washed with tap water, drained, and air-dried at room temperature. The crude drugs (Fig. 2) were then ground and sieved using a 45 mesh.
FTIR spectrum
The FTIR spectrum of A. graveolens was recorded using an FTIR spectrophotometer. A total of 5 mg of crude drug powder was finely crushed with 95 mg of KBr in an agate mortar and then pressed with a manual hydraulic press to form a pellet. Afterward, the pellet was put into a sample holder, and then the spectrum was read at the wavenumbers of 4,000–400 cm−1 with a 4 cm−1 resolution and processed in Spectra Manager version 2 software.
Chemometrics analysis
The FTIR spectra of A. graveolens from various places were then analyzed by chemometrics, i.e., PCA, CA, and DA, in Minitab v.16 software (Minitab Inc., State College, PA). PCA works by translating the spectrum from an n-dimensional variable (spectra) into a PC, in which one score describes each spectrum in the data set in a new, much lower dimensional space. The PCs are sorted based on their eigenvalues that quantify the amount of variance captured by the PC. Then, the PCs that capture the most significant variation in the FTIR spectra (PCs with the greatest eigenvalues) are retained, while the PCs that only contain noises are discarded (PCs that have the smallest eigenvalues). PCA score plots were used to classify samples from their measured properties objectively. The distribution of samples on the graph may reveal a pattern that might be correlated to the general characteristics of the said samples (Yang et al., 2007).
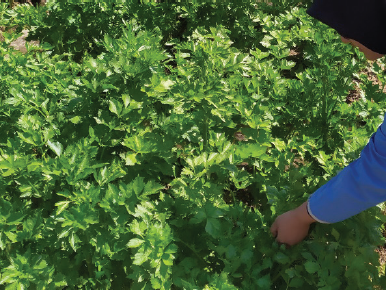 | Figure 1. The aerial part of A. graveolens. [Click here to view] |
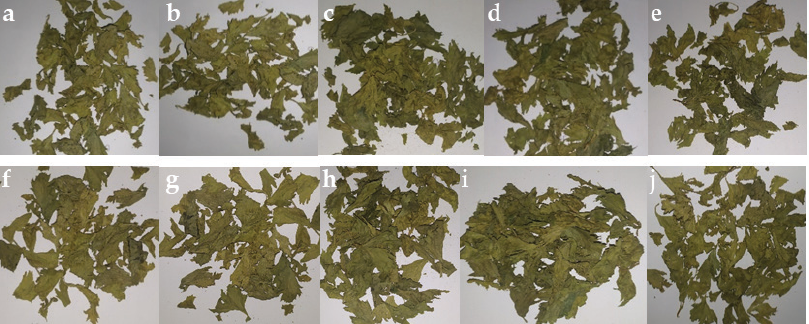 | Figure 2. Apium graveolens crude drugs collected from Bondowoso (a), Magetan (b), Ponorogo (c), Bogor (d), Mojokerto (e), Batu (f), Karanganyar (g), Pasuruan (h), Banyumas (i), and Tawangmangu (j). [Click here to view] |
CA was carried out to classify samples based on similarities in their chemical properties. For this reason, the samples were grouped in a high dimensional space and thereby formed a dendrogram. In the first step, each sample forms a cluster, and then two nearest objects are grouped. In the next step, either a third sample joins the first two or two other samples join a different cluster. Each of these steps results in one cluster less than the previous step until, eventually, all samples are in one cluster (Yang et al., 2007). In this study, single linkage was used and the Euclidean distances produced were calculated.
DA is one of the supervised pattern recognition methods. In general, supervised techniques make use of calibration or training sets with a priori information to build a classification model. The model is then tested using an independent sample set with a priori information to validate the predictive properties of the model before using it on unknown samples. DA assumes that the data are normally distributed, and the variance–covariance matrices of all classes are equal. It focuses on finding the optimal boundaries between object classes. It is a feature reduction method and designed to achieve maximum separation between the different classes. The basis of DA is to carry out linear combinations of the selected descriptors called canonical variates (CV) or discriminant functions that have high-class discriminating power (Gad et al., 2013).
RESULTS AND DISCUSSION
Physical characteristics of crude drugs
Apium graveolens crude drugs used in this study were collected from 10 regions on Java Island, Indonesia. Three samples of commercially available crude drugs were also analyzed. Their clusters were then evaluated by FTIR (fingerprint data) and DA. The physical characteristics and moisture contents of each sample are shown in Figure 2 and Table 2, respectively.
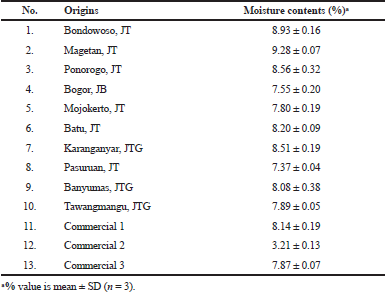 | Table 2. The moisture contents of A. graveolens crude drugs. [Click here to view] |
Apium graveolens samples from Bondowoso and Pasuruan represent the population in low-lying areas (0–100 m a.s.l.), while the ones from Magetan, Bogor, Batu, Karanganyar, and Tawangmangu typify A. graveolens from highlands (>700 m a.s.l.). Regions at moderately elevated altitudes are represented by samples from Ponorogo, Mojokerto, and Banyuwangi. An organoleptic analysis was conducted as the first step in quality evaluation. All samples (Fig. 2) showed significant similarity, with merely slight differences in color. Because the standard harvesting and postharvesting processes were applied to all samples, such differences in organoleptic features could be attributed to their origin. Furthermore, the moisture contents of all samples were not higher than 10%. This parameter is of vital importance because water and/or moisture content in a crude drug is an excellent medium for the growth of microbes, fungi, or insects, and it can encourage hydrolysis and, subsequently, deterioration (WHO, 1998). The Indonesian Herbal Pharmacopoeia sets the loss-on-drying of A. graveolens at no higher than 10% (Depkes, 2008).
The fingerprint regions of FTIR spectra of A. graveolens
The FTIR profile of one sample of A. graveolens [Tawangmangu, Jawa Tengah (JTG)] is shown in Figure 3. It exhibited some typical bands. A fairly wide band at the wavenumber of 3,368 cm−1 indicates the stretching vibrations of the O-H group. At the same time, the stretching vibrations of C-H and C=O appeared at 2,926, 1,734, and 1,651 cm−1, respectively, marking the presence of phenolic and flavonoid compounds. The FTIR profile of the other samples is shown in Figure 4. All spectra shared similarities with merely a slight difference in the transmittance value of each major or minor band. This finding indicates that their chemical compounds are identical.
Fingerprint analysis by PCA
The general principle of fingerprint analysis is to display and analyze, as much as possible, the compounds or characters of samples, so that a valid conclusion can be drawn. The FTIR fingerprints of A. graveolens were analyzed by tabulating the FTIR spectrum data (data not shown). Rows represent the origin of the samples, while the columns show the transmittance value of each peak at each wavenumber. The spectra at the wavenumbers of 1,800–400 cm−1 were tabulated to form 10 × 21 matrix data. These data were then analyzed by PCA (Fig. 5).
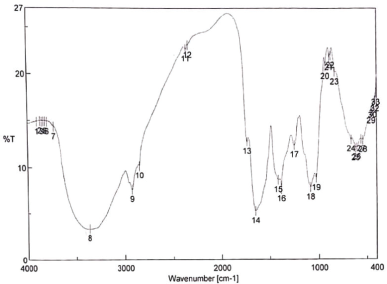 | Figure 3. The FTIR profile of the A. graveolens crude drug from Tawangmangu. [Click here to view] |
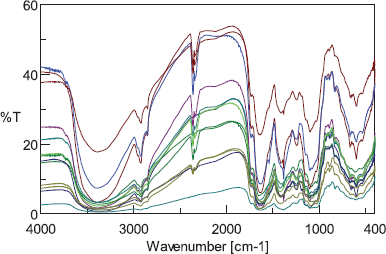 | Figure 4. The FTIR spectra of A. graveolens crude drugs from 10 places of origin and three commercially available A. graveolens crude drugs. [Click here to view] |
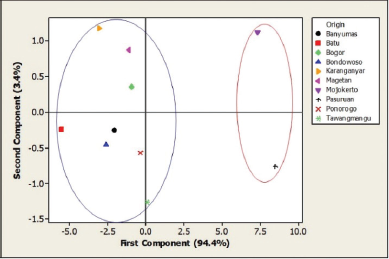 | Figure 5. The PCA score plot. [Click here to view] |
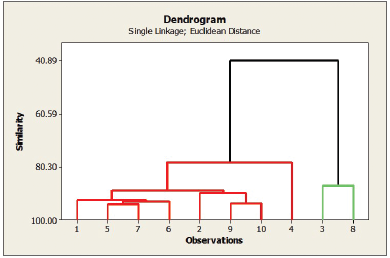 | Figure 6. The dendrogram resulted from the linkage CA. 1–10 represents A. graveolens from Tawangmangu (1), Karaganyar (2), Mojokerto (3), Batu (4), Ponorogo (5), Magetan (6), Bogor (7), Pasuruan (8), Banyumas (9), and Bondowoso (10). [Click here to view] |
The overlaid spectra of 10 A. graveolens samples (Fig. 4) were then analyzed by PCA. The first and second PCs described 94.4% and 3.4% of the variability in the original observations, respectively, and both PCs accounted for 97.8% of the total variance. Therefore, the first two PCs concentrated the multidimensional information into a 2D data set to classify the samples. Figure 5 shows that A. graveolens samples from 10 origins were classified into two groups: the samples from Banyumas, Batu, Bogor, Bondowoso, Karanganyar, Magetan, Ponorogo, and Tawangmangu belonged to group 1, while samples from Mojokerto and Pasuruan formed group 2. Group 1 consisted of samples from low-lying areas, regions at moderately elevated altitudes, and highlands, whereas group 2 was composed of A. graveolens from low-lying areas and regions at moderately elevated heights. This grouping apparently is not related to the height of the growing location. Other factors, like the type of soil and cultivation process, also play an essential role in shaping the quality of medicinal plants. The results of this study are consistent with Royani et al. (2014), which found that the andrographolide content in Andrographis paniculata varies according to provenance and that there is no correlation between the height of location and the andrographolide concentration (Royani et al., 2014).
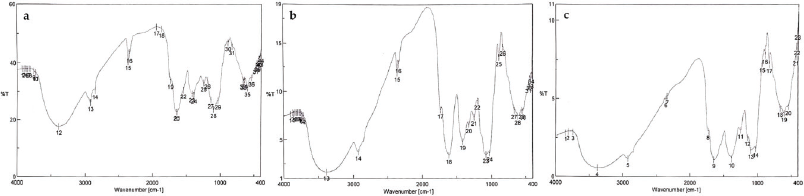 | Figure 7. The FTIR profiles of commercially available A. graveolens crude drugs 1 (a), 2 (b), and 3 (c). [Click here to view] |
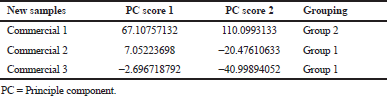 | Table 3. The DA of commercially available A. graveolens crude drugs. [Click here to view] |
Fingerprint analysis by CA
CA was carried out to derive groups from the autoscaled data set and compare them with the previous ones yielded by PCA. Two main components were selected as the basis for classification. The clusters formed (Fig. 6) illustrated different characteristics in A. graveolens. Similar to PCA, CA also found that A. graveolens can be divided into two clusters. The first cluster consisted of crude drugs originating in Tawangmangu, Ponorogo, Bogor, Magetan, Karanganyar, Banyumas, Bondowoso, and Batu, while the second one included samples from Mojokerto and Pasuruan. The high similarity observed between the results of PCA and CA further confirms that the fingerprint and PCA analysis discussed in this article are reliable for assessing the quality of A. graveolens.
Fingerprint analysis by DA
In this study, the FTIR profiles of three commercial samples (Fig. 7) with unknown origins were also analyzed. DA was applied to predict which samples belonged to which group. This method is used to identify new samples so that they can be grouped into the existing ones. If the PC score 1 of the new sample is higher than the PC score 2, the new sample can be classified into group 1. However, if the PC score 2 of the new sample is greater than the PC score 1, then the new sample belongs to group 2. The grouping of the commercial samples is shown in Table 3. Based on the DA results, the three commercial samples can be classified into group 1 or 2. Commercial samples falling into group 1 indicates that their quality is similar to those of group 1 members, and the same case applies to those in group 2.
CONCLUSION
FTIR-based fingerprinting, coupled with chemometrics (PCA and CA), has been proven to be able to discriminate A. graveolens crude drugs that have originated from various locations. The group of the new samples (commercial A. graveolens) can be predicted by the combination of FTIR-based fingerprinting and DA. The development of analytical methods for geographical provenance of A. graveolens will positively affect the quality control of herbal materials, which will ultimately guarantee the safety and efficacy of the product.
AUTHORS’ CONTRIBUTIONS
Kartini, Lis Arifa Dwi Putri, and Mochammad Arbi Hadiyat conceptualized the study; Kartini and Lis Arifa Dwi Putri conducted the experiment; Kartini and Mochammad Arbi Hadiyat analyzed the results. All authors reviewed the manuscript.
ACKNOWLEDGMENTS
This research was funded by the Ministry of Research and Technology/National Research and Innovation Agency of the Republic of Indonesia, with Grant no. 020/SP-Lit/LPPM-01/RistekBRIN/Multi/FF/III/2020.
CONFLICT OF INTEREST
All the authors declare that they have no conflicts of interest for this work.
REFERENCES
Al-Asmari AK, Athar MT, Kadasah SG. An updated phytopharmacological review on medicinal plant of Arab region: Apium graveolens linn. Pharmacogn Rev, 2017; 11:13. CrossRef
Depkes RI. Farmakope herbal Indonesia Edisi I. Departemen Kesehatan Republik Indonesia, Jakarta, Indonesia, 2008.
Gad HA, El-Ahmady SH, Abou-Shoer MI, Al-Azizi MM. Application of chemometrics in authentication of herbal medicines: a review. Phytochem Anal, 2013; 24:1–24. CrossRef
Kartini K, Azminah M. Chromatographic fingerprinting and clustering of Plantago major L. from different areas in Indonesia Asian J Pharm Clin Res, 2012; 5:191–5.
Kartini, Piyaviriyakul S, Siripong P, Vallisuta O. HPTLC simultaneous quantification of triterpene acids for quality control of Plantago major L. and evaluation of their cytotoxic and antioxidant activities. Ind Crops Prod, 2014; 60:239–46. CrossRef
Kartini K, Avanti C, Phechkrajang C, Vallisuta O. Antioxidant activity, HPTLC fingerprint, and discriminant analysis of Plantago major leaves from diverse origins in Indonesia. Pharmacognosy J, 2019; 11:1483–9. CrossRef
Kooti W, Daraei N. A review of the antioxidant activity of celery (Apium graveolens L). J Evid Based Complementary Altern Med, 2017; 22:1029–34. CrossRef
Oktaviyanti ND, Kartini, Mun'im A. Application and optimization of ultrasound-assisted deep eutectic solvent for the extraction of new skin-lightening cosmetic materials from Ixora javanica flower. Heliyon, 2019; 5:e02950. CrossRef
Rohman A, Riyanto S, Sasi AM, Yusof FM. The use of FTIR spectroscopy in combination with chemometrics for the authentication of red fruit (Pandanus conoideus Lam) oil from sunflower and palm oils. Food Biosci, 2014; 7:64–70. CrossRef
Royani JI, Hardianto D, Wahyuni S. Analisa kandungan andrographolide pada tanaman sambiloto (Andrographis paniculata) dari 12 lokasi di Pulau Jawa. J Bioteknologi Biosains Indonesia (JBBI), 2014; 1:15–20. CrossRef
Shams KA, Abdel-Azim NS, Tawfik WA, Hassanein HD, Saleh MA, Hammouda FM. Green extraction techniques: Effect of extraction method on lipid contents of three medicinal plants of Apiaceae. J Chem Pharm Res, 2015; 7:1080–8.
Shawky E, Abou El Kheir RM. Rapid discrimination of different Apiaceae species based on HPTLC fingerprints and targeted flavonoids determination using multivariate image analysis. Phytochem Anal, 2018; 29:452–62. CrossRef
Stan M, OpriÅŸ O, Lung I, Soran M-L. High-performance thin-layer chromatographic quantification of myristicin and linalool from leaf extracts of microwave-irradiated parsley, dill, and celery. JPC-J Planar Chromatogr-Mod TLC, 2014; 27:97–101. CrossRef
Sun S, Chen J, Zhou Q, Lu G, Chan K. Application of mid-infrared spectroscopy in the quality control of traditional Chinese medicines. Planta Med, 2010; 76:1987–96. CrossRef
Tistaert C, Dejaegher B, Heyden YV. Chromatographic separation techniques and data handling methods for herbal fingerprints: a review. Anal Chim Acta, 2011; 690:148–61. CrossRef
WHO. Quality control methods for medicinal plant materials. WHO, Geneva, Switzerland, 1998.
Xie P, Chen S, Liang Y-Z, Wang X, Tian R, Upton R. Chromatographic fingerprint analysis—a rational approach for quality assessment of traditional Chinese herbal medicine. J Chromatogr A, 2006; 1112:171–80. CrossRef
Yang J, Chen LH, Zhang Q, Lai MX, Wang Q. Quality assessment of Cortex cinnamomi by HPLC chemical fingerprint, principle component analysis and cluster analysis. J Sep Sci, 2007; 30:1276–83. CrossRef