INTRODUCTION
Hepatocellular carcinoma (HCC) is the fourth most commonly occurring cancer mortalities worldwide. Hepatitis B and Hepatitis C (HBV and HCV) infections, chronic intake of alcohol, diabetes mellitus, and obesity are the major risk factors associated with HCC (Modi et al., 2019; Thiel et al., 2014). Among this, HBV and HCV were found to be the major causes for cancer-related deaths globally since they ultimately lead to the progression in the hepatic damage, resulting in liver cirrhosis and HCC. Males are more prone to develop liver cancer than women (Karaman et al., 2014). Sorafenib tosylate (ST) was primarily approved to treat advanced HCC and renal cell carcinoma, the most commonly occurring cancer types in African and Asian countries (Hsu et al., 2009). Chemically, ST is 4-(4-{3-[4-chloro-3-(trifluoromethyl)phenyl]uredo}phenoxy)-N-2-methylpyridine-2-carboxamide 4-methyl benzenesulfonate, a multi-tyrosine kinase inhibitor given orally in the treatment of aberrant angiogenesis (Fig. 1). It bears a sturdy crystal lattice with low aqueous solubility and high lipophilicity (Log p = 3.8). The marketed oral formulation NEXAVAR®, containing ST as the active pharmaceutical ingredient (API), is given orally (dose: 200–400 mg twice a day) to humans. ST with oral bioavailability of 29%–38% comes under the BCS class III drugs. The interference of food and pH was found to have a significant effect on the bioavailability of the drug. A high-fat diet significantly reduces the absorption of the drug from the stomach and intestines. There are shreds of evidence which suggests that bioavailability could be decreased by treatment with antacids, specifically proton pump inhibitors (Herbrink, et al., 2015; Kane et al., 2006).
Piperine, a natural alkaloid obtained from pepper (Family: Piperaceae), is known for its bioenhancing properties. It is used as a kitchen spice and food additive worldwide. Piperine is a natural alkaloid well known for its bioenhancing property when combined with several drugs with poor bioavailability, viz., isoniazid, rifampicin, and curcumin (Atal et al., 1985; 2010). Various compositions of different classes of APIs contain piperine as a bioenhancer (EP0709098A1) (Patel et al., 1997). Panacea Biotech Ltd. presented a report concerning the bioenhancing efficacy of piperine combined with nonsteroidal anti-inflammatory drugs as clinically significant at a dose of 5–20 mg/kg and later compared it with the available marketed products (US006017932A) (Singh et al., 2000). Risorine® is a commercially available formulation marketed by Zydus Cadila, Ahmedabad, for the treatment of tuberculosis: isoniazid (200 mg), rifampicin (200 mg), and piperine (10 mg). The formulation consists of a 60% lesser dose due to the increased bioavailability and reduced resistance (Kang et al., 2009; Shankaracharya et al., 1997). Until today, no data are available in the literature concerning the combined efficacy of ST and piperine. In the present work, a validated bioanalytical method to determine ST in rat plasma was developed and was optimized to achieve robust, reproducible, accurate, stable, and precise results.
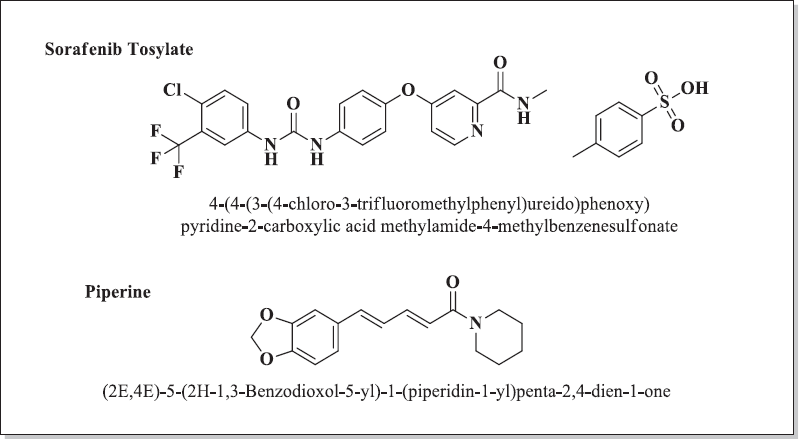 | Figure 1. Chemical structure of ST and piperine. [Click here to view] |
MATERIALS AND METHODS
Material
Piperine (95% purity) was obtained from Aldrich Chemicals, United States. All the chemicals and reagents used in the reactions were purchased from different companies, like Loba Chemie, India; Alfa Aesar, United States of America; Aldrich, United States; and Merck India Ltd., India, and were employed without any further purification. The reactions were carried out using oven-dried borosilicate glassware and anhydrous solvents. The reactions, as well as the final compounds, were checked using thin-layer chromatography (TLC). The stationary phase used was silica gel G-60 GF254. The plate was 0.22-mm thick. The plates were developed and then observed under ultraviolet light or by means of iodine vapors.
Instruments
The melting points of the synthesized compounds were determined on Veego VMP-PM digital melting point apparatus and were uncorrected. 1H NMR (Proton) and 13C NMR (carbon-13) nuclear magnetic resonance (NMR) spectra were obtained on the Bruker Avance III (400 MHz) spectrometer using TMS: Tetramethylsilane as an internal standard. All the NMR spectra were obtained by dissolving the appropriate amounts of the analyte in dimethylsulfoxide (DMSO-D6). Chemical shifts (δ) and coupling constants (J-value) were represented in Hz. Final compounds were tested for purity using high-performance liquid chromatography (HPLC).
General procedures
Preparation of piperic acid
To 40% alcoholic solution of KOH: Potassium Hydroxide, 30 ml piperine was added and refluxed for 48 hrs. The reaction was monitored by TLC. The mobile phase used was toluene:EtOAc (3:1 v/v). When the reaction was complete, the solvent was evaporated under reduced pressure. After this, water (50 mL) was added and it was filtered. Acidification of this was carried out with conc. HCl. This resulted in the formation of a yellow-colored compound of piperic acid. Filtration of this suspension gave a crude product of piperic acid which was purified with the help of methanol to afford pure piperic acid. (Aziz et al., 2015; Paula et al., 2000)
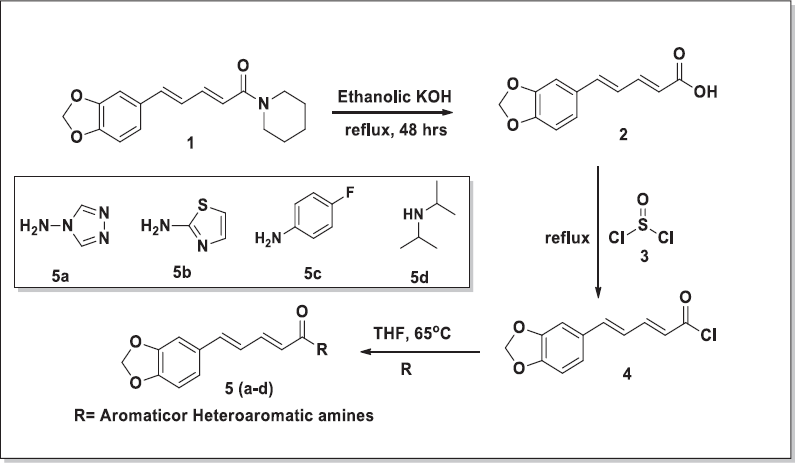 | Figure 2. Scheme for the synthesis of piperine derivatives. [Click here to view] |
General procedure for the synthesis of amides (5a–5d) from piperic acid
The pure acid (500 mg, 2.29 mmol) was taken in dry tetrahydrofuran (THF; 10 ml) (Fig. 2). The reaction mixture was further refluxed for 4–5 hrs. After 5 hrs, the excess amount of thionyl chloride (SOCl2) was decanted under reduced pressure, leaving behind a crude yellow-colored acid chloride residue. The resultant residue was further dissolved in a small amount of THF (2–4 mL), and the appropriate amine (2.3 mmol in 3 mL THF) was added, followed by 0.3 ml of triethylamine. The reaction mixture was heated, followed by stirring for 3–4 hrs. The reaction was monitored by TLC using toluene:methanol (3:1) as the mobile phase to afford the required amides (5a–5d). The crude compound was recrystallized using methanol to obtain pure yellow crystals. The FTIR spectra of synthesized derivatives are shown in Figure 8.
HPLC analysis
The analysis was carried out on a reversed-phase column (Chromatopak peerless basic C18 column of 250 × 4.6 mm, 5 µm), protected with a Phenomenex C18 guard cartridge with the dimension of 250 × 4.6 mm, 5 µm at room temperature. The column was coupled with a Jasco reversed-phase HPLC system (autosampler and LC-Net II/ADC controller, pump PU-2089) coupled with a UV (Jasco UV-2075 plus) detector, and Jasco–Borwin version 15 was used. The mobile phase ACN:Water:Formic Acid (70:29.5:0.5 v/v) was filtered using a 0.25 µm membrane filter and degassed using ultrasonication. After sonication, at the flow rate of 1 mL/min, the mobile phase was pumped to the system, and the detection wavelength was 280 nm with 30 min run time (Table 1 and Fig. 2).
The stock solution of the drug was prepared by accurately dissolving 1 mg of ST into acetonitrile (1,000 µL). The stock solution was safely stored and protected from light, and further dilutions were prepared. An aliquot (100 µL) for each diluted solution was spiked with 100 µL of blank plasma, yielding concentrations ranging from 5 to 50 µg/mL, to obtain the calibration curve. Quality control (QC) samples were also prepared by following the same procedure mentioned earlier. All solutions were stored for 1 month at a temperature of 4°C.
Method validation
The developed bioanalytical method was validated as per the guidelines provided by the United States Food and Drug Administration (USFDA) (Smolec et al., 2005).
Selectivity
The selectivity of the developed HPLC method was carried out to investigate the interference of endogenous constituents present in the sample with the drug. The selectivity was carried out using six blank plasma (rat plasma) samples with the spiked samples (Fig. 4 and 5).
Linearity, limit of detection (LOD), and lower limit of quantitation (LLOQ)
The linearity of analytes was determined by plotting the mean area under the curve (mAu) of ST versus the least square linear regression. The LLOQ and LOD were carried out based on the S/N ratio of 10:1 for LLOQ and 3:1 for LOD.
Accuracy and precision
For evaluating interday and intraday precision and accuracy, six replicates of three different concentrations of QC samples were analyzed.
Extraction recovery
The extraction recovery study was carried out by comparing the results of analytical QC samples of extracted samples and corresponding blank spiked samples with post extracted analytes. Six replicates of QC samples were estimated with the recovery of ST at three different concentration ranges. The recovery should not be more than 100% for the analytes.
Stability
The stability of the solute is one of the critical parameters for the development of the bioanalytical method. There are various solutes available that readily degrade in the plasma before analysis, and multiple factors play an important role in stability studies of the analyte (e.g., sample preparation, method of extraction, storage, and cleanup). The stability studies for the analyte were estimated as:
Short-term stability: Storage of the analyte for 24 hrs at room temperature. Also, the analyte samples were stored at −20°C for 24 hrs in the refrigerator.
Long-term stability: Storage of the analyte for 30 days at −80°C.
Freeze–thaw stability: Prepared plasma samples were analyzed for freeze–thaw stability for three consecutive cycles from −80°C to room temperature.
In-vivo pharmacokinetics of ST
Animals
Male Wistar rats (weight 180 ± 30 gm; n = 9) were procured from Agharkar Research Institute, Pune. The protocol to carry out the pharmacokinetic study was approved by the Institutional Animal Ethics Committee of Bharati Vidyapeeth (Deemed to be University), Poona College of Pharmacy, Pune (CPCSEA/PCH 01/2018-2019). The quarantine of animals was carried out in a controlled environment (22°C–25°C, 55%–60% relative humidity, and 12 hrs dark/light cycles) for 1 week. Food pallets were provided to animals supplied by Navmaharashta Chakan Oil Mill Ltd, Sangali, Maharashtra, India, and tap water was given ad libitum during the experimentation.
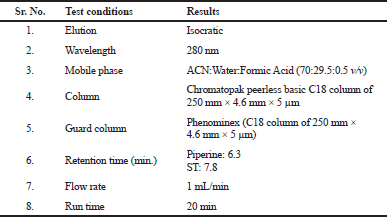 | Table 1. Instrumentation and chromatographic conditions. [Click here to view] |
Single oral administration
Before carrying out the study, the animals were fasted overnight and the animals were separated into seven groups (n = 9; Table 2). They were administered with a single dose of ST (5 mg/kg; orally) and in combination with piperine and its synthetic derivatives at the dose of 5 mg/kg orally. The rat blood samples (0.5 mL per animal) were collected by retro-orbital venous plexus method at different time points, i.e., 0, 15, 30 minutes, 1, 2, 4, 6, 8, 12, 24, 48, and 72 hrs. Food was provided to the animals after 4–5 hrs. Later, the collected blood samples were stored in labeled tubes containing Ca-EDTA as the anticoagulant and were shaken to prevent blood coagulation. The samples were centrifuged at 10,000 rpm for 2–5 min at 4°C. The plasma sample of 200 µL was taken in a 2-mL Eppendorf tube, and the extracting solvent (100% acetonitrile, 200 µL) was added and vortexed for 5 min and were centrifuged at 15,000 rpm for 15 min at 4°C. After centrifugation, the supernatant was separated in different tubes and was reconstituted using 200 µL of diluent and vortexed for 2 min, and was filtered using 0.22 µm syringe filters. From this, 20 µL of solution was injected onto the HPLC column (Fig. 4) (Di et al., 2015; Singh et al., 2018).
Analysis of data
For estimating various pharmacokinetic parameters a non-compartmental analysis (NCA) model was used, and all the pharmacokinetic parameters were evaluated using PKSolver 2.0 USA software. The area under the plasma-drug concentration versus time curve (AUC0-t) was determined by trapezoidal rule. Cmax and Tmax were found from the above plotted curve. Rate of absorption (Ka) and half-life (t1/2) were calculated, followed by the residual method and 0.693/ka. The rate of elimination (Kel) and terminal half-life (t1/2) were calculated using equation −k/2.303 and 0.693/Kel respectively. the apparent volume of distribution (Vd), and mean residence time (MRT). The following formula was used to calculate the relative bioavailability (F):
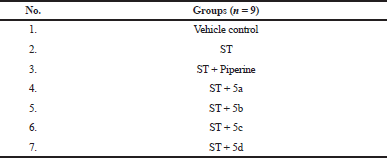 | Table 2. Grouping of animals. [Click here to view] |
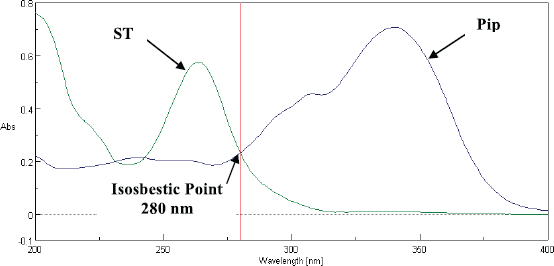 | Figure 3. Selection of Wavelength using UV Spectrometer. [Click here to view] |
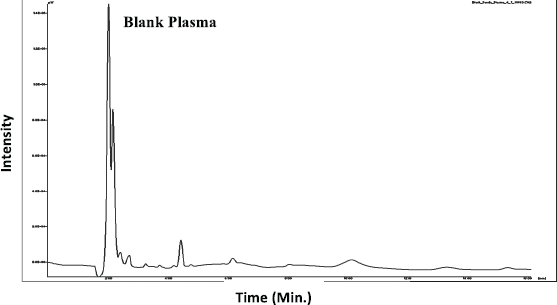 | Figure 4. Chromatogram of Blank Plasma. [Click here to view] |
RESULTS
Characterization of the synthesized compounds
(2E,4E)-5-(benzo[d][1,3]dioxol-5-yl)-N-(1H-1,2,4-triazol-1-yl) penta-2,4-dienamide (5a)
Yield: 85.7%; melting point: 230–231 °C; FTIR (vmax, cm−1): 3,443.28 (-NH), 3,018.09 (aromatic-CH), 2,911.02 (O-CH2-O), 1,694.16 (-C=O), 1,602.56 (methylene dioxyl group), 1,602.66 (diene), 1,494.56 (C=C). 1H NMR (400 MHz, DMSO-D6) δ: 5.93 (d, J = 15.7 Hz, 1H), 6.15 (d, J = 10.8 Hz, 2H), 6.87–7.03 2H, 6.90 (dd, J = 8.4, 0.4 Hz), 6.95 (dd, J = 17.7, 10.2 Hz), 7.14 (d, J = 17.7 Hz, 1H), 7.25 (dd, J = 1.9, 0.4 Hz, 1H), 7.39 (dd, J = 15.7, 10.2 Hz, 1H), 7.58 (dd, J = 8.4, 1.9 Hz, 1H), 8.15 (s, J = 1.7 Hz, 2H,). 13C NMR (DMSO) δ: 165.51, 157.75, 149.05, 148.48, 144.48, 142.25, 141.92, 130.93, 125.46, 124.41, 123.11, 109.09, 106.34, 101.87. Mass spectrum ESI (-ve) averaged mode: m/z 283.9 (M+ C14H12N4O3).
(2E,4E)-5-(benzo[d][1,3]dioxol-5-yl)-N-(thiazol-2-yl)penta-2,4-dienamide (5b)
Pale yellow powder, yield: 92.7%; Rf value: 0.51 [toluene: methanol (3:1)]; melting point: 178–180 °C; FTIR KBr (vmax cm−1): 3,160 (-NH stretch), 2,882.09 (-CH2), 1,673.91 (C=O), 1,609.31 (methylene dioxyl group), 1,609.90 (diene), 1,490.70 (C=C). 1H NMR (400 MHz, DMSO-D6) δ: 12.24 (s, 1H), 7.53–7.34 (m, 2H), 7.29 (s, 2H), 7.16 (d, J = 19.3 Hz, 1H), 6.87 (dd, J = 56.6, 31.0 Hz, 5H), 6.35 (d, J = 14.5 Hz, 1H), 6.02 (s, 2H), 5.94 (d, J = 12.7 Hz, 1H). 13CNMR (101 MHz DMSO) δ: 163.85, 158.62, 148.58, 148.41, 143.59, 140.84, 138.26, 130.99, 125.26, 123.74, 121.83, 114.06, 108.91, 106.28, 101.78. Mass spectrum ESI (-ve) averaged mode: m/z 301.06 (M+ C15H12N2O3S).
(2E,4E)-5-(benzo[d][1,3]dioxol-5-yl)-N-(4-fluorophenyl) penta-2,4-dienamide (5c)
Colorless crystals, yield 82 %; Rf: 0.651 [mobile phase: n-hexane: acetone (2:3 v/v)]; melting point 157–158 °C; FTIR (KBr) (cm−1): 3,224.52 (-NH), 1,699.94 (-C=O), methylene dioxyl group (1,617.02), C=C (1,488); 1H NMR (DMSO-D6) δ: 9.901 (s, NH exchangeable), 8.036 (s, 1H), 7.327 (d, J = 14.4Hz, 1H), 7.263 (d, J = 9.2Hz, 1H), 7.17 (d, J = 14.8Hz, 1H), 7.003–6.91 (m, 4H), 6.503 (dd, J = 16Hz, 1H), 6.062 (s, ,1H), 5.946 (dd, J = 16Hz, 1H). 13C NMR (DMSO) δ: 79.11, 79.44, 79.77, 101.83, 106.22, 108.94, 108.98, 115.79, 115.98, 121.58, 123.50, 123.58, 124.18, 124.79, 125.31, 125.44, 126.82, 126.93, 131.17, 139.72, 140.27, 142.03, 145.10, 148.45, 148.58, 164.69, 168. Mass spectrum: m/z 312.10 (M+ C18H14FNO3).
(2E,4E)-5-(benzo[d][1,3]dioxol-5-yl)-N,N-diisopropylpenta-2, 4-dienamide (5d)
Yield 79%; Rf : 0.681 [mobile phase: n-hexane:ethyl acetate (7:3) v/v]; melting point: 196–198 °C; FTIR (anhydrous KBr vmax cm−1): 3,036 aromatic C-H; 2,547 O-CH2-O; 1,675 C=C (diene); 1,601–1,447 C=C (benzene ring). 1,047 (C=N). 1H NMR (DMSO-D6) δ: 1.21 (d, J = 6.8 Hz, 12H), 4.16 (sept, J = 6.8 Hz, 2H), 5.96 (d, J = 15.8 Hz), 6.14 (2H, d, J = 10.8 Hz), 6.86–7.01 (2H, 6.90 (dd, J = 8.4, 0.4 Hz), 6.94 (dd, J = 17.7, 10.2 Hz, 1H,), 7.12 (d, J = 17.7 Hz, 1H), 7.24 (dd, J = 1.9, 0.4 Hz, 1H), 7.35 (dd, J = 15.8, 10.2 Hz, 1H), 7.58 (dd, J = 8.4, 1.9 Hz, 1H). 13C NMR (DMSO) δ: 168.08, 148.57, 148.45, 145.07, 140.25, 125.32, 123.55, 121.60, 114.27, 108.99, 106.18, 101.90, 101.83, 48.76, 46.56, 19.46, 18.98, 11.50, 10.57. m/z 300.99 (C18H23NO3, 301.17).
Validation of the developed HPLC method
The developed bioanalytical method was validated by following the guidelines provided by the USFDA.
Selectivity
The selectivity of the method was carried out to verify the interference of analytes (piperine and ST) during the method development. The selectivity was demonstrated by analyzing the chromatograms obtained by six blank plasma samples with the corresponding spiked blank plasma. There was no interference obtained at the retention time of 6.3 min for piperine and 7.83 min for ST (Fig. 5).
Linearity
The linear range for ST was from 5 to 50 µg/mL in the rat plasma. Calibration curve data were used to find out the correlation coefficient (r2), slope, and intercept of the regression equation. For ST, the regression equation was found to be y = 5,107.7(x)–478.76 (r2 = 0.999). The values for LOD and lower limit of quantitation (LLOQ) were 1.63 and 4.96 µg/ml, respectively (Table 3 and Fig. 6).
Accuracy and precision
The interday and intraday precision studies were carried out using rat plasma at concentrations of 5, 25, and 45 µg/ml. At all the selected levels, the percentage of relative standard deviation (%RSD) was found to be below the range. This showed that the method was reproducible and precise for ST in the biological matrix (Table 4).
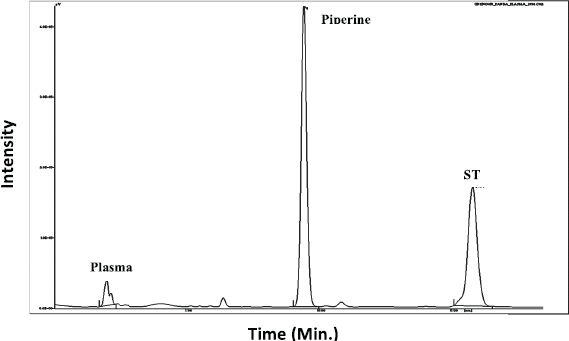 | Figure 5. Chromatograms of ST and piperine in rat plasma. [Click here to view] |
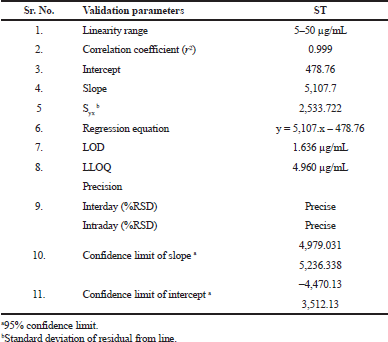 | Table 3. Linearity data of ST. [Click here to view] |
Stability
The decomposition of solutes has been observed in the plasma prior to chromatographic analysis, such as sample preparation, extraction procedure, clean-up, storage conditions of the sample vials, etc. The stability profile of the prepared samples/analyte was evaluated under short-term and intermediate conditions (Table 5 and 6). Short-term stability was carried out by storing the samples at −20°C for 24 hrs; long-term stability studies were carried out by keeping the sample at −80 °C. The RSD value for change in the concentration related to the nominal concentration was found to be less than 20%.
Extraction recovery
The recovery study of ST was carried out using low, medium, and high concentration ranges. The recovery of ST was found to be 93%–97%, with %RSD of 6%–8%. Studying the recovery revealed that the pre-treatment of samples used in the study was found reproducible for ST. The results of recovery studies of ST are given in Table 8.
Robustness
Some deliberate changes were made in the flow rate (1 ± 0.2 mL) and wavelength (280 ± 2 nm) in order to study the robustness of the developed method. Three quality control sample (5, 25, and 45 µg/mL) responses were recorded by altering individual parameters at a time. The method was considered robust if %RSD fell under the range of ±15% deviation (Table 7).
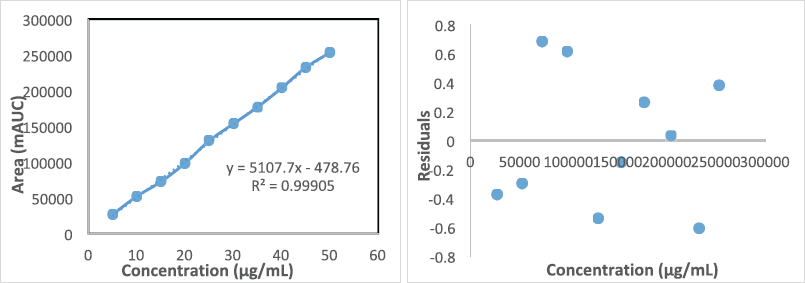 | Figure 6. Linearity data and concentration versus residual plot for ST for rat plasma. [Click here to view] |
 | Table 4. Intraday and interday precision and accuracy of ST. [Click here to view] |
 | Table 5. Short-term stability of ST. [Click here to view] |
In vivo pharmacokinetic study of ST
Here, we report successful development of a validated bioanalytical HPLC method of analysis. It was applied to study the effects on various pharmacokinetic parameters of ST alone, along with piperine, and some of its synthetic derivatives. The pharmacokinetic results are shown in Table 9. In-vivo oral pharmacokinetics was conducted using male Wistar rats for a period of 72 hrs. The plasma drug concentration-time profiles are shown in Figure 7. Our study revealed that there is a dramatic change in the pharmacokinetics of ST when combined with piperine. Nevertheless, one of the analogs of piperine (5a) shows a 2.58-fold increase in the bioavailability, while with piperine it shows a 1.66 fold increase in the bioavailability compared to ST alone. Here, the piperine analog (5a) alters the pharmacokinetics of ST by increasing the maximum concentration (Cmax) and systemic exposure (AUC), as well as by reducing the rate of elimination (Kel). The results of the study show that the presence of 5a increased the AUC from 210.32 ± 7.8 to 515.91 ± 22.77, along with the enhancement of Cmax from 14.0 µg/mL for ST to 25.46 µg/mL, and reduction in the Kel from 0.05 ± 0.01 to 0.04± 0.02 fraction/hour. In terms of the above-mentioned results, AUC and Cmax were notably elevated in the presence of 5a combined with ST (Table 9). At the same time, Kel was decreased, which suggests that 5a has a significant impact on the pharmacokinetics of ST.
 | Table 6. Long-term stability of ST. [Click here to view] |
 | Table 7. Robustness of ST. [Click here to view] |
 | Table 8. Extraction recovery of ST. [Click here to view] |
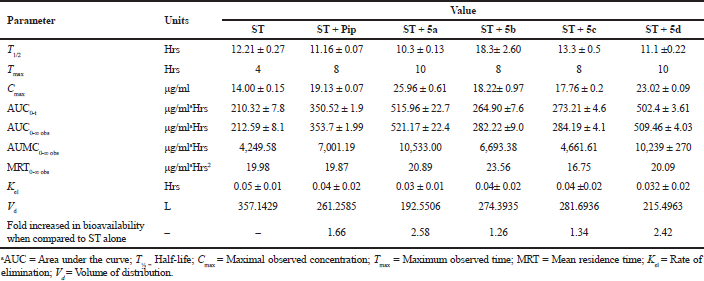 | Table 9. Pharmacokinetic profile of sorafenib in the presence of piperine and its synthetic derivatives. [Click here to view] |
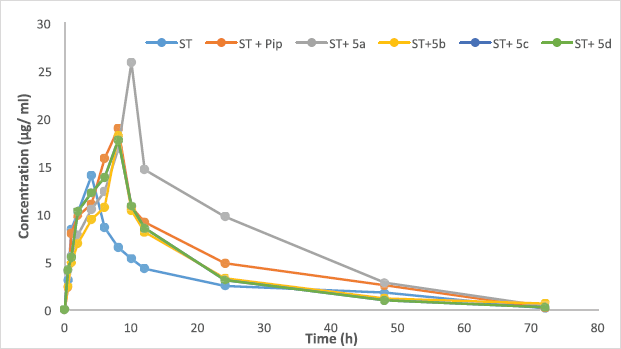 | Figure 7. Mean plasma concentration time profiles of ST alone or in combination with piperine and its synthetic derivatives through the oral route (dose of 5 mg/kg body weight). [Click here to view] |
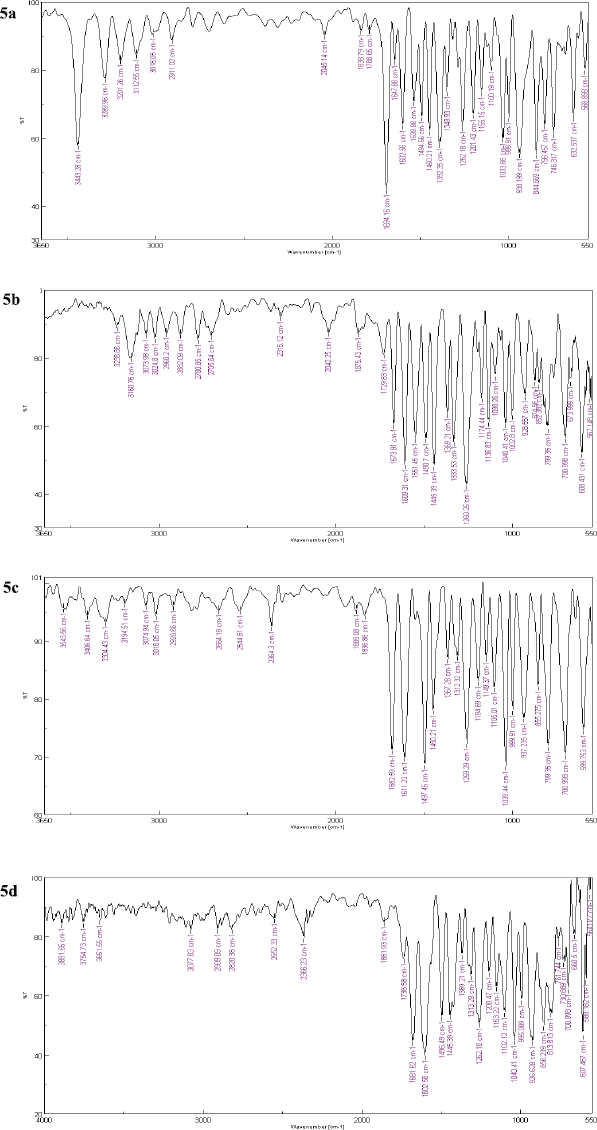 | Figure 8. FTIR spectra of synthesized piperine analogs (5a–5d). [Click here to view] |
Statistical analysis
The plasma concentrations are represented as mean ± SD. Different parameters to study pharmacokinetics were evaluated via NCA in PKsolver software 2.0 USA. All the parameters were compared using Student’s t-test. Statistically significant results were obtained from the data in this study (p > 0.05).
DISCUSSION
The pilot study provided shreds of evidence for the enhancement of the bioavailability of ST through the simultaneous administration of piperine (known as a versatile bioenhancer) and some of its synthetic analogs in systemic circulation, when orally administered to male Wistar rats devoid of side effects. However, the validated method was subsequently used for the assessment of the effect of piperine and piperine derivatives (5a–5d), suggesting the complete but slow absorption of ST from the gastrointestinal tract (GIT) with variations in Cmax. The values of AUC0-t, AUC0-∞ Cmax, and Tmax suggest the delayed absorption of the drug in the GIT compared to ST alone. The term ‘bioavailability enhancer’ was first invented by Atal et al. (1985), an Indian scientist at the Regional Research Laboratory (Jammu) in the year 1985 (Kesarwani and Gupta, 2013). Piperine, a principal ingredient obtained from the Piper species (Piper longum and Piper nigrum; Family: Piperaceae), is known to enhance the bioavailability of various xenobiotic agents of different categories of various human diseases (Derosa et al., 2016). Significant differences in the pharmacokinetic parameters of ST observed in the presence of piperine and its analogs led to the significant alterations in the dose of ST by delaying/slowing down the absorption from the GIT. Many nutrient/drug interactions could be explained, and they act by inhibiting the p-glycoprotein or CYP3A4; increase in the plasma drug concentration-time profile of a xenobiotic agent through the combination of these substances which exhibits the dual mechanism over absorption and metabolism (Lin, 2003). The possible mechanism of piperine acting as a bioenhancer may be due to the increase in absorption and inhibiting the rate of elimination of the drug from the body. The current research suggests that the significant increase in Cmax may lead to a reduction in the dose of ST in patients with HCC.
In the present research work, derivatization of piperine was achieved by following the previously prescribed methods with some modifications for the synthesis (Mu et al., 2012). The synthesized derivatives were confirmed using various spectroscopic methods such as FTIR, 1H NMR and 13C NMR, and mass spectroscopy. NMR spectroscopy signifies that the desired product was successively achieved. The difference between piperine and its derivatives is mainly the piperidine ring; for example, in the compounds 5a–5d the piperidine ring was replaced with heteroaromatic ring (i.e., triazole and thiazole), aromatic ring (i.e., 4-fluorophenyl), and aliphatic chain (i.e., diisopropyl amine). Another major difference was piperine derivatives present in secondary amide. In 1H NMR data, this difference can be precisely identified. In piperine, the signals for piperidine ring protons were observed at δ value of 3.37 (d, J = 11.1 Hz) and 1.58–1.80 (m, 2H) ppm. In 5a the peak of amide proton was observed at 8.9 ppm and the peak of the triazole ring at 8.15 ppm; in 5b the peak of amide proton was observed at 12.24 ppm and peak of 7.29 ppm; in 5c, amide proton was observed at 9.901 ppm and aromatic proton was observed in the range of 7.0–7.32 ppm; lastly, in 5d the peak of aliphatic proton of diisopropylamine was observed at 4.16 ppm and 1.21 ppm, respectively. The characterization data obtained from the NMR spectroscopy confirmed the final product.
CONCLUSION
Although our results are limited to the preclinical study, it provides an initial insight to shift the focus from developing novel molecules that presents various adverse effects to the healthy tissues to the combination therapy of nutrients/less toxic molecules to provide better targeted effects and lesser toxic effects. In conclusion, the current results indicate an insight that the co-administration of piperine and its synthetic analogs exhibits significant changes in the pharmacokinetics of ST, which may be by inhibiting the p-glycoproteins or by inhibiting the CYP3A4 metabolic enzyme present in enterocytes. This could be of great interest due to the co-administration of piperine and its analogs which can be a better alternative that enhances the bioavailability of the drug, including the reduction in the burden of the medication or simply by reducing the dose of the medications given to the patients for a longer time.
ABBREVIATIONS
LOQ: Limit of quantitation; HOQ: High QC level; MQC: Middle QC level; ST: Sorafenib tosylate; GIT: Gastrointestinal tract; HCC: Hepatocellular carcinoma; NCA: non-compartmental analysis; RSD: Relative standard deviation; TLC: Thin-layer chromatography, AUC: Area under the curve BCS: Biopharmaceutical Classification, TMS: Tetramethylsilane, KOH: Potassium Hydroxide, THF: Tetrahydrofuran, FTIR: Fourier-Transform Infrared Spectroscopy, EDTA: Ethylenediaminetetra Acetic Acid, ESI: Electrospray ionization, GIT: Gastrointestinal Tract, LQC: Lower QC level.
AUTHORS’ CONTRIBUTIONS
AT contributed to carrying out the analysis, representing the results, and prepared the manuscript. KRM provided the technical assistance in preparing the manuscript. SYG provided the correspondence to the manuscript and helped revising the manuscript.
CONFLICT OF INTEREST
The authors declare that there is no conflict of interest concerning this manuscript.
FUNDING
There was no funding source pertaining to this research work.
REFERENCES
Atal CK, Dubey RK, Singh J. Biochemical basis of enhanced drug bioavailability by piperine: evidence that piperine is a potent inhibitor of drug metabolism. J Pharmacol Exp Ther, 1985; 232(1): 258–62.
Atal N, Bedi KL. Bioenhancers: revolutionary concept to market. J Ayurveda Integr Med, 2010; 1(2):96. CrossRef
Auti P, Gabhe S, Mahadik K. Bioanalytical method development and its application to pharmacokinetics studies on Simvastatin in the presence of piperine and two of its synthetic derivatives. Drug development and industrial pharmacy. 2019 Apr 3;45(4):664–8. CrossRef
Aziz DM, Hama JR, Alam SM. Synthesising a novel derivatives of piperine from black pepper (Piper nigrum L.). J Food Meas Charact, 2015; 9(3):324–31. CrossRef
Derosa G, Maffioli P, Sahebkar A. Piperine and its role in chronic diseases. In Gupta SC, Prasad S,Aggarwal BB (eds.) Anti-inflammatory nutraceuticals and chronic diseases, Springer, Cham, Switzerland, pp 173–84, 2016. CrossRef
Di X, Wang X, Liu Y. Effect of piperine on the bioavailability and pharmacokinetics of emodin in rats. J Pharm Biomed Anal, 2015; 115:144–9. CrossRef
Hsu C, Shen YC, Cheng AL. Sorafenib for the treatment of hepatocellular carcinoma across geographic regions. Expert Rev Clin Pharmacol, 2009; 2:129–36. CrossRef
Kane RC, Farrell AT, Saber H, Tang S, Williams G, Jee JM, Liang C, Booth B, Chidambaram N, Morse D, Sridhara R. Sorafenib for the treatment of advanced renal cell carcinoma. Clin Cancer Res, 2006; 12:7271–8. CrossRef
Kang MJ, Cho JY, Shim BH, Kim DK, Lee J. Bioavailability enhancing activities of natural compounds from medicinal plants. J Med Plants Res, 2009; 3:1204–11.
Karaman B, Battal B, Sari S, Verim S. Hepatocellular carcinoma review: current treatment, and evidence-based medicine. World J Gastroenterol, 2014; 20:18059. CrossRef
Kesarwani K, Gupta R. Bioavailability enhancers of herbal origin: an overview. Asian Pac J Trop Biomed, 2013; 3(4):253–66. CrossRef
Lin JH. Drug–drug interaction mediated by inhibition and induction of P-glycoprotein. Adv Drug Deliv Rev, 2003; 55(1):53–81. CrossRef
Modi SJ, Kulkarni VM. Vascular endothelial growth factor receptor (VEGFR-2)/KDR inhibitors: medicinal chemistry perspective. Med Drug Discov, 2019; 2:100009. CrossRef
Mu LH, Wang B, Ren HY, Liu P, Guo DH, Wang FM, Bai L, Guo YS. Synthesis and inhibitory effect of piperine derivates on monoamine oxidase. Bioorg Med Chem Lett, 2012; 22(9):3343–8. CrossRef
Patel RB, Modi IA, inventors; Cadila Laboratories Ltd, assignee. Compositions containing piperine. United States patent US 5,616,593. 1997 Apr 1.
Paula VF de, Barbosa LC de A, Demuner AJ, Piló-Veloso D, Picanço MC. Synthesis and insecticidal activity of new amide derivatives of piperine. Pest Manag Sci, 2000; 56:168–74. CrossRef
Services USD of H and H. Food and Drug Administration. Guidance for industry. The United State of America (USA), Bioanal Method Valid, 2001.
Shankaracharya NB, Jaganmohan Rao L, Pura Naik J, Nagalakshmi S. Characterisation of chemical constituents of Indian long pepper (Piper longum L.). J Food Sci Technol, 1997; 34:73–5.
Singh A, Jain R. Pharmaceutical compositions containing at least one NSAID having increased bioavailability. 2000.
Singh A, Verma S, Al Jarari NM, Singh AP, Fuloria NK, Fuloria S. Effect of piperine on pharmacokinetics of rifampicin and isoniazid: development and validation of high performance liquid chromatography method. J Appl Pharm Sci, 2018; 8(03):072–81.
Smolec J, DeSilva B, Smith W, Weiner R, Kelly M, Lee B, Khan M, Tacey R, Hill H, Celniker A, Shah V. Bioanalytical method validation for macromolecules in support of pharmacokinetic studies. Pharm Res. 2005;22(9):1425–31. CrossRef
Thiel A, Buskens C, Woehrle T, Etheve S, Schoenmakers A, Fehr M, Beilstein P. Black pepper constituent piperine: genotoxicity studies in vitro and in vivo. Food Chem Toxicol, 2014; 66:350–7. CrossRef