
INTRODUCTION
Chloramphenicol (CL), chemically D-(-)-threo-1-p-nitrol-phenyl-2-dichloroacetamido 1,3-propanediol, is an antibiotic having a broad-spectrum antibacterial activity to treat either Gram-negative or Gram-positive bacterial infections and is widely used for the treatment of bacterial conjunctivitis. CL is one of the first synthetic antibiotics available in clinical practice (Al-Rimawi and Kharoaf, 2011). Besides, the corticosteroid of hydrocortisone acetate (HCA), chemically 11,17-Dihydroxy-3, 20-dioxopregn-4-en-21-yl acetate, is used to reduce the inflammation due to dermatitis. The symptom onset of inflammation induced by radiation, chemicals, infection, and allergen could be suppressed and prevented by HCA (Kristiningrum and Rakhmawati, 2012). The chemical structures of both drugs are shown in Figure 1. The combination of CL and HCA in some pharmaceutical products, especially the cream, is typically used for the treatment of dermatitis and skin infections. To perform quality control of both drugs in pharmaceutical products, an analytical method capable of analyzing CL and HCA must be developed.
Several analytical methods have been developed, validated, and applied for the analysis of CL and HCA in some pharmaceutical preparations either individually or in combination with other drugs, including ultraviolet spectrophotometry (Al-Sabha and Rasheed, 2010), thin-layer chromatography combined with densitometric measurement for the quantitative analysis of HCA using absorbance mode at 250 nm (Pyka et al., 2011), analysis of HCA and its related compounds (DoÅ‚owy et al., 2014) as well as simultaneous analysis of CL and HCA (Kristiningrum and Rakhmawati, 2012), high-performance liquid chromatography (HPLC) for quantitative analysis of HCA in antibiotics preparation (Bracey et al., 1966), analysis of CL and other drugs with a UV detector at 254 nm (Iqbal et al., 2006), and analysis of CL and HCA with UV detection at 259 nm (Katakam, 2014). Among these methods, HPLC is the most reported one due to its capability to provide the best separation of analytes and to get versatility in selecting the HPLC condition. However, the optimization of HPLC used was a traditional approach. In this study, the experimental Box–Behnken design (BBD) was used.
Currently, the application of chemometrics, especially the experimental designs in chromatographic-related techniques, is important to reduce the experiment numbers. BBD is one of the useful experimental designs for the optimization of chromatographic separation and analysis (Ferreira et al., 2007). BBD has been used for the separation of levofloxacin and ciprofloxacin using six factors, namely, the percentage of mobile phase composition, the concentration of buffer, the pH of the mobile phase, and the percentage of ion-pairing (Czyrski and Sznura, 2019). Our group also used BBD to optimize HPLC conditions for the separation of curcuminoid (curcumin, dimethoxy curcumin, and bis-desmethoxycurcumin), using variables of column temperature, a solvent ratio of acetonitrile-acetic acid, flow rate, and a percentage of acetic acid (Prabaningdyah et al., 2017), as well as the separation of Acid Orange-7 and Sudan II in cosmetic products (Purba et al., 2019). However, using the literature review, the application of BBD on HPLC optimization of CL and HCA is not yet reported. In this study, we worked on the optimization of HPLC separation of CL and HCA using three variables, namely, mobile phase composition, flow rate, and column temperature.
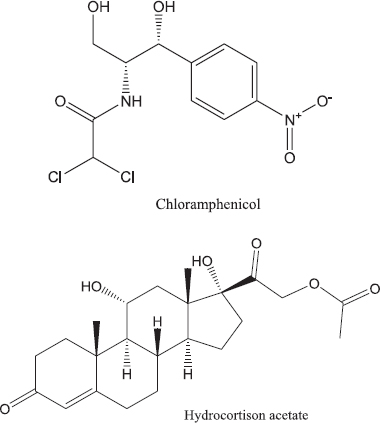 | Figure 1. The chemical structures of CL and HCA. [Click here to view] |
MATERIALS AND METHODS
The reference standards of CL and HCA were obtained from Badan Pengawas Obat dan Makanan (The National Agency of Drug and Food Control), the Republic of Indonesia. Methanol and acetonitrile (ACN) for HPLC grade (Lichrosolv) were obtained from E. Merck (Darmstadt, Germany). Aqua pro injection was purchased from Ikapharmindo (Indonesia). The other solvents and reagents were of preanalytical grade and bought from E. Merck (Darmstadt, Germany). The commercial samples (Kemiderm® from PT. Berlico, Yogyakarta, Indonesia) were obtained from several pharmacies around Yogyakarta, Indonesia.
Experimental design
Approximately 4 mg of CL and 5 mg HCA were accurately weighed using a microanalytical balance with a sensitivity of 0.001 mg (Metler Toledo MX5) and each amount was added with methanol in a 10 ml volumetric flask. A 0.5 ml of each solution was pipetted and diluted with ACN-water (1:1) in a 20 ml volumetric flask. Each solution was subjected to scanning using an ultraviolet spectrophotometer at a wavelength range of 200−400 nm. The isobathic point of two UV spectra was used as a wavelength for the detection. BBD experimental design was performed using Design Expert 10.1. The variables used for BBD optimization were composed of ACN at a concentration range of 45%−55%, a flow rate of 0.7−1.3 ml/minutes, and a column temperature of 30°C−40°C. The HPLC responses were retention time, peak area, resolution (Rs), tailing factor, and theoretical plate. The design of BBD for HPLC separation using three variables was compiled in Table 1.
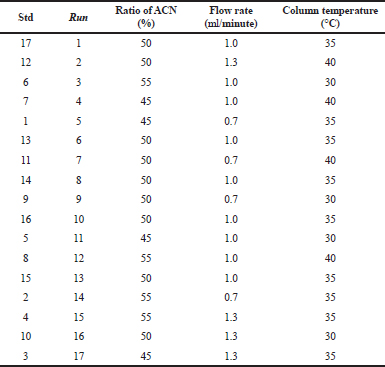 | Table 1. BBD experimental design in HPLC optimization for the separation and analysis of CL and HCA. [Click here to view] |
HPLC analysis
Analysis of CL and HCA was performed by Shimadzu LC-20AD autosampler (SIL-20A) using a UV detector (SPD-20) and a photo-diode array detector (SPD-20MA) equipped with Labsolutions software. The separation was carried out on a Waters X-Bridge C-18 column (250 × 4.6 mm ID, 5 μm) using a mobile phase composed of ACN-water. The mobile phase was delivered isocratically at a flow rate of 1.0 ml/minutes. The use of ACN-water as a mobile phase is due to its viscosity which is lower than methanol:water so that the pressure of the pump is low. Besides, ACN exhibited higher eluent strength than methanol in the C-18 column.
System suitability test and validation of HPLC method
The system suitability test (SST) of HPLC was carried out according to Siregar et al. (2017) by injecting six replicate standard solutions using conditions obtained during optimization with BBD. The parameters of SST evaluated were the precision expressed by relative standard deviation (RSD) of retention time, peak area, tailing factor, efficiency, and height equivalent to the theoretical plate (HETP). RSD values should be <2%. Validation of the HPLC method was done according to the guidelines of the International Conference on Harmonization (ICH) by evaluating several performance characteristics which included selectivity, linearity, sensitivity, precision, accuracy, and robustness. The acceptance criteria of validation protocols were based on several standards such as ICH and Association of Official Analytical Chemists.
Analysis of CL and HCA in pharmaceutical preparation
Cream samples containing CL and HCA equivalent to 4 mg CL and 5 mg HCA were accurately weighed using an analytical balance, added to 5 ml methanol, sonicated 10 minutes, and then transferred to a 10-ml volumetric flask. A 4.0 ml solution was taken and diluted with ACN-water (1:1) and transferred to a 20.0 ml calibrated volumetric flask. The solution was filtered using microfilter Polytetrafluoroethylene (PTFE) 0.45 μm and then injected into HPLC systems using a Waters X-Bridge C-18 column (250 × 4.6 mm ID, 5 μm) with a mobile phase of ACN-water (47%:53%) delivered isocratically at a flow rate of 0.9 ml/minutes.
RESULTS AND DISCUSSION
In this study, the experimental design of BBD was used to seek the optimum condition of HPLC intended for the analysis of CL and HCA in cream samples. The optimization process was performed using three independent variables, namely, ACN composition (%) (X1), flow rate (X2), and column temperature (X3). The responses investigated were retention time of CL (Y1), retention time of HCA (Y2), peak area CL (Y3), peak area of HCA (Y4), Rs of matrix sample-1 (M1)-CL (Y5), Rs of matrix sample-2 (M2)-CL (Y6), Rs of M2-HCA (Y7), tailing factor CL (Y8), tailing factor HCA (Y9), theoretical plate CL (10), and theoretical plate HCA (11). Based on the running order as in Table 1, the responses obtained were compiled in Table 2.
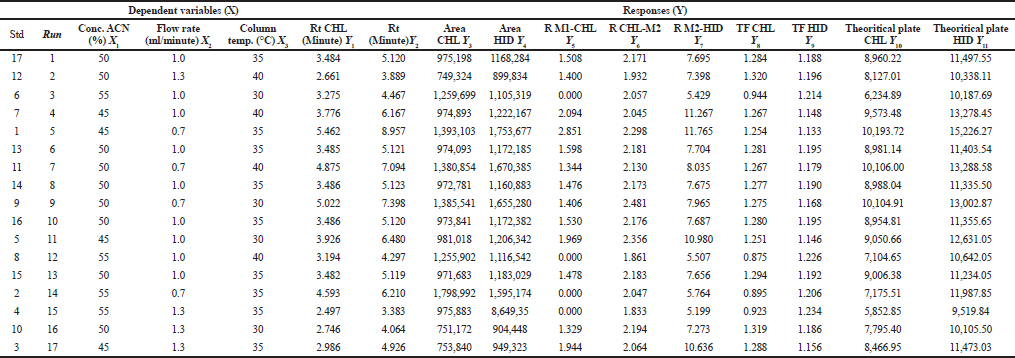 | Table 2. The running and responses obtained during BBD approach of HPLC method for the analysis of CL and HCA. [Click here to view] |
All responses were analyzed statistically using the analysis of Variance and resulted in a polynomial equation having significant effects of all variables toward responses. For selecting the optimum condition, some criteria were used, namely the minimum use of an organic solvent (ACN), the retention time for the first analyte should be minimum 2.5 minutes and maximum 10 minutes, the tailing factor should not exceed 1.5, the number of theoretical plates should take the highest values, the Rs should be minimum 2.0, and the peak area should be the highest (Vanbel and Schoenmakers, 2009) (Wu et al., 2018). The optimum conditions suggested by BBD were the composition of ACN of 47%, a flow rate of 0.9 ml/minutes, and a column temperature of 38°C. The HPLC chromatogram obtained using the suggested condition was shown in Figure 2. CL and HCA, matrix component-1 (M1), and matrix component-2 (M2) were well separated from others. The Rs values for CL-M1, CL-M2, and HCA-M2 were 2.080, 2.140, and 9.762, respectively. The tailing factors obtained were in the range of 1.158−1.283, and the number of theoretical plates (HETP) was of > 9,000. Based on the independent t-test, the HPLC separation parameters during optimization resulted by BBD agreed with those obtained in actual HPLC running.
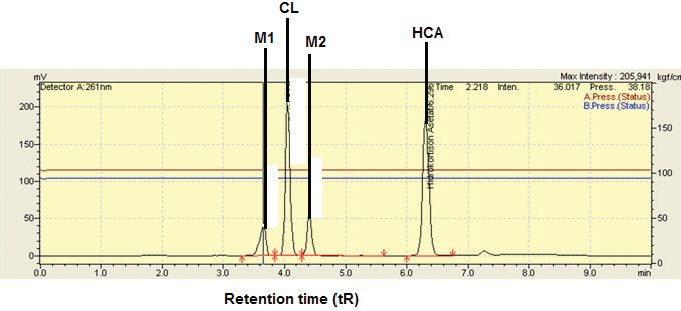 | Figure 2. Separation of CL, matrix component-1 (M1), matrix component-2 (M2), and HCA using HPLC condition as suggested by BBD. Separation was carried out on a Waters X-Bridge C-18 column (250 x 4.6 mm ID, 5 μm) using a mobile phase composed of ACN-water (47%: 53%). The mobile phase was delivered isocratically at a flow rate of 0.9 ml/minutes. Detector: UV at 261 nm. [Click here to view] |
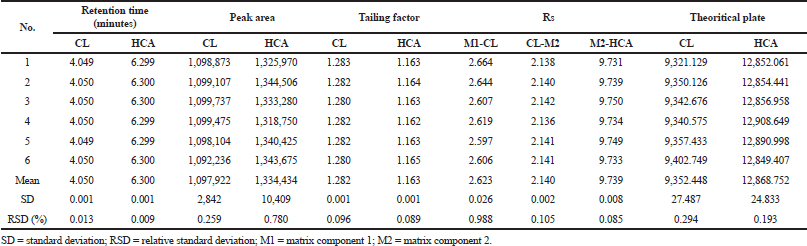 | Table 3. The SST of optimum HPLC condition for the separation of CL and HCA. [Click here to view] |
The optimum HPLC condition was then validated by determining several performance characteristics as suggested in the ICH. During SST, RSD values of retention times, the number of theoretical plates, and peak area were of <2.00%; as shown in Table 3, indicating that the HPLC condition is suitable for further analysis (Ravisankar et al., 2015). HPLC was selective for the separation of CL and HCA as indicated by Rs values of >2.00. Over a concentration range of 20−140 μg/ml, CL was linear with a correlation coefficient of r ≥ 0.997 with an equation for the relationship between concentration (x-axis) and peak area (y-axis) of y = 14,495.5 x – 3,501.9. In addition, HCA over-concentration of 25−175 μg/ml was linear with an equation of y = 12,822.1 x + 7,538.7 with a correlation coefficient of r ≥ 0.999 (Araujo, 2009). The RSD values of CL and HCA obtained during precision analysis were <2.00%, lower than the required value in Horwitz function (Table 4). The recovery values obtained through standard addition method for CL and HCA were acceptable, namely, in the range of 99.33%−100.93% and 99.29%−100.82%, respectively (Table 5). The robustness of HPLC method was evaluated by adjustment of HPLC conditions (± 50% from optimum flow rate, ± 30% of mobile phase composition, and ± 10°C of column temperature). Based on the Student t-test between adjusted condition and optimum HPLC condition, there is no significant difference at p > 0.05; therefore, HPLC method was robust enough (Budiarti et al., 2015).
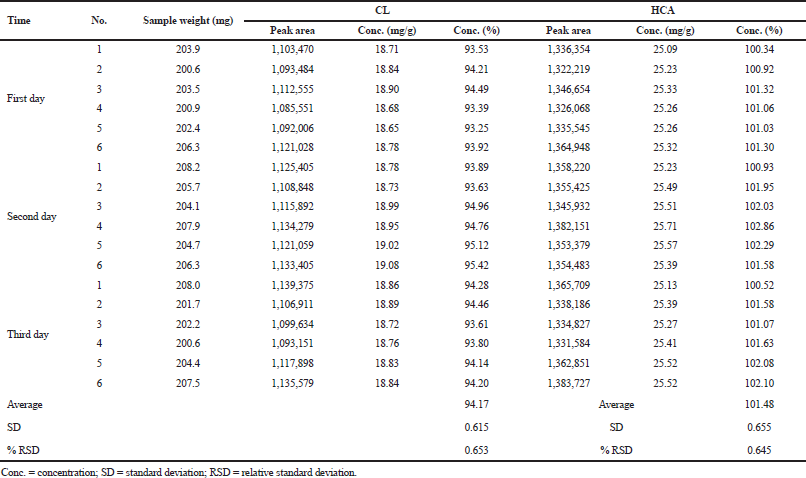 | Table 4. The precision studies of HPLC for the analysis of CL and HCA. [Click here to view] |
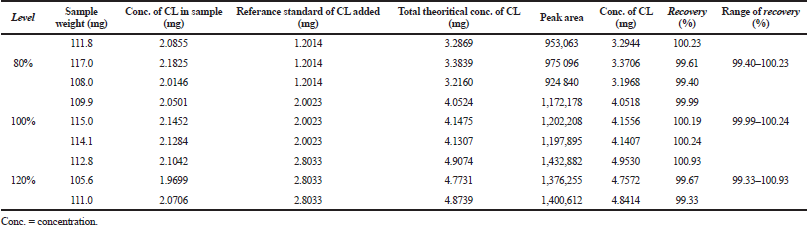 | Table 5. The accuracy studies of HPLC for the analysis of CL and HCA, as expressed by recovery percentages. [Click here to view] |
The validated HPLC method was then used for the analysis of commercial cream products containing CL and HCA. The average levels of CL were of 18.65 mg/g (equivalent to 93.27% from declared level) and 25.22 mg/g (equivalent to 100.88% from declared level). The developed method is accurate and reliable for the simultaneous determination of CL and HCA in cream samples.
CONCLUSION
The experimental design of BBD has been successful to achieve an effective and efficient separation of CL and HCA in cream preparation. There is no difference between HPLC conditions suggested by BBD and actual HPLC running (p > 0.05 via the independent t-test). HPLC method exhibited acceptable performance characteristics as required by ICH. The validated method is also successfully used for the analysis of CL and HCA in cream formulations.
ACKNOWLEDGEMENTS
The authors thank the Ministry of Research and technology scheme World Class Research 2020 with contract number of 869/UN1/DITLIT/DIT-LIT/PT/2020.
CONFLICT OF INTEREST
The authors have no conflict of interest during this study.
FUNDING
None.
REFERENCES
Al-Rimawi F, Kharoaf M. Analysis of chloramphenicol and its related compound 2-amino-1-(4-nitrophenyl)propane-1,3-diol by reversed-phase high-performance liquid chromatography with UV detection. Chromatogr Res Int, 2011; 2011:1–6. CrossRef
Al-Sabha N, Rasheed BA. Spectrophotometric method for determination of chloramphenicol in pharmaceutical preparations using 1,2-Naphthoquinone-4-sulphonate as a chromogenic reagent. Jordan J Chem, 2010; 5:201–10.
Araujo P. Key aspects of analytical method validation and linearity evaluation. J Chromatogr B Analyt Technol Biomed Life Sci, 2009; 877:2224–34. CrossRef
Bracey A, Garrett L, Weiss PJ. Determination of hydrocortisone and hydrocortisone acetate in antibiotic mastitis preparation. J Pharm Sci, 1966; 55:1113–5. CrossRef
Budiarti A, Gandjar IG, Rohman A. Liquid chromatography with UV detection for simultaneous determination of ciprofloxacin and metronidazole. J Teknol, 2015;72:45–7. CrossRef
Czyrski A, Sznura J. The application of Box-Behnken-design in the optimization of HPLC separation of fluoroquinolones. Sci Rep, 2019; 9:1–10. CrossRef
DoÅ‚owy M, Maryszczak J, Pyka A. Comparison of the detection and quantitative limits of hydrocortisone acetate in different chromatographic conditions in TLC. J Liq Chromatogr Relat Technol, 2014; 37:2929–41. CrossRef
Ferreira SLC, Bruns RE, Ferreira HS, Matos GD, David JM, Brandão GC, da Silva EGP, Portugal LA, dos Reis PS, Souza AS, dos Santos WNL. Box-Behnken design: an alternative for the optimization of analytical methods. Anal Chim Acta, 2007; 597:1791–86. CrossRef
Iqbal MS, Shad MA, Ashraf MW, Bilal M, Saeed M. Development and validation of an HPLC method for the determination of dexamethasone, dexamethasone sodium phosphate and chloramphenicol in presence of each other in pharmaceutical preparations. Chromatographia, 2006; 64:219–22. CrossRef
Katakam P. Stability indicating HPLC for chloramphenicol and prednisolone acetate in bulk and formulations. Asian J Pharm Clin Res, 2014; 5:3–7.
Kristiningrum N, Rakhmawati M. Simultaneous determination of chloramphenicol and hydrocortisone acetate in cream using TLC desitrometry method. Int Curr Pharm J, 2012; 2:7–10. CrossRef
Prabaningdyah NK, Riyanto S, Rohman A, Siregar C. Application of HPLC and response surface methodology for simultaneous determination of curcumin and desmethoxy curcumin in Curcuma syrup formulation. J Appl Pharm Sci, 2017; 7:58–064.
Purba NBR, Rohman A, Martono S. The optimization of HPLC for quantitative analysis of acid orange 7 and sudan ii in cosmetic products using box behnken design. Int J Appl Pharm, 2019; 11:130–7. CrossRef
Pyka A, Babuska-Roczniak M, Bochenska P, Determination of hydrocortisone in pharmaceutical drug by TLC with densitometric detection in UV. J Liq Chromatogr Relat Technol, 2011; 34:753–69. CrossRef
Ravisankar P, Naga Navya C, Pravallika D, Sri DN. A review on step-by-step analytical method validation. IOSR J Pharm, 2015; 5:2250–3013.
Siregar C, Prabaningdyah NK, Choiri S, Riyanto S, Rohman A. Optimization of HPLC using central composite design for determination of curcumin and demethoxycurcumin in tablet dosage form. Dhaka Univ J Pharm Sci, 2017; 16:137–45. CrossRef
Vanbel PF, Schoenmakers PJ. Selection of adequate optimization criteria in chromatographic separations. Anal Bioanal Chem, 2009; 394:1283–9. CrossRef
Wu TJ, Lu J, Ni H, Li P, Jiang Y, Li HJ. Construction of an optimized method for quality evaluation and species discrimination of coptidis rhizoma by ion-pair high performance liquid chromatography combined with response surface methodology. J Pharm Biomed Anal, 2018; 153:152–7. CrossRef