
INTRODUCTION
Natural products, either as standardized plant extracts or as pure compounds, offer boundless openings for novel drug leads because of the availability of unparalleled chemical diversity (Cos et al., 2006). From the ancient period, people have been exploring the Mother Nature, particularly herbs in search of novel drugs. “In 1988 the database NAPRALERT contained >88,000 secondary metabolites, and each year some 4,000 new ones are reported, this is from the relatively few species so far studied” which resulted in the application of considerable quantity of medicinal plants with therapeutic properties to cure several ailments (Verpoorte, 1998; Verpoorte et al., 1999). The research on medicinal plants continues predominantly for the discovery of new lead molecule from secondary metabolites of medicinal plants. About 80% of the products were of plant source, and their trade outpaces US $65billion in 2003 (Patwardhan et al., 2004).
Biological diversity linked to chemical diversity is studied as one of the wealthy origins of bioprospecting, which leads to the exploration of some of the most significant bioactive molecules (Ramesha et al., 2011). The phylogenetic search which depends on the taxonomic neighborhood is witnessed as the first line for the revelation of alternative origin for the actual secondary metabolite. This route to explore different sources for the existing metabolites has been used profitably in the previous work. Based on this approach, Huberantha Senjiana, a new species of Huberantha (Annonaceae) from Peninsular India Endemic to Gingee hills, Villupuram District, Tamil Nadu, India, was selected for this study (Muralidharan et al., 2015a). In 2008, floristic studies carried out in Gingee Hills, Villupuram District, Tamil Nadu, identified unique populations of one Annonaceae species and the study of characters were highlighted and differentiated. Chaowasku (2013) and Chaowasku et al. (2012) stated that this species allied to the recently described genus Hubera (Chaowasku et al., 2012). A newly discovered genus of the tribe Miliuseae, Hubera, separated from Polyalthia and associated to Miliusa, is established and described (Chaowasku et al., 2012) The species is named for the type locality, namely Senji (Gingee) (Muralidharan et al., 2015a). The genus name Hubera was found to be similar to Huberia DC (1828: 167; Melastomataceae). Therefore the generic name Hubera was replaced with a new name Huberantha by the nomenclature committee for vascular plants (Muralidharan et al., 2015b).
In the preliminary investigation, we identified the existence of different compound classes. On the basis of the results obtained in a preliminary phytochemical analysis and HPLC fingerprint analysis, quercetin was selected as a marker compound to quantify, isolate, characterize, and validate the method developed. The experiment was carried out by using the HPLC with a Photodiode array (PDA) detector. considering that it is the most suitable method for the detection and quantification of the phytoconstituents present.
Quercetin is identified to have a variety of biological activities (Formica and Regelson, 1995) and possibly will play a significant part in the medicinal properties of H. senjiana. As per the literature survey, there is no validated analytical technique for determining the quercetin content in H. senjiana leaf. Therefore, in the present analysis, we have established a simple, selective, and rapid RP-HPLC technique for the detection of quercetin content in the ethyl acetate extract of H. senjiana leaf. HPLC with reversed-phase columns using gradient elution is the most frequently applied technique for the analysis of various constituents existing in medicinal plants (Sheu and Li, 1998). The study also aimed at the development of suitable isolation techniques, which helps to get a pure compound. Further characterization of the isolated compound was carried out by the divergent spectral analysis to confirm the structure.
MATERIALS AND METHODS
Samples and reagents
Standard quercetin was procured from M/s Natural Remedies, Bangalore, India. All the solvents used were of HPLC grade, mobile phase and other reagents were prepared by using Milli Q water.
Collection and authentication
The fully matured leaves of H. senjiana (Annonaceae) were collected in October 2017 from the region of Gingee Hills, Pakkamalai, Villupuram district, Tamil Nadu, India. The voucher specimen was prepared and identified by “Dr. C. Murugan, Scientist ‘E’ & Head of Office, Botanical Survey of India, Southern Regional Centre, T. N. A. U. Campus, Lawley Road, Coimbatore-641 003 (Reg. no. of the certificate: BSI/SRC/5/23/2019/Tech. /3313)” and a specimen (voucher no. SK1677) was deposited for future reference in the Division of Molecular Biology Herbarium, SRM IST, Tamil Nadu, India. The leaf of H. senjiana was drained thoroughly to remove the traces and shade dried at room temperature and grounded in the electrical mill to produce a coarse powder with the average particle size of 0.4 mm. The course material was stockpiled in the airtight container to protect from moisture and sunlight.
Apparatus
The chromatographic separations were attained with the HPLC system (Shimadzu Prominence) by using a diode array detector (DAD) detector and an LC20AD binary solvent supply module, an SPD M20A PDA detector, and a Rheodyne injector (model 7125, USA) valve fitted with a 20 μl loop, CT0-20A Column oven. The controller unit with CBM-20A Communications Bus Module was used to control the system and the Lab solutions software (7.1 Version) was used to set the data acquisition. Liquid chromatography–mass spectrometer (LC–MS) system supported with LC10ADVP binary pump (Shimadzu, Japan) and MS comprised single quadrupole mass analyzer with electrospray ionization (ESI) (+) as an ionization source. Phenomenex C18 column (250 mm × 4.6 mm; 5 μm) was used as the stationary phase for the separation and quantification at the wavelength of 254 nm.
Method of extraction
The plant leaves of H. senjiana are used for the extraction. The material is set free of all the molds, insects, and other contaminations of the soil and dried in shade for not less than 3 weeks and protected from sunlight. The leaves were grounded using the electrical mill without the loss of the plant powder and were sieved using 40 mesh sieve size. The coarsely powdered foliar part of the plant powder was accurately weighed (about 1 kg) and was subjected to cold maceration using the successive extraction technique with (5 l) of hexane followed by chloroform, ethyl acetate, isopropyl alcohol, and methanol in a bell jar. The extract was arbitrated occasionally by handshaking at periodic intervals till 36 hours. The whole extraction procedure was performed at room temperature. Whatman filter paper was used to filter the homogenate and the filtrate was reduced at 40°C under reduced pressure in an evaporator, dried and stored in a refrigerator at 4°C for further use. All the extracts collected were weighed and the percentage extractive value of the extract was calculated.
Preliminary phytochemical screening
Phytochemical screening studies for the foliar extract of H. senjiana using hexane, chloroform, ethyl acetate, isopropyl alcohol, and methanol were carried out as per the standard method (Evans et al., 2009). In common, the preliminary test for the presence or absence of phytoconstituents using standard procedures includes the addition of a suitable chemical reagent to the extracts in a dried test tube and shaken uniformly. The diverse qualitative chemical tests were carried out to establish a phytochemical profile for the extracts taken for the analysis. The analysis exposed the secondary metabolites present such as alkaloids, flavonoids, phenols, saponins, sterols, and terpenoids.
ANALYTICAL METHODS
Preparation of samples for HPLC analysis
The dried plant extract obtained by successive extraction each (100 mg) was transferred into a 10 ml volumetric flask containing each 5 ml of MeOH. The sample was sonicated for 15 min and made up to the volume with MeOH as a diluent, filtered through a cellulose membrane of 0.45 μm and an aliquot of 20 μl was injected into the HPLC system.
Preparation of standard solution
A standard stock solution of quercetin was prepared by dissolving 5 mg of standard quercetin to a 10 ml volumetric flask containing 5 ml of methanol, sonicated for about 10 minutes and made up to the volume with methanol as the diluent to make the concentration of 500 μg/ml. The stock solution prepared was further diluted to prepare the working standard of 100 μg/mL for the studies.
Optimized chromatographic conditions
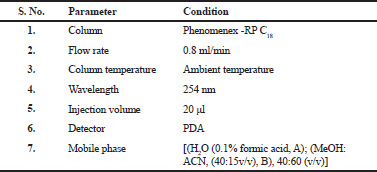
The liquid chromatographic separations were achieved using mobile phase be made up of [(H2O (0.1% formic acid, A); (MeOH: ACN, (40:15v/v), B), 40:60 (v/v)]. The flow rate of 0.8 ml/min was maintained and before carrying out the experiment the mobile phase was degassed for 15 min using ultrasonicator. The column used was RP C18 analytical (Phenomenex C18) column with 250 mm × 4.6 mm; 5 μm (particle size). All the experiments were performed under ambient temperature (25 ± 2°C) with 20 μl injection volume at a wavelength of 254 nm. The chromatographic environments were preserved at an ambient temperature throughout the analysis.
HPLC fingerprint analysis
HPLC fingerprint chromatogram was established for the extracts by applying the optimized chromatographic conditions for use in the quality control aspect in future research. From the fingerprint analysis, the total number of phytoconstituents present in each extract was detected, further, the compounds with known mass value can be identified by comparing the retention time of the standard and the sample, the further mass value obtained by scanning the chromatogram of the sample and the mass value of the standard can be compared to identify the compound, therefore, the HPLC-DAD-ESI (+) MS analysis was carried out to identify the known compound present.
HPLC-DAD-ESI (+) MS analysis
Extracts were filtered by a Millipore filter of 0.45 μm and 20 μl injected into an Intersil-NH2 column, (250 x 4.6 mm, 5 μm) The temperature required for curved desolvation line was maintained at 250°C and heat block at 400°C. The separation was made on an LC–MS (Shimadzu, Japan) equipped with LC10ADVP binary pump device with DAD coupled with MS comprised single quadrupole mass analyzer with ESI (+) as an ionization source and nitrogen was utilized to support nebulization at a flow rate of 1.5 ml/min. The mobile phases [methanol: water (0.1% formic acid) in the ratio of (55:45)] were used as the mobile phase at a flow of 0.5 ml/min. The peak separated by LC was identified by their mass value through scanning the chromatogram by MS. The analysis of ethyl acetate extract resulted in identification of a mass value 301.00 m/z which is the mass value of quercetin to confirm further quercetin standard (from Sigma Aldrich) was used in parallel, The HPLC chromatogram of extracts and the HPLC chromatogram of the standard quercetin was compared, the similar Rt and the mass value obtained for standard quercetin and a particular peak in ethyl acetate extract indicated the presence of quercetin.
METHOD VALIDATION
Method validation was carried out as per the International Conference on Harmonization (ICH) Q2B guidelines, different parameters like linearity, precision, accuracy, limit of detection (LOD), limit of quantification (LOQ), and robustness of the method was validated as per the guidance given (ICH, 2005).
Linearity
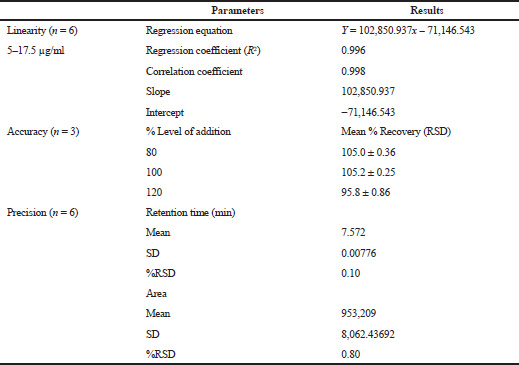
Working standard solutions containing quercetin were prepared and diluted to the linear concentration range for the construction of a calibration curve. A minimum of six concentrations (n = 6) of the analyte solution was analyzed in the conc. range of 5–17.5 μg/ml, and the calibration curve was plotted by the mean peak area versus the concentration of an analyte.
Precision
The method precision was established by analyzing sample solutions containing six replicate concentrations of quercetin equivalent to 10 μg/ml and from the obtained area, the concentration was estimated, and the findings were articulated as %RSD (relative standard deviation).
Accuracy
The accuracy study was assessed by means of recovery assay performed by the standard addition method of quercetin in the sample matrix, at three different levels ranging from 80%, 100% and 120% of the initial concentration. For evaluation of recovery of standard quercetin, each individual sample solution was injected in triplicate. The percentage recovery was calculated by using the formula given.
“Recovery (%) = {(amount found − original amount) /amount spiked} × 100”
LOD and LOQ
Calibration curve was plotted ranging from 5 to 17.5 μg/ml of the nominal analyte concentration. The residual standard deviation of the response (σ) and slope (s) of the calibration curve was used to estimate the LOD as 3.3 σ/s and LOQ as 10 σ/s. Using the above equation, the values for LOD and LOQ are obtained.
Robustness
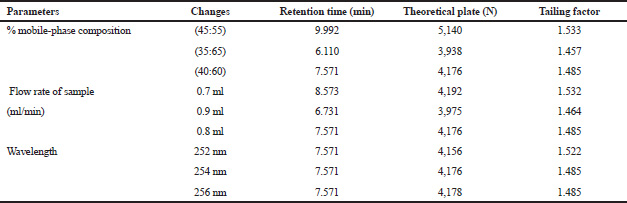
Robustness of the assay method was established by intentionally altering the chromatographic conditions like the composition of the mobile phase, flow rate, and wavelength using a standard solution at 100% concentration from the linear graph in triplicate. Based on the percentage of recovery and RSD of the results obtained, changes in these parameters were estimated.
ISOLATION
Column chromatography
The conventional column chromatography method was used for the isolation and purification of the phytoconstituents from ethyl acetate crude extract. The column was packed using silica gel (60:120 Mesh) (Merck, India). The sample to be purified was mixed with silica gel uniformly and was introduced into the column from the top without disturbing the column. The column was eluted using gradient hexane–EtOAc (90:10–100%) to obtain 10 fractions. The fractions were collected in the volume of 100 ml each and thin layer chromatography was done for all the fractions. The fractions with similar Rf were pooled together and similar fractions were again subjected to column chromatography (5 g) eluted with – EtOAc–MeOH (100:5) finally to get a compound (5 mg), which revealed a single spot on the Thin Layer Chromatography (TLC) plate resulted in Toluene: ethyl acetate: formic acid (6:2:0.8) as a solvent system. Finally, the solvents were separated using an evaporator under vacuum. The compound shows fluorescence at 366nm and derivatization with an aluminum chloride solution revealed a single spot.
Characterization of the isolated compound
The isolated compound was characterized using the UV–visible spectrophotometer, Infrared (IR), Nuclear Magnetic Resonance (NMR), and Mass spectroscopy. UV–visible spectrophotometer was employed to record the UV spectrum of the isolated compound from 190 to 600 nm. Fourier Transform Infrared Spectroscopy (FT-IR) (Bruker, Alpha E and T) spectra was recorded for isolated compound, about 1-2 mg of sample was crushed with 3-4 mg of KBr to get a pellet with the help of a mechanical press. The spectra were recorded with the wavelength range of 4000 – 400 cm-1. 1H NMR, 13C NMR (Bruker 500 MHz, Switzerland) spectra were recorded by dissolving the sample in DMSO - d6 as a solvent and about 600 μl of the sample was added in the NMR tube and observed in the applied magnetic field. Mass analysis was performed with (LC – MS 2020 Shimadzu, Japan) supported with an LC10ADVP binary pump coupled with MS comprised single quadrupole mass analyzer with ESI (+) as an ionization source.
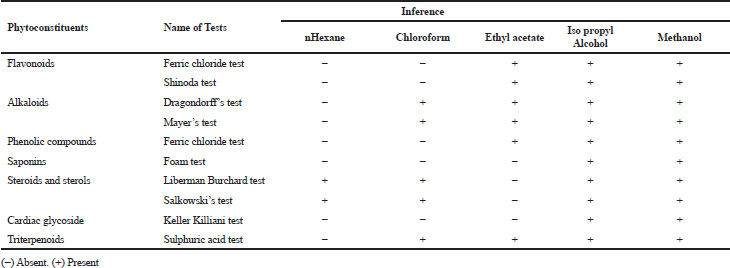 | Table 1. Preliminary phytochemical screening of H. senjiana leaf extracts. [Click here to view] |
RESULTS AND DISCUSSION
Preliminary phytochemical screening of all the extracts was performed, the results showed the presence of different chemical compounds in different extracts, and the results were given in Table 1. TLC of all the extracts was carried out to find the number of phytocompounds present in each extract before carrying out the fingerprint analysis by HPLC. Fingerprint analysis of all the extracts was done by using the LC–MS since the technique is more suitable to identify the number of phytoconstituents present and the mass value obtained by scanning the chromatogram is helpful in identifying the known compounds present initially and the other unknown compounds can be identified further by isolation and characterization, therefore, our primary aim is to identify the known markers present in the new species. HPLC-DAD-ESI (+) MS analysis was carried out to identify the known compound present (Stobiecki, 2000; Maillard et al., 1993) and the results were given in Figure 1a–e. Ethyl acetate extract showed the presence of quercetin while scanning the chromatogram of ethyl acetate extract by MS and further confirmed by comparing the retention time of extracts with the retention time of standard quercetin and the similar mass value obtained for standard quercetin and the mass value of a particular peak in ethyl acetate extract confirmed the presence of quercetin (Fig. 2a and b). The developed method was optimized with more than a few mobile phase compositions and an acceptable separation and fine peak symmetry were attained with the mobile-phase composition of [(H2O (0.1% formic acid, A); (MeOH: ACN, (40:15v/v), B), 40:60 (v/v)]. The optimized chromatographic conditions were given in Table 2. The optimized method was validated as per the ICH Q2B guidelines, and parameters like linearity, precision, accuracy, LOD, LOQ, and robustness of the method were validated. The summarized linearity regression data given in Table 3 display a good quality linear correlation between concentration and peak areas at a concentration range of 5–17.5 μg of quercetin (Fig. 3a and b). The correlation coefficient (R2) was observed to be 0.996. LOD and LOQ were observed to be 2.28 μg/ml and 6.92 μg/ml, respectively. These estimates denote that the method developed is sensitive. Accuracy reports indicated the average recovery of the added standard drug of quercetin and the results were given in Table 3. In the precision analyses, the RSD value of mean assay was found to be within the standard limit and the results were given in Table 3. The estimate indicates satisfactory repeatability of the method (Fig. 3c and d). Robustness reports indicated that the outcomes of the method used remained unchanged by trivial deliberate modifications in the mobile-phase composition, flow rate, and wavelength. The RSD of the results obtained was found to be within the standard limit and the results were given in Table 4.
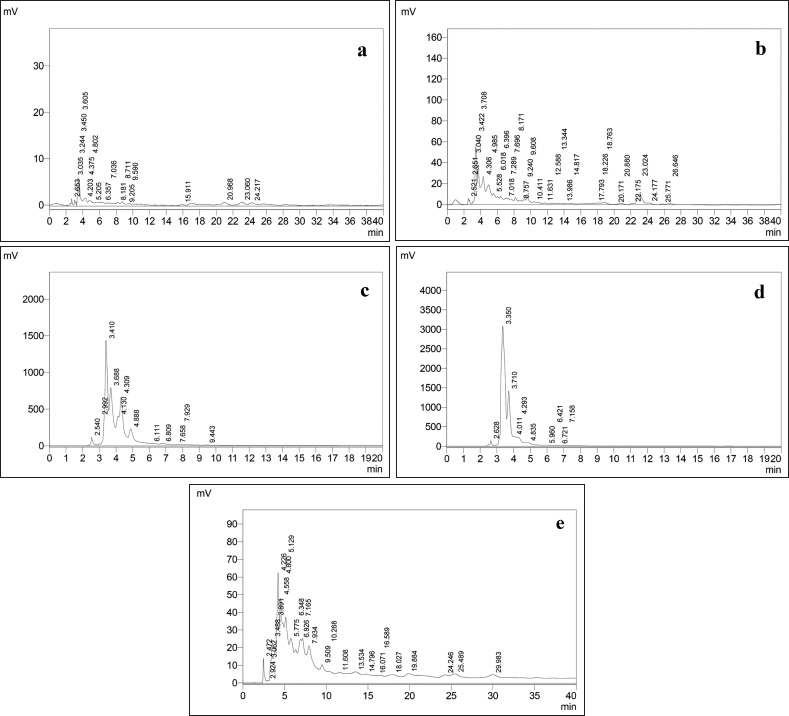 | Figure 1. HPLC Chromatogram of extracts. (a) Hexane. (b) Chloroform. (c) Iso propyl alcohol. (d) Methanol. (e) Ethyl acetate. [Click here to view] |
To confirm the structure of the quercetin identified by mass value. The ethyl acetate extract in which the compound identified was subjected to conventional column chromatography to isolate the compound. The isolated compound was identified by comparison of its 1H and 13C NMR data with the literature and is in agreement with the proposed structure (Schieber et al., 2000). The compound was obtained as a yellow solid. UV λ max was found to be 257, 377 nm. FT-IR spectrum is the fingerprint of a drug which gives an information about the functional group present and the nature of bonds present in the sample. The IR spectrum exhibits peaks at 3,283.54 is due to stretching vibrations of the O–H group, 2,945.61 and 2,831.57 could be assigned to stretching vibrations of −CH2 and CH3 functional groups, 1,656.09 cm−1 was assigned to (C=O) stretching, 1,455.09 (C–C=C), 1,237.65, 1,165.09, 1,014.91 cm−1 (OCH3), 797.16 cm−1 (C-H) (Sharma, 2007) (Fig. 4e). 1H NMR (500 MHz, δ (ppm), DMSO-d6): 6.18 (1H,s,H-6), 6.41(1H,s,H-8), 6.88(1H,s,H-2′), 7.53 (1H,d, H-5′, J=2.0 Hz), 7.68 (1H, d, H-6′, J=2.0 Hz) (Fig. 4a). 13C NMR (500 MHz, δ (ppm), DMSO-d6): 148.20 (C-2), 136.24 (C-3), 176.35 (C-4) 161.33 (C-5), 98.68 (C-6), 104.38 (C-7), 93.85 (C-8), 156.64 (C-9), 103.52 (C-10), 121.91 (C-1′), 115.37 (C-2′), 145.30 (C-3′), 147.90 (C-4′), 116.81 (C-5′), 120.48 (C-6′) (Fig. 4b). The molecular weight of the compound was found to be m/z: 301 (Fig. 4c and d). The structure of the compound was identified as quercetin (Fig. 5).
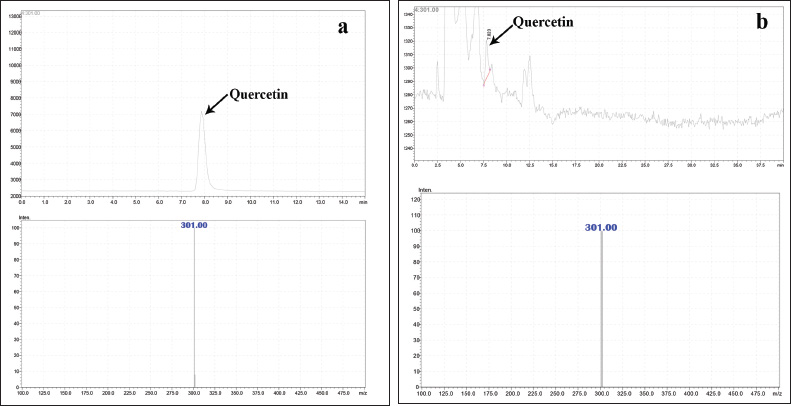 | Figure 2. (a) Mass spectrum of standard quercetin. (b) Mass spectrum of quercetin in H. senjiana ethyl acetate extract. [Click here to view] |
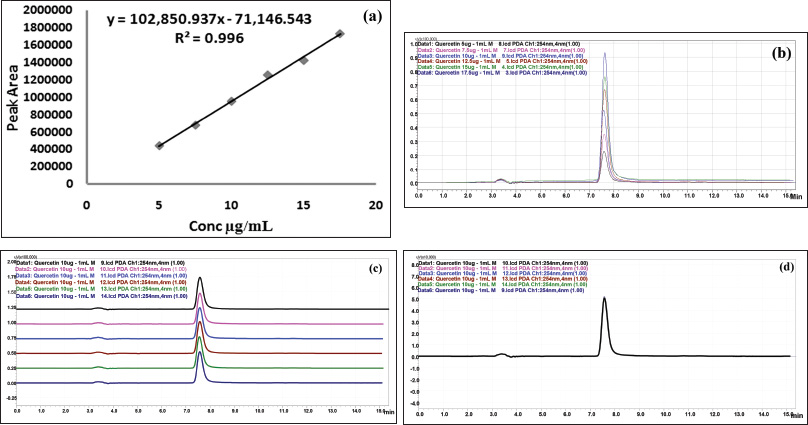 | Figure 3. HPLC chromatogram of standard quercetin. (a) Linearity. (b) Overlay spectrum of linearity. (c) Overlay spectrum of precision with base shift. (d) Overlay spectrum of precision without base shift. [Click here to view] |
 | Table 2. Optimized chromatographic conditions. [Click here to view] |
 | Table 3. Linearity, precision and accuracy analysis of quercetin. [Click here to view] |
 | Table 4. Robustness analysis of quercetin. [Click here to view] |
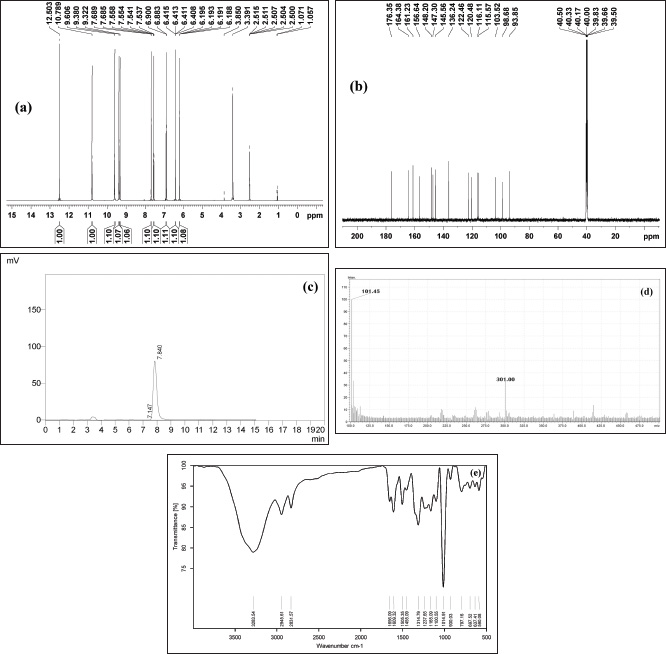 | Figure 4. (a) 1H NMR spectra. (b) 13C NMR spectra. (c) HPLC chromatogram of isolated compound. (d) Mass spectra of isolated compound. (e) FT IR spectra of isolated compound. [Click here to view] |
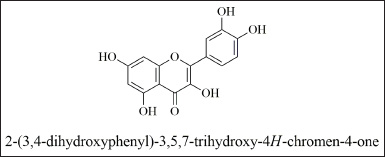 | Figure 5. Structure of quercetin. [Click here to view] |
CONCLUSION
The recommended HPLC method is simple, specific, rapid, precise, and accurate for the identification and quantification of quercetin, a polyphenolic flavonol. Since the chromatographic run time is short (13 min), the established technique can be implemented for the routine analysis like identification, quantification, and quality control. The method for isolation of quercetin from the leaves of H. senjiana can be used to isolate a particular compound in the future. In spite of the above study further studies need to be carried out in isolation of other phytoconstituents to explore the phytochemistry of the species and also the in vitro screening in different cell lines to explore the pharmacology of the rare growing endemic species needs to be carried out.
ACKNOWLEDGMENTS
The authors are very much thankful to the SRM Institute of Science and Technology for providing the resources and infrastructure to carry out the research work.
CONFLICT OF INTEREST
The authors declare that there are no conflicts of interest.
FUNDING
Funded by SRM IST, Kattankulathur, Tamil Nadu, India.
REFERENCES
Chaowasku T. (7) Request for a binding decision on whether Huberia DC. (Melastomataceae) and Hubera Chaowasku. Taxon, 2013; 62:412–13. CrossRef
Chaowasku T, Johnson DM, Van Der Ham WJM, Chatrou LW. Characterization of Hubera (Annonaceae), a new genus segregated from Polyalthia and allied to Miliusa. Phytotaxa, 2012; 69:33–56. CrossRef
Cos P, Vlietinck AJ, Vanden D, Maes L. Anti-infective potential of natural products: how to develop a stronger in vitro ‘proof-of-concept’. J Ethnopharmacol, 2006; 106:290–302. CrossRef
Evans WC, Evans D, Trease GE. Trease and Evans Pharmacognosy. Saunders/Elsevier, Edinburg, London, 2009.
Formica JV, Regelson W. Review of the biology of quercetin and related bioflavonoids. Food Chem Toxicol, 1995; 33:1061–80. CrossRef
International Conference on Harmonization of Technical Requirements for Registration of Pharmaceutical for Human Use ICH Guidelines. Validation of analytical procedures text and methodology Q2B (R1), 2005.
Maillard MP, Wolfender JL, Hostettmann K. Use of liquid chromatography-thermospray mass spectrometry in phytochemical analysis of crude plant extracts. J Chromatogr A, 1993; 647:147–54. CrossRef
Muralidharan R, Narasimhan D, Balachandran N. A new species of Hubera (Annonaceae) from Peninsular India. Phytotaxa, 2015a; 205:129–34. CrossRef
Muralidharan R, Narasimhan D, Balachandran N. Hubera senjiana is now Huberantha senjiana. Phytotaxa, 2015b; 217:200. CrossRef
Patwardhan B, Vaidya ADB, Chorghade M. Ayurveda and natural products drug discovery. Curr Sci, 2004; 86:789–99.
Ramesha BT, Gertsch J, Ravikanth G, Priti V, Ganeshaiah KN, Uma Shaanker R. Biodiversity and chemodiversity: future perspectives in bioprospecting. Curr Drug Targets, 2011; 12:1515–30. CrossRef
Schieber A, Ullrich W, Carle R. Characterization of polyphenols in mango puree concentrate by HPLC with diode array and mass spectrometric detection. Innov Food Sci Emerg Technol, 2000; 1:161–66. CrossRef
Sharma YR. Elementary Organic Spectroscopy: Principles and Chemical applications. S. Chand & Company, New Delhi, India, 2007.
Sheu SJ, Li KL. Liquid chromatographic determination of the constituents in Shao-yao-tang and related Chinese herbal preparations. HRC J High Resolut Chromatogr, 1998; 21:569–73. CrossRef
Stobiecki M. Application of mass spectrometry for identification and structural studies of flavonoid glycosides. Phytochemistry, 2000; 54:237–56. CrossRef
Verpoorte R. Exploration of nature’s chemodiversity: the role of secondary metabolites as leads in drug development. Drug Discov Today, 1998; 3:232–38. CrossRef
Verpoorte R, Heijden R Van Der, Hoopen HJG, Memelink J. Metabolic engineering of plant secondary metabolite pathways for the production of fine chemicals. Biotechnol Lett, 1999; 21:467–79. CrossRef