
INTRODUCTION
Heart failure is a complex clinical syndrome, which occurs due to the reduced ability of the heart to pump an adequate supply of the blood throughout the body. It has become a growing epidemiologic problem and a leading cause of morbidity and mortality. Globally, around 26 million people suffer from heart failure (Savarese and Lund, 2017). Blockade of renin angiotensin aldosterone system system using angiotensin-converting enzyme (ACE) inhibitors, angiotensin II receptor blockers, mineralocorticoid receptor antagonists, etc. have been pivotal to treat heart failure and to reduce associated mortality (Jhund and Mcmurray, 2016; Riegger, 1989).
Sacubitril/valsartan (SAC/VAL) is a novel acting, first in a new class of drugs approved for the treatment of heart failure. It consists of neprilysin inhibitor prodrug “Sacubitril” (SAC) and angiotensin receptor blocker “Valsartan” (VAL) in their anionic forms along with sodium cations and water in the molar ratio of 1:1:3:2.5, respectively. This single molecule having two distinct moieties has been proven superior to conventional ACE inhibitors in the treatment of chronic heart failure (Cada et al., 2015; Iborra-egea et al., 2017). The combination is sold under the brand name “Entresto” by Novartis and has been approved in more than 57 countries, including India. It was approved by U.S. Food and Drug Administration in July 2015 in the United States (US) and in September 2015 in the European Union. It was approved by Therapeutic Goods Administration in September 2016 in Australia (Dargad et al., 2018; Fala, 2015).
VAL, (S)-2-(N-((2ʹ-(2H-tetrazol-5-yl)-[1,1ʹ-biphenyl]-4-yl)methyl)pentanamido)-3-methylbutanoic acid, is official in United States Pharmacopeia (USP). The estimation of VAL and its related impurities using High-Performance Liquid Chromatography (HPLC) are described in the official monograph (“United States Pharmacopeia and National Formulary (USP 35-NF 30), Rockville, MD: United States Pharmacopeia Convention, 2012.,” n.d.). Different analytical methods have been reported in the literature for the estimation of VAL alone or in combination with another drug from the drug substance, dosage forms or human plasma (Bianchini et al., 2011; Francotte et al., 1996; Grace et al., 2011; Li et al., 2000; Macek et al., 2006; Nie et al., 2006; Pires et al., 2015; Ran et al., 2015; Sampath et al., 2009; Tatar and Sag, 2002). SAC, 4-(((2S,4R)-1-([1,1ʹ-biphenyl]-4-yl)-5-ethoxy-4-methyl-5-oxopentan-2-yl)amino)-4-oxobutanoic acid, is a prodrug that metabolize into sacubitrilat (LBQ657). The simultaneous estimation of SAC/VAL complex from drug substance, formulation or human/rat plasma has been reported using various analytical methods, including UV spectroscopic method (Eissa et al., 2018), High-Performance Thin-Layer Chromatography (HPTLC) (Ragab et al., 2018), High-Performance Liquid Chromatography (HPLC) (Attimarad et al., 2018; Mahmoud, 2018; Moussa et al., 2018; Ragab et al., 2018), and Liquid chromatography-tandem mass spectrometry (LC-MS/MS) (Haranadha et al., 2016). A chiral separation of SAC/VAL from their enantiomer using HPLC method has also been reported (Zhou et al., 2018). However, most of the reported HPLC methods consume a larger amount of solvents and time. In contrast, the Ultra High-Performance Liquid Chromatography (UHPLC) method provides sensitive, selective output with better resolution in a shorter duration, which offers cost-effective outcomes. Hence, we intend to opt for a faster chromatographic technique, UHPLC, for the estimation of SAC/VAL in presence of their process related and degradation impurities. To the best of our knowledge, no such literature is reported till date for SAC/VAL. Hence, the main objective of this study was to develop and validate rapid, specific, and sensitive stability indicating UHPLC method for the estimation of SAC/VAL in the presence of their process related and degradation impurities from the drug substances. The UHPLC method was developed and validated as per ICH Q2 (R1) guideline.
MATERIALS AND METHODS
Samples, reagents, and chemicals
Pure standard of SAC/VAL, as well as individual standards of SAC and VAL, were obtained as a gift sample from Torrent Pharmaceuticals Ltd, Ahmedabad. Seven known process-related impurities (Table 1) were purchased from MSN Ltd. From that, three impurities were of VAL and four impurities were of SAC.
HPLC grade methanol and acetonitrile were purchased from J.T. Baker (USA) and tetrahydrofuran (THF) was purchased from RENKEM (Thane, India). Analytical grade perchloric acid (70%), sodium hydroxide pellet, hydrogen peroxide, hydrochloric acid etc. were procured from Merck (Mumbai, India). Purified water used during the entire studies was obtained using Millipore Milli-Q plus (Make & Model: Millipore Corporation, Bangalore, India & Millipore Milli Q Plus ZD5211584) purification system.
Equipment and apparatus
The UHPLC analysis was performed on Acquity H class system (Waters Corporation, USA), which was equipped with a quaternary solvent manager, sample manager, an auto-injector, a photodiode array, and TUV detector. Empower 3.0 software was utilized for system monitoring, control, and data acquisition.
The chemical and thermal stress degradation were carried, respectively, using a water bath (Jelo Tech; Korea) and a hot air oven equipped with a vacuum (Jelo Tech; Korea). Power Soni-405 (Branson 8800, USA) ultrasonicator was used to dissolve the samples. The pH of the mobile phase and solutions were measured using 780 pH Meter (Metrohm, Herisau, Switzerland).
UHPLC conditions
Various trials were conducted for the method development. Final chromatographic separation was achieved on Accucore XL C8, (100 × 4.6) mm; 3 μm reverse phase column by maintaining the temperature at 30°C. In the optimized method, the mobile phase A consisted of a mixture of THF and 0.1%v/v perchloric acid (in water) buffer (8:92, %v/v), while mobile phase B consisted of a mixture of THF:water:acetonitrile (5:15:80, %v/v/v). Mobile phase A and B were set at linear gradient programme [time (minute)/mobile phase-B (%): 0.0/25, 3.0/25, 12.0/35, 17.0/80, 19.0/25, and 21.0/25]. The flow rate was set at 0.6 ml/minute, the injection volume was kept 2 μl. The samples were scanned in the range of 200–400 nm using a PDA detector and the monitoring wavelength was set at 240 nm.
Sample preparation
Preparation of stock solutions for the standard drug and impurities
The mixture of water and acetonitrile (50:50, %v/v) was used as a diluent in the preparation for samples. Accurately weighed 25 mg of SAC and VAL standards were individually transferred to different volumetric flasks of 25 ml. Around 20 ml of the diluent was added and sonicated for 15 minutes to dissolve the drugs completely. The volume was made up to the mark with the diluent to obtain the stock solution of 1 mg/ml.
Accurately weighed equivalent 5 mg of each impurity, i.e., Desvaleryl-Valsartan (DES-VAL), Butyryl-Valsartan (BUT-VAL), Benzyl-Valsartan (BEN-VAL), Diacid-Sacubitril (DIA-SAC), Cyclic-Sacubitril (Cyc-SAC), Methyl-Sacubitril (MET-SAC), and Maleic-Sacubitril (MAL-SAC) was transferred individually to seven different volumetric flasks of 50 ml. About 35 ml of the diluent was added and the flasks were further sonicated to dissolve the impurities. The volume was made up to the mark to obtain the stock solution of 0.1 mg/ml for each impurity.
Preparation of solution for assay and related substances method
Precise and appropriate volumes from the stock solutions for SAC, VAL, and seven impurities were transferred into the same volumetric flask and diluted with the diluent to obtain a solution containing SAC (1 μg/ml), VAL (1 μg/ml), DIA-SAC (5 μg/ml), DES-VAL (1.5 μg/ml), BUT-VAL (1.5 μg/ml), BEN-VAL (1.5 μg/ml), Cyc-SAC (1.5 μg/ml), MET-SAC (1.5 μg/ml), and MAL-SAC (1.5 μg/ml). This solution was used for related substances estimation method. For the assay method, SAC and VAL standard stock solutions were diluted to obtain concentration of 100 μg/ml for each drug.
Preparation of system suitability solutions
System suitability solution was prepared by diluting appropriate volumes from the stock solutions for SAC, VAL, and seven impurities to obtain a solution with SAC (1 mg/ml), VAL (1 mg/ml), DIA-SAC (5 μg/ml), DES-VAL (1.5 μg/ml), BUT-VAL (1.5 μg/ml), BEN-VAL (1.5 μg/ml), Cyc-SAC (1.5 μg/ml), MET-SAC (1.5 μg/ml), and MAL-SAC (1.5 μg/ml). Six replicate injections of the sample were injected in the UHPLC and the peak area, asymmetry, resolution, theoretical plates were calculated.
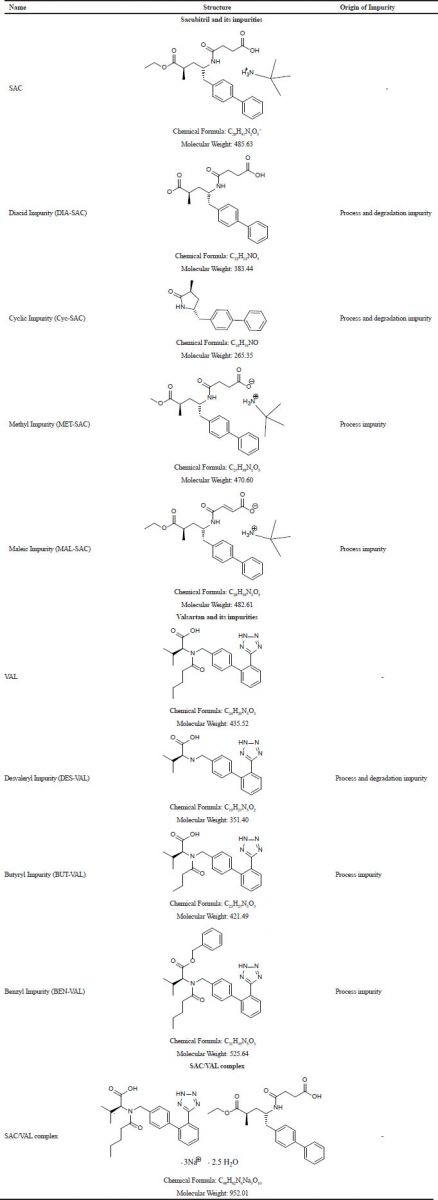 | Table 1. Chemical structures of SAC, VAL, and their related impurities. [Click here to view] |
Preparation of SAC/VAL sample solution
About 50 mg of the SAC/VAL complex sample was weighed accurately and transferred to 25 ml of volumetric flask. About 20 ml of the diluent was added and sonicated for 15 minutes. The volume was made up to the mark to obtain a final concentration of 2 mg/ml of SAC/VAL. This solution was used for the related substance method. For the assay method, the above solution was diluted using the diluent to obtain the solution of 200 μg/ml of SAC/VAL.
Analytical method validation
The developed UHPLC method was validated as per ICH Q2 (R1) guideline for the validation of analytical procedures to ensure the acceptable performance of the method for the proposed determination.
Limit of Detection (LOD) and Limit of Quantification (LOQ)
LOD and LOQ of the drugs and impurities were estimated at the respective signal-to-noise ratio of 3:1 and 10:1 by injecting a series of diluted samples with known concentration for SAC/VAL and all impurities. Precision was performed by injecting six replicate samples of SAC/VAL and all impurities at LOQ level and by calculating % relative standard deviation (RSD) of peak areas.
Linearity
Linearity was carried out to demonstrate the detector response is proportional to the concentration of SAC/VAL and their impurities in the specified range. Linearity test solutions were prepared in triplicate at seven concentration levels ranging from LOQ to 150% with respect to specification limit for related impurities and 50% to 150% with respect to sample concentration for the assay method. The calibration curves for peak area versus concentration (μg/ml) were plotted and determination coefficients (r2) were calculated for each analyte. The response factor (RF) and relative response factor (RRF) were established using the slope of a linear curve.
Accuracy
The closeness of agreement between the true value and the value found was determined by accuracy study. The accuracy of the related substances method was evaluated in triplicate by the standard addition method. Wherein, each impurity was spiked at LOQ, 100% and 150% level in the SAC/VAL solution. The spiked concentrations for DIA-SAC impurity were LOQ, 5.00 and 7.50 μg/ml, whereas the spiked concentrations for DES-VAL, BUT-VAL, BEN-VAL, Cyc-SAC, MET-SAC, and MAL-SAC impurities were LOQ, 1.50 and 2.25 μg/ml in the 2 mg/ml of SAC/VAL solution. The percentage recovery for SAC/VAL and all impurities were calculated at each level. The percentage recovery was calculated for each added concentration. For the assay method, 50%, 100%, and 150% of each drug were spiked in the SAC/VAL sample in the triplicate and percentage recovery was calculated at each level.
Precision
The closeness of agreement between a series of measurements was exhibited by the precision study. Repeatability and intermediate precision of the related substances method were evaluated using six replicate samples of the standard impurity solution at 100% level in the 2 mg/ml SAC/VAL solution. Repeatability and intermediate precision of the assay method were carried out using six replicate injections of the SAC/VAL at 100% level. The %RSD was calculated for each drug and impurity.
Specificity/stress degradation study
Stress degradation study was performed on SCA/VAL drug complex to establish the stability indicating property and to prove the specificity of the developed analytical method. The stress degradation study was carried as per ICH recommended conditions. The acid and base hydrolysis were carried out using 1 N HCl at 60°C for 30 minutes and 0.5 N NaOH at room temperature for 10 minutes, respectively. The acid and base degraded samples were neutralised before dilution. Neutral hydrolysis was carried by adding sufficient water to wet the sample, which was further placed in the hot air oven for 3 days at 60°C. Oxidative degradation was carried out using 15% H2O2 at 60°C for 30 minutes, while photolytic degradation was carried out by exposing the samples with 1.2 million lux hours of visible radiation and 200 W*hour/m2 UV radiation, simultaneously. Thermal stress was given using a hot air oven at 80°C for 5 days.
The SAC/VAL concentration was kept at 2 mg/ml for related substances method, whereas it was kept 200 μg/ml for estimation of the %assay. All the prepared sample solutions were filtered through 0.22 μm nylon syringe filters prior to the injection in UHPLC.
Robustness
The robustness of the proposed developed method was checked by deliberately altering the instrumental conditions. The flow rate of the developed method was 0.6 ml/minutes, so it was changed ± 0.1 ml/minute, i.e., 0.5 ml/minutes and 0.7 ml/minute. Similarly, the effect of column temperature was studied by varying it by ± 5°C, i.e., 25 and 35°C instead of 30°C. The impact of mobile phase on the results was evaluated by changing the mobile phase ratio by 2% for both mobile phase A and B. The resolution and selectivity between the nearby peaks of SAC/VAL and their impurities were assessed in all the altered conditions.
RESULTS AND DISCUSSION
The objective of the present study was to develop rapid, economic, sensitive, and specific UHPLC method for the estimation of SAC/VAL in presence of their related impurities as well as degradation products.
Method development and optimization
The main target for the development of the chromatographic method was to achieve separation between the drugs, their related substances and degradation products. Various trials were conducted to achieve the optimum resolution by changing column, mobile phase, flow rate, and column oven temperature.
Initially, 0.05 M potassium hydrogen phosphate buffer (pH 1.7 with orthophosphoric acid) was used as a mobile phase-A, while acetonitrile and water in the ratio 90:10 (%v/v) was used as a mobile phase-B in a different gradients at a flow rate of 0.6 ml/minute with C18 (100 mm × 4.6 mm; 1.7 μm) column at 30°C. But, peak elution was early, the resolution was poor and the peak shapes of the impurities were not proper. Hence, further trials were conducted using the same mobile phase using C8 (100 mm × 4.6 mm; 3 μm) column. When the system suitability solution was injected, base to base separation of the impurities was not observed between the impurity peaks. So, acetonitrile was replaced with methanol in mobile phase-B. But, still satisfactory results were not achieved. Furthermore, THF was added in mobile phase-A (phosphate Buffer: THF, 92:8, %v/v) and mobile phase-B (THF:water:Acetonitrile, 5:15:80, %v/v/v). Different gradients were tried, which resulted in good resolution between the main peak and related substances, except Cyc-SAC impurity peak and VAL peak as they merged with each other.
Hence, the phosphate buffer was replaced by 0.1% perchloric acid in mobile phase-A for further method development. First, the trials were started with perchloric acid in water: THF (95:5, %v/v) as a mobile phase A and a mixture of THF, water and acetonitrile (5:10:85, v/v/v) as mobile phase B in a gradient mode [time/mobile phase-B (%): 0.0/30, 7.0/50, 9.0/63, 11.0/63, 12.0/63, 15.0/30]. All the impurities and main peak separated well from each other. However, an unknown degradation product of oxidative stress condition found to be merging with VAL peak. So, various gradient programs were tried with different proportions of buffer and organic phases. From which, satisfactory results were achieved with the optimized chromatographic conditions including Accucore XL C8 (100 mm × 4.6 mm; 3 μm) column as a stationary phase and a mixture of THF: 0.1% (v/v) perchloric acid in water (8:92, %v/v) as a mobile phase A and a mixture of THF, water and acetonitrile (5:15:80, v/v/v) as mobile phase B. The equilibration flow rate was 0.6 ml/minute with the linear gradient programme as, time/mobile phase-B (%): 0.0/25, 3.0/25, 12.0/35, 17.0/80, 19.0/25, and 21.0/25. The injection volume was kept 2 μl and column oven temperature was maintained at 30°C. The use of this optimized method, resulted in elution of VAL and SAC at about 14.5 and 15.2 minutes, respectively. The representative chromatogram is shown in Figure 1.
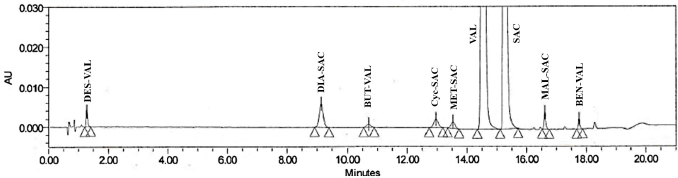 | Figure 1. UHPLC Chromatogram of SAC/VAL and their process related impurities in optimized chromatographic conditions. [Click here to view] |
System suitability
In order to verify the system performance, system suitability was evaluated. Six replicated injections of the system suitability solution were injected in the UHPLC system and the parameters, such as resolution, tailing factor, theoretical plates, and peak area were measured. The results of the system suitability study are given in Table 2, which suggested that all the parameters were within the specified acceptance criteria.
Analytical method validation
Analytical method validation was performed to prove the reliability and consistency of the results within the scope of its intended use. The parameters including precision, accuracy, linearity, LOD, LOQ, specificity, and robustness were evaluated as per ICH Q2 guideline. The results of method validation are summarized in Table 3.
Limit of Detection (LOD) and Limit of Quantification (LOQ)
The LOD and LOQ of SAC/VAL and their impurities were estimated at the measurable response at the signal-to-noise ratio 3:1 and 10:1, respectively. The found LOD and LOQ values for the SAC, VAL and their impurities are presented in Table 3. The results suggested that the developed UHPLC method was sensitive for the detection and quantification for SAC, VAL, and their related impurities.
Linearity
The linearity of the method was demonstrated using a series of seven concentrations in the range of LOQ to 150% for each impurity. The calculated linear regression equations and determination coefficients (r2) are given in Table 3. The determination coefficients (r2) were found not less than 0.990 over the working range for all impurities.
The linearity for assay method was established in the range from 50% to 150% for SAC and VAL. The calculated linear regression equations for SAC was found to be y = 1,3371x + 68.619, whereas for VAL it was found to be y = 12,586x − 32.921. The determination coefficients (r2) were found to be greater than 0.995 over the working range for SAC and VAL.
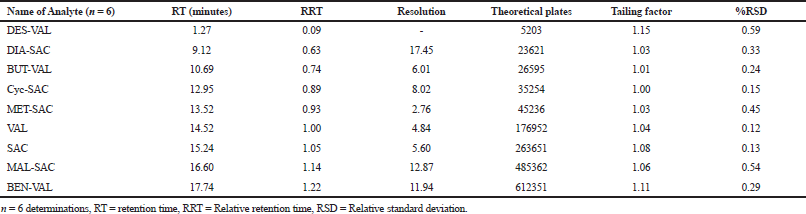 | Table 2. System suitability parameters. [Click here to view] |
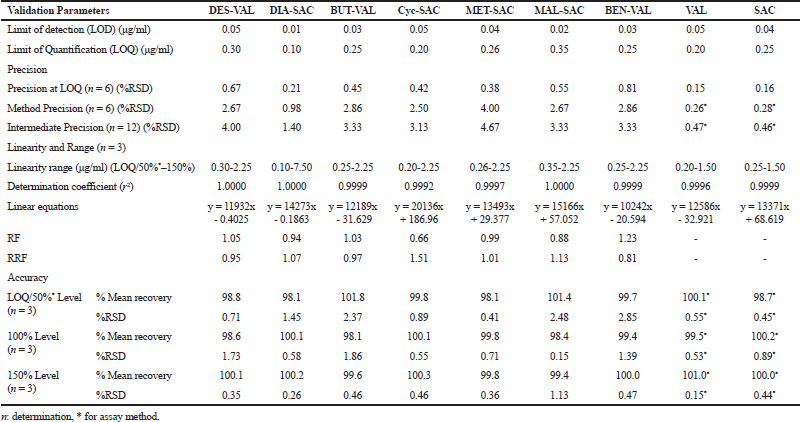 | Table 3. Validation data report. [Click here to view] |
The results of the linearity study for related impurity method and assay method exhibited an excellent correlation between proportional concentration (μg/ml) of analytes and their peak areas and both methods were linear in the given range.
Accuracy
The accuracy of the related impurity method was performed by spiking each impurity into SAC/VAL solution at LOQ, 100% and 150% level. The calculated % recovery are given in Table 3, which were within the acceptance criteria of 80% to 120%. The accuracy of the assay method was determined at 50%, 100%, and 150% level. The %recovery for both the drugs were found in the range of 98.7 to 101.0, which were within the acceptance criteria of 98% to 102%. The results of the accuracy study showed that the method was accurate.
Precision
The repeatability and intermediate precision of the related impurities were evaluated using the six replicate injections of the impurity solutions spiked in the SAC/VAL solution. The %RSD for each impurity such as DES-VAL, BUT-VAL, BEN-VAL, DIA-SAC, Cyc-SAC, MET-SAC, and MAL-SAC were up to 4.00% and 4.67%, respectively, for repeatability and intermediate precision. The obtained results were within the specified criteria. The precision of the assay method showed %RSD of SAC and VAL were within the acceptance limit of 2%. The results suggested that the method was precise as per ICH guideline.
Specificity
All peaks corresponding to SAC, VAL, and their impurities were separated from the blank peaks. Peak purity of each peak was measured using a PDA detector. Each peak was found to be pure, homogenous and their purity angle was less than the purity threshold. It suggested that there was no interference from the blank in the method and the method was able to detect/quantify the drugs in the presence of their impurities.
Considerable degradation of SAC/VAL was observed after acidic, alkaline, oxidative, and neutral hydrolytic stress conditions. The major degradation products generated during stress degradation study are summarized in Table 4.
In acidic, alkaline, and neutral hydrolytic conditions, two known impurities, i.e., DIA-SAC and Cyc-SAC were generated as major degradation products. In acidic condition, one additional known impurity DES-VAL was generated as a minor degradation product along with one unknown degradation product generated at RRT 1.19 (Fig. 2a), whereas in alkaline condition, no significant unknown degradation products were observed (Fig. 2b). In neutral hydrolytic condition, one unknown degradation product was observed at RRT 1.19 (Fig. 2c).
Under the influence of the oxidative stress condition, two known impurities, i.e., DIA-SAC and Cyc-SAC were formed as degradation products along with two major unknown degradation products formed at RRT 0.79 and 1.05 (Fig. 2d). From the results, it was suggested that DIA-SAC and Cyc-SAC were common impurities formed as degradation products under hydrolytic and oxidative stress conditions.
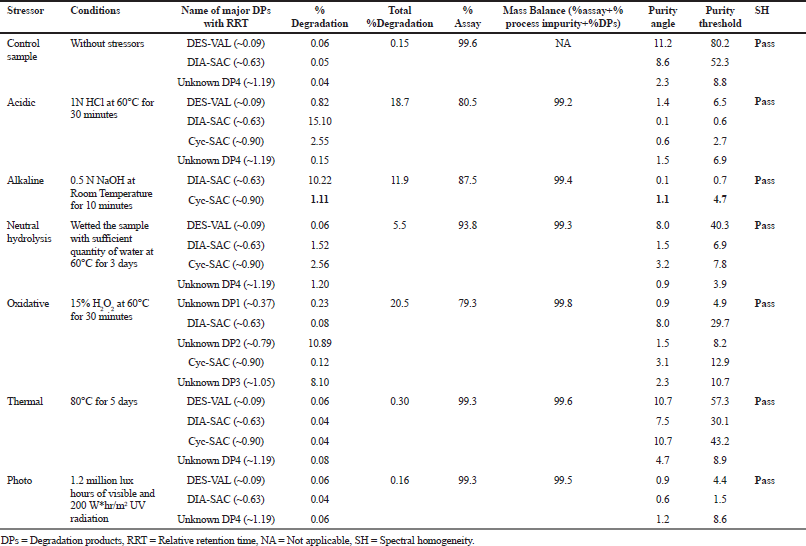 | Table 4. Stress degradation report. [Click here to view] |
The drug was found to be stable under thermal and photolytic conditions as there were no additional peaks observed.
The peak purity of the stress degraded samples were evaluated using a PDA detector and peak purity angle was found less than the purity threshold indicating satisfactory purity of the peaks. Each peak was well separated from each other and from blank, which exhibited stability indicating power of the developed UHPLC method. The percentage assay of each stress sample (at 200 μg/ml) was evaluated against a qualified standard and the mass balance was calculated. The results are given in Table 4. The mass balance of SAC/VAL is summarized in Table 4, which was found to be within the specified limits.
Robustness
The robustness study of UHPLC method was established by making deliberate minor variations in the chromatographic parameters as mentioned in the experimental section. The effect of the change in the chromatographic parameters on the resolution, theoretical plates, and asymmetry was observed. The resolution data are given in Table 5. The results showed that the resolution, theoretical plates, and asymmetry for SAC, VAL, and their impurities were within acceptance criteria. The %RSD calculated for the obtained results between nominal and deliberately changed parameters were within acceptance criteria, which demonstrated that the developed UHPLC method was robust and reliable within the given range.
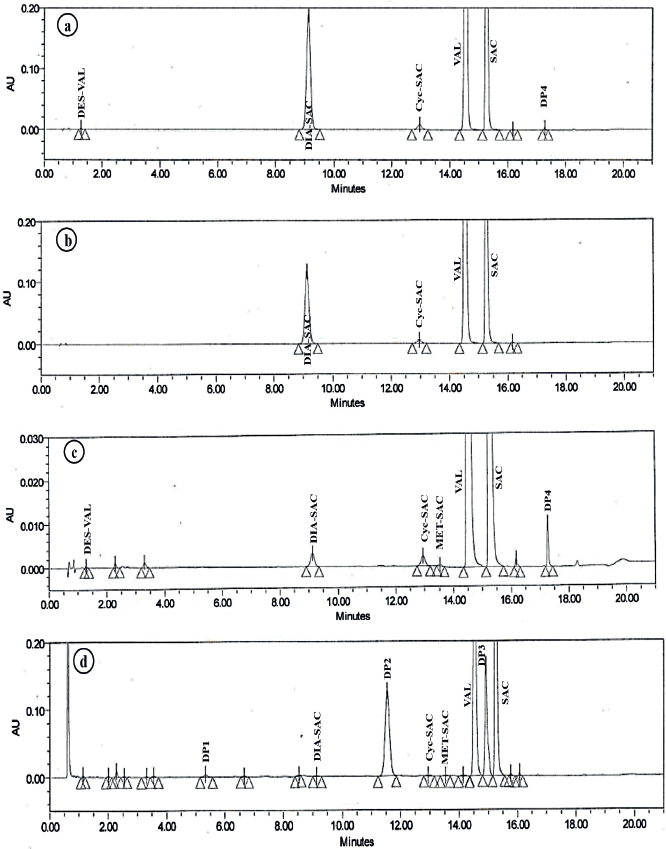 | Figure 2. UHPLC chromatograms for a) Acidic degradation b) Alkali degradation c) Neutral hydrolytic degradation and d) Oxidative degradation of SAC/VAL. [Click here to view] |
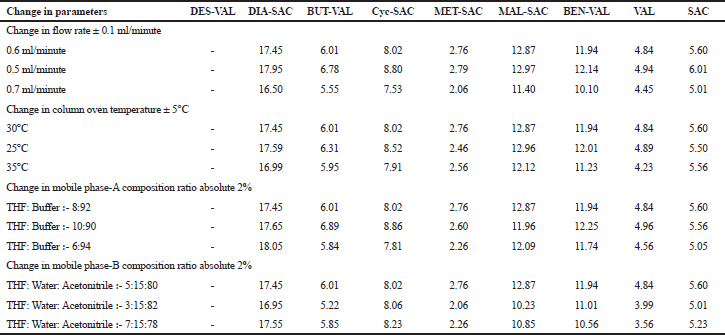 | Table 5. Resolution data report of robustness study. [Click here to view] |
CONCLUSION
A rapid and economical UHPLC method was developed for the estimation of SAC, VAL, and their related impurities. The method was validated as per ICH Q2 R2 guideline and the results showed the ability of the method to produce precise, accurate, linear, specific, sensitive, and robust results within the validated range. The stability indicating potential of the method was confirmed using a forced degradation study. The SAC/VAL complex was labile to acidic, alkaline, and neutral hydrolytic conditions as well as oxidative stress conditions, whereas it was stable to thermal and photolytic stress conditions. The developed method can be useful for analytical scientists to ensure the quality and stability of active pharmaceutical ingredients and finished products.
ACKNOWLEDGMENTS
The authors would like to thank Nirma University, Ahmedabad, Gujarat, India for providing necessary facilities to generate the manuscript which is a part of Doctor of Philosophy (PhD) Research work of Mr Pintu Prajapati, to be submitted to Nirma University, Ahmedabad, India.
CONFLICT OF INTEREST
The authors declare that they have no conflict of interest.
ETHICAL APPROVALS
This article does not contain any studies with human participants or animals performed by any of the authors.
REFERENCES
Attimarad M, Nagaraja SH, Nair AB, Aldhubaib BE, Katharigatta VN. Development of validated RP HPLC method with fluorescence detection for simultaneous quantification of sacubitril and valsartan from rat plasma. J Liq Chromatogr Relat Technol, 2018; 41(5):246–52. doi:10.1080/10826076.2018.1436070 CrossRef
Bianchini RM, Castellano PM, Kaufman TS. Characterization of two new potential impurities of Valsartan obtained under photodegradation stress condition. J Pharm Biomed Anal, 2011; 56(1):16–22. doi:10.1016/j.jpba.2011.04.017 CrossRef
Cada DJ, Baker DE, Leonard J. Sacubitril/Valsartan. Hosp Pharm, 2015; 50(11):1025–36. Available via https://www.ncbi.nlm.nih.gov/pubmed/27621510 CrossRef
Dargad RR, Prajapati MR, Dargad RR, Parekh JD. Sacubitril / valsartan : a novel angiotensin receptor-neprilysin inhibitor. Indian Heart J, 2018; 70:S102–10. doi:10.1016/j.ihj.2018.01.002 CrossRef
Eissa MS, Abou AM, Alamein A. Innovative spectrophotometric methods for simultaneous estimation of the novel two-drug combination : Sacubitril / Valsartan through two manipulation approaches and a comparative statist. Spectrochim Acta Part A Mol Biomol Spectrosc, 2018; 193:365–74. doi:10.1016/j.saa.2017.12.050 CrossRef
Fala L. Entresto (Sacubitril/Valsartan): first-in-class angiotensin receptor neprilysin inhibitor FDA approved for patients with heart failure. Am Heal Drug Benefits, 2015; 8(6):330–4. Available via https://www.ncbi.nlm.nih.gov/pubmed/26557227
Francotte E, Davatz A, Richert P. Development and validation of chiral high-performance liquid chromatographic methods for the quantitation of valsartan and of the tosylate of valinebenzyl ester. J Chromatogr B, 1996; 686:77–83. CrossRef
Grace D, Parambi T, Mathew M, Ganesan V. A validated stability indicating HPLC method for the determination of Valsartan in tablet dosage forms. J Appl Pharm Sci, 2011; 01(04):97–9.
Haranadha R, Chunduri B, Sankar G. Development and validation of a reliable and rapid LC-MS /MS method for simultaneous quantification of sacubitril and valsartan in rat plasma and its application to a pharmacokinetic study. Biomed Chromatogr, 2016; 30(9):1467–75. CrossRef
Iborra-egea O, Gálvez-montón C, Roura S, Perea-gil I, Prat-vidal C, Soler-botija C. Mechanisms of action of sacubitril / valsartan on cardiac remodeling : a systems biology approach. npj Syst Biol Appl, 2017; (March):1–8. doi:10.1038/s41540-017-0013-4 CrossRef
Jhund PS, Mcmurray JJ V. The neprilysin pathway in heart failure : a review and guide on the use of sacubitril / valsartan. Heart, 2016; 102(17):1342–7. CrossRef
Li, Ye; Zhao, Zhigang; Chen, Xu; Wang, Jingtian; Xiao F. HPLC Determination of Valsartan in Human Plasma. Chinese J Pharm Anal, 2000; 20(6):404–5.
Macek J, J.Klima, Ptacek P. Rapid determination of valsartan in human plasma by protein precipitation and high-performance liquid chromatography. J Chromatogr B, 2006;832:169–72. CrossRef
Mahmoud A. Validated Eco-Friendly Chromatographic Methods for Simultaneous Determination of Sacubitril and Valsartan in Spiked Human Plasma and in Pharmaceutical Formulation. J Appl Pharm Sci. 2018;8(2):11–17
Moussa BA, Hashem HMA, Mahrouse MA, Mahmoud ST. Experimental Design Approach in HPLC Method Development : Application for the Simultaneous Determination of Sacubitril and Valsartan in Presence of Their Impurities and Investigation of Degradation Kinetics. Chromatographia. 2018;81(1):139–156. CrossRef
Nie J, Xiang B, Feng Y, Wang D. Isolation and identification of process impurities in crude Valsartan by HPLC, mass spectrometry, and nuclear magnetic resonance spectroscopy. J Liq Chromatogr Relat Technol, 2006; 29:553–68. CrossRef
Pires SA, Mota LM, Garcia JS, et al. LC-MS characterization of valsartan degradation products and comparison with LC-PDA. Brazilian J Pharm Sci, 2015; 51(4):839–45. CrossRef
Ragab MAA, Galal SM, Korany MA, Ahmed AR. High performance thin-layer and high performance liquid chromatography coupled with photodiode array and fl uorescence detectors for analysis of valsartan and sacubitril in their supramolecular complex with quantitation of sacubitril-related substance in. J Chromatographic Sci, 2018; 56(6):1–12. CrossRef
Ran K, Ngocvan L, Nguyen T, et al. Determination of the R-enantiomer of valsartan in pharmaceutical formulation by capillary electrophoresis. Arch Pharm Res, 2015; 38(8):826–33. CrossRef
Riegger AJ. ACE inhibitors in congestive heart failure. Cardiology, 1989; 76(2):42–9. CrossRef
Sampath A, Reddy AR, Yakambaram B, et al. Identification and characterization of potential impurities of valsartan , AT1 receptor antagonist. J Pharm Biomed Anal, 2009; 50:405–12. CrossRef
Savarese G, Lund LH. Global Public Health Burden of Heart Failure. Card Fail Rev, 2017; 3(1):7–11. Available via https://www.ncbi.nlm.nih.gov/pubmed/28785469
Tatar S, Sag S. Comparison of UV- and second derivative-spectrophotometric and LC methods for the determination of valsartan in pharmaceutical formulation. J Pharm Anal, 2002; 30:371–5. CrossRef
United States Pharmacopeia and National Formulary (USP 35-NF 30). United States Pharmacopeia Convention, Rockville, MD, 2012.
Zhou L, Zou L, Sun L, Zhang H, Hui W, Zou Q. A liquid chromatographic method for separation of sacubitril–valsartan and their stereoisomeric impurities. Anal Methods, 2018; 10(9):1046–53. CrossRef