INTRODUCTION
Alogliptin (Fig. 1) decreases the incretin glucose dependent insulinotropic polypeptide (GIP) and glucagon like peptide (GLP-2) (Cabrera et al., 2013) increases the plasma incretin concentration, which can controls the glucose levels in the blood (Marino and Cole, 2015). GIP and GLP-2 are stimulating the glucose dependent pancreatic beta cells. It inhibits the activity of GIP and GLP-2 (Cyrus and Vijay, 2010).
Pioglitazone (Fig. 2) is a thiazolidine class of anti-diabetic drug (Brunetti et al., 2010). It is an agonist of peroxisome proliferator activated receptor gamma and it activates the insulin responsive genes then increase the production insulin (Al-Majed et al., 2016; Lincoff et al., 2007).
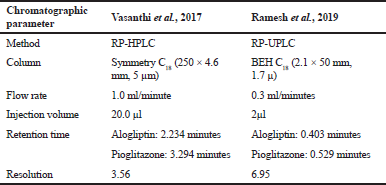
On extensive survey of literature, very few reverse phased high-performance chromatography (RP-HPLC) methods have been reported for the estimation of alogliptin and pioglitazone combined dosage form (Vasanthi et al., 2017). The present developed reversed-phase ultra-performance liquid chromatography (RP-UPLC) method was accurate, precise, and robust for the simultaneous estimation of alogliptin and pioglitazone in Active Pharmaceutical Ingredient and tablet dosage form. The developed RP-UPLC method showed better resolution and low retention time, very good separation efficiency, and faster elution and tiny amount of sample consumed when compared to the (Vasanthi et al., 2017) reported RP-HPLC methods.
MATERIALS AND METHODS
Instruments used
The liquid chromatographic system was made up of Waters-Acquity, Japan, UPLC equipped with auto sampler and 2996 PDA detector with Empower 2 software. Chromatographic separation was performed on waters BEH C18 (2.1 × 50 mm, 1.7 μ) column.
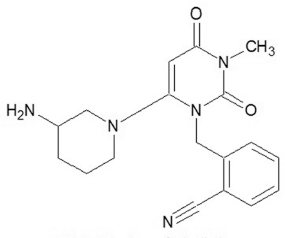 | Figure 1. Structure of alogliptin. [Click here to view] |
 | Figure 2. Structure of pioglitazone. [Click here to view] |
Chemicals used
Gift samples of alogliptin and pioglitazone are procured from Pharma Train, Hyderabad, India. HPLC grade water and methanol are purchased from Merck Laboratories, Mumbai, India. Potassium dihydrogen phosphate (K2H2PO4) was obtained from Finar Chemicals Pvt. Limited, Ahmedabad, Gujarat, India.
Chromatographic conditions
Column: Waters BEH C18 (2.1 mm*50 mm, 1.7 μ)
Mobile phase ratio: Phosphate buffer (pH 3):Methanol (45:55)
Wavelength: 280 nm
Flow rate: 0.3 ml/minute
Injection volume: 2 μl
Run time: 3 minute
Preparation of mobile phase
450 ml (45%) of phosphate Buffer and 550 ml (55%) of Methanol was taken and ultra sonicated for 10–15 minutes for degassing, further filtered. pH was adjusted to 3 with orthophosphoric acid (Raval and Srinivasa, 2014).
Preparation of standard
12.5 mg of alogliptin and 30 mg of pioglitazone was taken in 100-ml volumetric flask then 70 ml of diluent was added and dissolved completely, the volume was made up to the mark (Stock solution). 1.5 ml of stock solution was pipette out into 10ml volumetric flask and the volume was made up to the mark with diluent (Neelima et al., 2014).
Validation of analytical method
The developed RP-UPLC method was validated for System suitability, Specificity, Linearity, Accuracy, Precision, Robustness, and stability studies. The validation in accordance with ICH guidelines Q2(R1).
System suitability
It was performed before each validation to check the retention time, theoretical plates, tailing factor, and resolution determined to five suitability injections (Manzoor et al., 2015).
Specificity
It was carried out to determine the analyte in the presence of other compounds, such as impurities, degradants, and matrix. In specificity study standard injection was compared to the running blank injection.
Linearity
From the standard stock solution, appropriate aliquots of alogliptin and pioglitazone were taken in different volumetric flask and make up the volume up to the mark with diluent to obtain different concentrations are 6.25, 12.5, 18.75, 25, 31.25, and 37.5 μg/ml for alogliptin and 15, 30, 45, 60, 75, and 90 μg/ml for pioglitazone, respectively (Haribabu et al., 2017). The solutions are injected into 2 μl fixed loop system and then chromatograms were recorded. The calibration curve was plotted by concentration Vs Peak area.
Precision
Both intraday and inter day was carried out for six injections in the day and between the days.
Accuracy
Recovery was obtained by adding known quantities of pure standard in three different concentrations 50%, 100%, and 150% to the pre-analyzed sample formulation. The amount of drug found, amount of drug recovered, and percentage recovery were calculated for the confirmation of the method accuracy (Komal and Amrita, 2015).
Robustness
It is an analytical procedure to measure the capacity to remain unaffected by small variations in the method parameter. Some typical variations impacts on method were flow rate, temperature, pH of mobile phase, and mobile phase composition.
As part of the Robustness, deliberate change in the Flow rate, Mobile Phase composition, Temperature Variation were made to evaluate the impact on the method. From the Standard solution, 18.75 ppm of alogliptin and 45 ppm of pioglitazone was prepared and analyzed using the varied flow rate and wave length change along with actual conditions.
Forced degradation studies
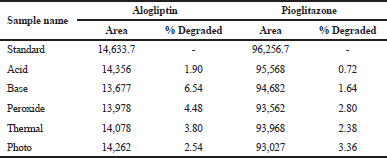
1.5 ml from the stock solution was taken in 5 different 10ml volumetric flasks. The required aliquots are prepared and the solutions are exposed to the stress conditions, such as acidic, alkaline, peroxide, thermal, and photolytic conditions (Mokhtar et al., 2016). Then, finally the amount of drug degraded in stress conditions was calculated. The data were shown in Table 10.
RESULTS AND DISCUSSION
System suitability
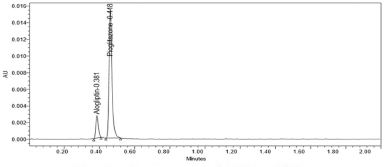
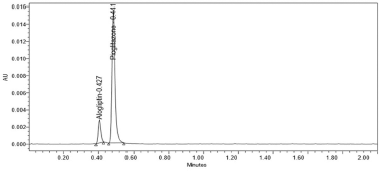
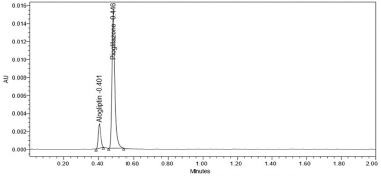
The retention time of alogliptin was 0.403 minutes and pioglitazone was 0.529 minutes. Three system suitability injections were injected into the chromatographic column. Then, the tailing factor, theoretical plates and resolution was calculated. The results are shown in Table 1 and the values were found to be within the limit.
Specificity
Comparing the results of standard solution along with running blank solution, there was no interference in blank.
Linearity
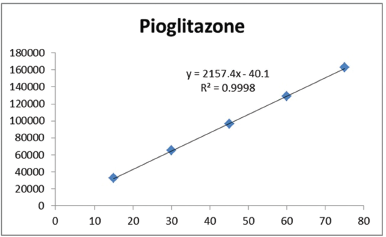
For the determining the linearity, plot the graph peak versus concentration and calculate the correlation coefficient. The correlation coefficient and regression equation of alogliptin (Fig. 4) was found to be Y = 797.9x – 228.7 (r2 = 0.9997) and pioglitazone (Fig. 5) was found to be Y = 2157.4x − 40.1 (r2 = 0.9998). The results are shown in Table 2 and Figure 3.
Accuracy
The mean percentage recovery of alogliptin was 100.34% and pioglitazone was 100.30%. It was present within the limit, hence the method was accurate and it is shown in Tables 3 and 4.
Precision
It was carried out in intraday and intermediate day for the % Relative Standard Deviation (RSD) calculation. The results were found to be under accepted criteria, i.e., 2%. It is shown in Tables 5 and 6.
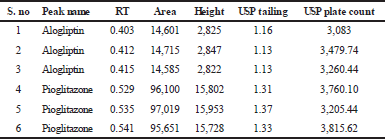 | Table 1. System suitability parameters for alogliptin and pioglitazone. [Click here to view] |
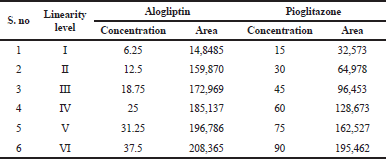 | Table 2. Linearity results. [Click here to view] |
LOD and LOQ
The Limit of Detection (LOD) of alogaliptin and pioglitazone found to be 2.91 and 2.96 μg/ml. The Limit of Quantification (LOQ) of alogliptin was 10.4 and 10.09 μg/ml for pioglitazone, respectively. The results are shown in Table 7.
Robustness
The variation of flow rate and wavelength was found to be (+10%), which was affected by the method. The standard solutions were injected under the selected robust conditions. The system suitability parameters, such as theoretical plates, tailing factor and resolution was observed and measured. Results shows >2000 theoretical plate count, < 2 of tailing factor and resolution was found to be > 2 (See Tables 8 and 9). Hence the method was robust and the results were shown in Figures 6 to 9.
Forced degradation studies
The working standards of alogliptin and pioglitazone were placed in different stress conditions, such as acid, base, thermal, peroxide, and photolytic conditions, and then observe the amount of drug degraded in above stress conditions.The results of degradation study of standard solutions were stable in all the selected stress conditions and there is no observe the much deviation. The results obtained were compared with existing methods and found to be stable in all stress conditions, but existing methods were stable in thermal and photolytic conditions only. The data are shown in Table 10.
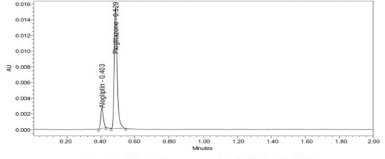 | Figure 3. Optimized chromatogram for alogliptin and pioglitazone. [Click here to view] |
.png) | Figure 4. Linearity graph of alogliptin. [Click here to view] |
 | Table 3. The accuracy results for alogliptin. [Click here to view] |
 | Table 4. The accuracy results for pioglitazone. [Click here to view] |
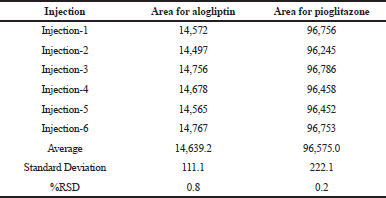 | Table 5. Results for intraday precision. [Click here to view] |
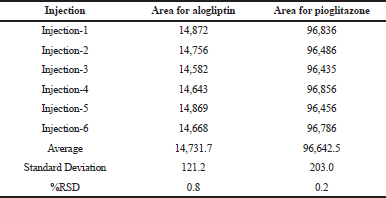 | Table 6. Results for intermediate precision. [Click here to view] |
 | Table 7. Results for LOD and LOQ. [Click here to view] |


.png)
