
INTRODUCTION
The International Diabetes Federation (IDF) reported about 382 million patients affected by diabetes around the world, and this number will rise to 592 million by 2035 (Guariguata et al., 2014). Type 2 diabetes is a chronic and progressive disease, characterized by resistance to insulin and malfunction of b-cell (Meier, 2008; Kaneto et al., 2010; Robertson et al., 2004). The enzyme dipeptidyl peptidase-4 (DPP-4) widely distributed in living cell and blood circulation and could inactivate an insulin tropic endogenous hormone glucagon-like peptide-1 (GLP-1), playing an important role in glucose metabolism (Drucker, 1998; Nauck, 1999; Wang et al., 1995; Kieffer et al., 1995; Deacon et al., 1995). The review of the literature revealed a few methods reported for determination of alogliptin benzoate. These include UV spectrophotometric (Moritoh et al., 2009), HPTLC (Yadav et al., 2014), HPLC methods (Sharma and Parle, 2015; El-Bagary et al., 2012; Zhang et al., 2015; Deng et al., 2015) and chiral HPLC method (Yadav et al., 2014). Hence it is essential to develop more sensitive analytical methods to determine the concentration of alogliptin from plasma samples. To best of our knowledge, no published LC-MS/MS-based methods for the pharmacokinetic study of alogliptin in healthy rabbits. Therefore an LC-MS/MS method was developed, validated and applied for quantification of Alogliptin in rabbit plasma employing liquid-liquid extraction (LLE) technique. The LLOQ of the method was found to be low for conducting a pharmacokinetic study with any marketing formulation of alogliptin in human volunteers.
EXPERIMENT
Apparatus and software
The LC-MS/MS used for the study consist of Shimadzu LC-20ADvp (Shimadzu, Japan) coupled with Applied Biosystem sampler Sciex (MDS Sciex, Canada) API 4000 Tandem mass spectrometer and the autosampler was SIL-HTC from Shimadzu, Japan. The system was operated by Analyst software (version: 1.4.2; Applied Biosystems).
Chemicals and reagents
Alogliptin and Alogliptin D3 (IS) were procured by Hetero Drugs Ltd., Hyderabad, India, formic acid was purchased from Merck Specialities Pvt. Ltd, Mumbai, India. The water for chromatography was produced from water purification systems (Milli Q, Milli Pore, USA) installed in the laboratory. The HPLC grade methanol and acetonitrile were supplied by Baker, USA. Hyderabad. The rabbit plasma was prepared by freeze centrifugation. The study was approved by Institutional Ethical committee no: VCP/IAEC/2016-44.
Calibration standard solutions
Stock solutions (1 mg/ml) of Alogliptin and Alogliptin D3 internal standard (IS) were prepared in methanol further the eight calibration standards were prepared from stock by diluting with 70% methanol subsequently they are spiked with drug free plasma to give the concentrations of 4.00, 8.00, 25.00, 50.0, 100.0, 150, 300, and 600 ng/ml.
Quality control standards
Lowest quality control (LQC), median quality control (MQC) and highest quality control (HQC) standards were prepared from stock by spiking drug-free plasma with Alogliptin to give a solution containing 8, 250, and 500 ng/ml respectively. They were stored at −20°C till the time analyzed.
Chromatographic conditions
Chromatographic separation was achieved on Inertsil ODS-C18 (50 × 4,6 mm, 5 μm) with 0.1% formic acid-acetonitrile-methanol (30: 56: 14 v/v). as an isocratic mobile phase with a flow rate of 1.0 ml/min. Injection volume was 5 μl. The total chromatographic run time was fixed to 2.00 minutes and column oven and autosampler temperature was set to 40°C and 5°C, respectively.
Mass spectrometric conditions
The LC eluent was split (75%), and approximately 0.25 ml/min was introduced into LC and the Quantitation was achieved through negative ion mode by employing turbo ion spray interface at 400°C. The 5500 V voltage for ion spray and the pressure 8, 10 and 6 psi for a nebulizer, the curtain was set at 5500 V. The source parameters viz., the nebulizer, curtain and CAD gas were set at 8, 10, and 6 psi, respectively. The compound parameters viz. the declustering potential (DP), collision energy (CE), entrance potential (EP) and collision cell exit potential (CXP) for alogliptin and alogliptin-D3 were similar and are set at 18, 10, 10, and 10 V. The multiple-reaction monitoring mode (MRM) was employed for detecting and monitoring the transition pairs of m/z 340.2 → 116.0 for alogliptin, and m/z 343.3 → 196.2 for IS.
Study design
Six male albino Rabbits (weighing about 2.5 kg) were selected as the animal model. The age of the rabbits was 8–12 weeks. The rabbits selected for the study had no medication for two weeks prior to the study. Twelve hours before drug administration, food was withdrawn from the rabbits until 24 hr post-dosing, while, water was available for rabbits throughout the study. The tablet with the dose of 0.59 mg based on the animal surface area was administered to rabbits using a balling gun. The study was approved by Institutional Ethical committee no: P50/VCP/IAEC/2016/09/DBP/AE12/Rabbits. Blood samples (0.6 ml) were withdrawn from the marginal ear vein before dosing (zero time) and at time intervals of 0.5, 1, 1.5, 2, 2.5, 3, 4, 5, 6, 8, 12, 16, 24, 36, and 48 hours after administration. For each animal, the total number of blood samples drawn during the study was 16. EDTA disodium salt was used as an anticoagulant. Plasma was separated by centrifugation at 5000 rpm for 10 min and the resulting plasma sample from each blood sample was divided into two aliquots and stored in suitably labeled polypropylene tubes at −20°C until used. All the plasma samples were analyzed under the construction of standard calibration curve of alogliptin in rabbit’s plasma. The alogliptin concentrations in the rabbit plasma samples was calculated using the calibration curve, obtained after linear regression of the peak area ratio (alogliptin/alogliptin-D3) versus the concentration of alogliptin.
Sample preparation method
The samples were prepared by mixing 50 μl of alogliptin D3 (50 ng/ml) and 100 μl buffer (0.05 M NaOH, pH: 4) to 250 μl of plasma. The drug was extracted by employing LLE method using 2.5 ml of ethyl acetate followed by centrifugation at 2000 rpm/min for 15 min at 4°C. The supernatant was withdrawn and dried using lyophilizer. The residue was reconstituted with 300 μl of the mobile phase.
Pharmacokinetic analysis
The pharmacokinetic parameters for single oral dose non-compartmental study were calculated through PK Solver tool. The Cmax (maximum plasma concentration) and Tmax (time to maximum plasma concentration) were obtained directly from the plasma time profile curve. The linear trapezoidal rule was used to estimate all other pharmacokinetic parameters. i.e. AUC 0-t, AUC 0-∞, t1/2 and ke.
VALIDATION
Specificity
The specificity of the method was determined by injecting 4.0 ng/ml concentration under optimized chromatographic conditions to the LC system to show the separation of alogliptin from impurities and plasma. The specificity of the method was checked for the interference from plasma.
Linearity
The linearity of the method was determined by plotting eight-point calibration curves (4 ng/ml to 600 ng/ml) between actual and calculated concentrations of samples spiked with plasma.
Recovery studies
Two sets of six HQC, MQC, and LQC samples were prepared, one is with plasma and another one is with 70% methanol. The % mean recoveries were determined by measuring the responses of the plasma quality control samples against quality control samples prepared with 70% methanol.
Precision and accuracy
Intraday precision and accuracy was obtained by analyzing the quality control standards containing concentrations 8, 250, and 500 ng/ml and LLOQ Quality control standard containing concentration 4.00 ng/ml five times a day randomly, interday precision and accuracy was achieved by determining each quality control standards (8, 250, and 500 ng/ml) and LLOQ Quality Control standards (4.00 ng/mL) once on each of five different days.
Matrix effect
The matrix effect for the established method was determined by using six lots of rabbit plasma and is used to prepare the concentrations equivalent to LQC and HQC of alogliptin the samples prepared were injected on to the column.
Stability studies
The stability of alogliptin was determined by measuring concentration change in control samples overtime under set conditions. Freeze-thaw stability study (−80°C) of alogliptin was carried out by subjecting samples to three freeze and thaw cycles. Samples before the study and after study were analyzed by developed method. Similarly stock solution stability study of alogliptin (Stability after 6 Hours), Long-term stability (−80°C, 30 days), benchtop stability study of alogliptin (at ambient temperature, 6 h), Dry residue stability (4°C, 48 h) and Auto-sample stability (4°C, 24 h) of alogliptin were carried out by subjecting samples to study conditions.
RESULTS & DISCUSSIONS
Results of method validation
The chromatograms obtained during method validation was acceptable and the representative chromatograms of standard blank, HQC, MQC, and LQC samples are shown in (Figures 1 to 4).
The linearity, accuracy & precision, and stability of the method were established as per ICH guidance (ICH guidelines Q1A(R2), 2005; ICH guidelines Q2(R1), 2005).
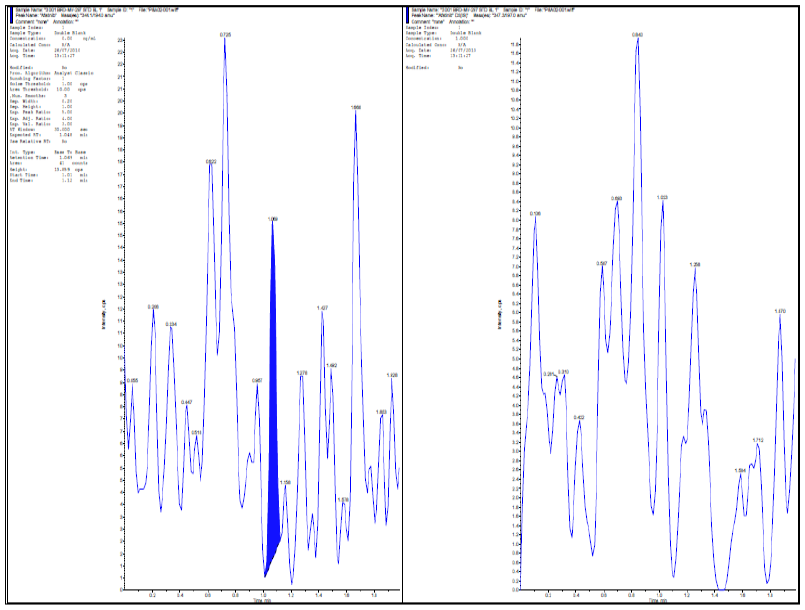 | Fig. 1: blank chromatograms of alogliptin and IS in blank Plasma. [Click here to view] |
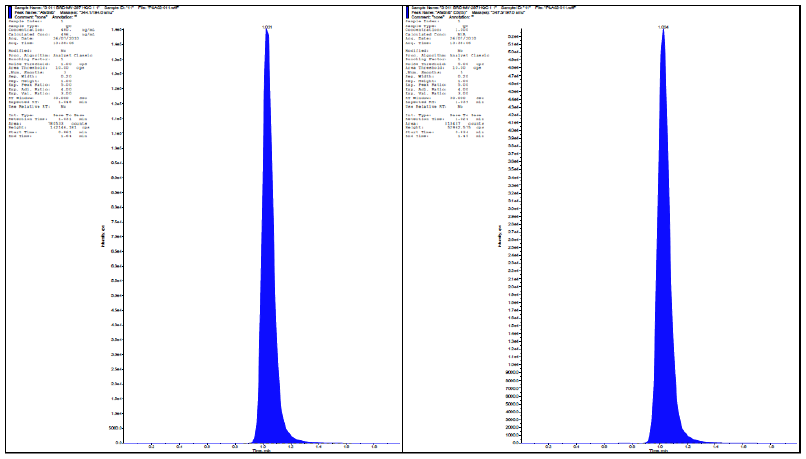 | Fig. 2: HQC-chromatograms of alogliptin in plasma with internal standard. [Click here to view] |
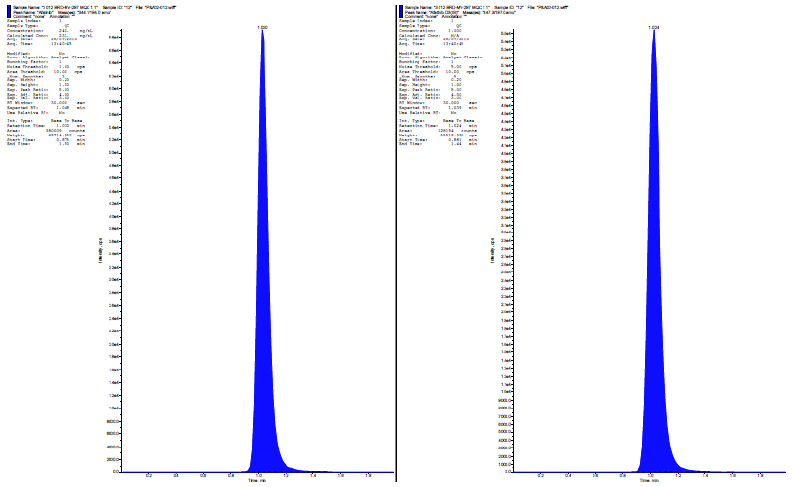 | Fig. 3: MQC-chromatograms of alogliptin & its internal standard. [Click here to view] |
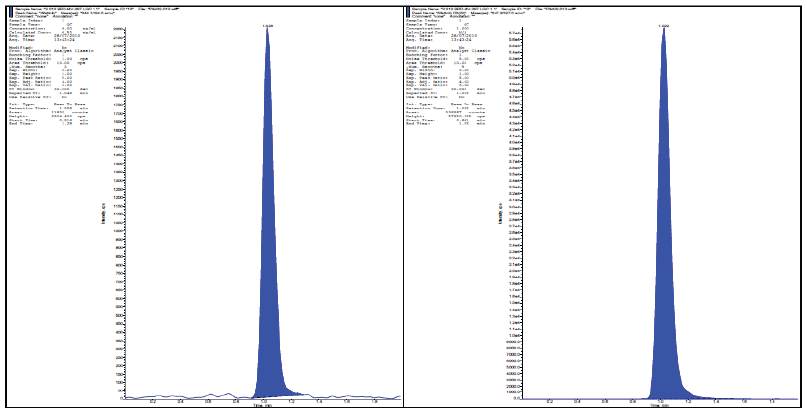 | Fig. 4: Chromatograms of alogliptin & its internal standard at LQC Level. [Click here to view] |
Linearity
The calibration curve (calculated concentrations Vs actual Concentration) obtained (n = 3) were linear over working range of 4 ng/ml to 600 ng/ml (Figure 5 and Table 1). The linear regression equation for the analysis was 0.994x-2.692 with coefficient of correction (r2) = 0.999.
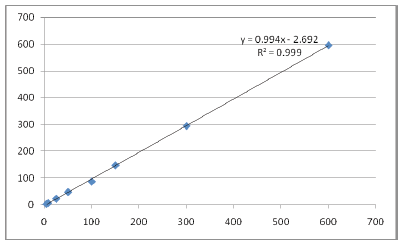 | Fig. 5: Calibration curve. [Click here to view] |
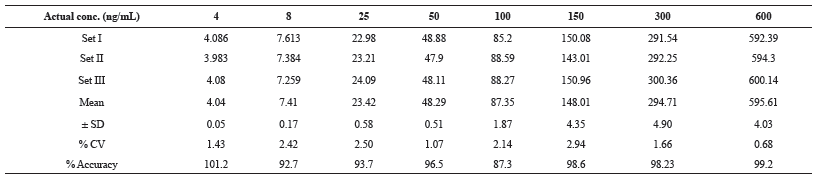 | Table 1: Summary of Linearity Standards for Alogliptin. [Click here to view] |
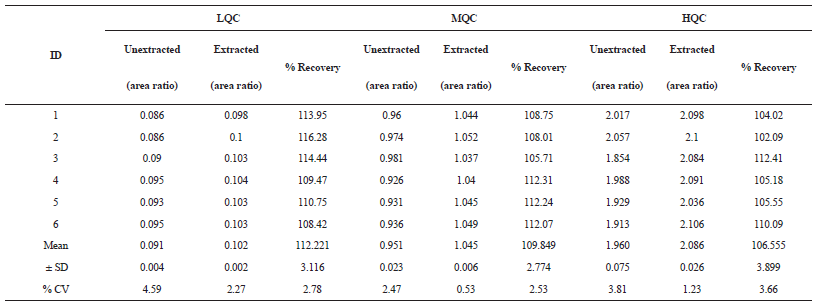 | Table 2: The % Mean Recovery of alogliptin for LQC, MQC, and HQC. [Click here to view] |
Recovery
The % mean recovery of the method for LQC(8 ng/ml), MQC (250 ng/ml) and HQC (500 ng/ml) was found to be 112.2%, 109% and 106% respectively (Table 2).
Intraday and Inter-day Precision
The mean intraday and inter-day precision of the method for alogliptin was found to be 1.26 to 4.97% (≤15%) for LQC, MQC, HQC, and LLOQC (Table 3).
.png) | Table 3: Intra-day and Inter-day quality control samples for alogliptin. [Click here to view] |
Matrix effect
After the analysis of HQC and LQC from six different plasma lots the % CV was observed 0.1% and 2.8% (≤15%) respectively (Table 4).
.png) | Table 4: Matrix effect obtained with six different lots of plasma. [Click here to view] |
Stability studies
The quality control samples (HQC and LQC) were used for stability studies. The % mean stability for HQC and LQC were presented in table 5 and are within the acceptance limits of 85 to 115%. (Table 5).
PHARMACOKINETIC STUDIES
The Pharmacokinetic parameter of alogliptin was calculated from the plasma concentration-time curves using pk solver software. Also, the area under the plasma concentration-time curve from 0 to 48 hr (AUC0-48) was calculated using trapezoidal rule. Alogliptin showed Tmax of 2.6 ± 0.37 and mean Cmax, AUC0-t and AUC0-α for Test formulation is 90.6 ± 4.41, 1675.41 ± 164 and 3726.47 ± 796 respectively The results were presented in Table 6, Table 7 and Figure 6.
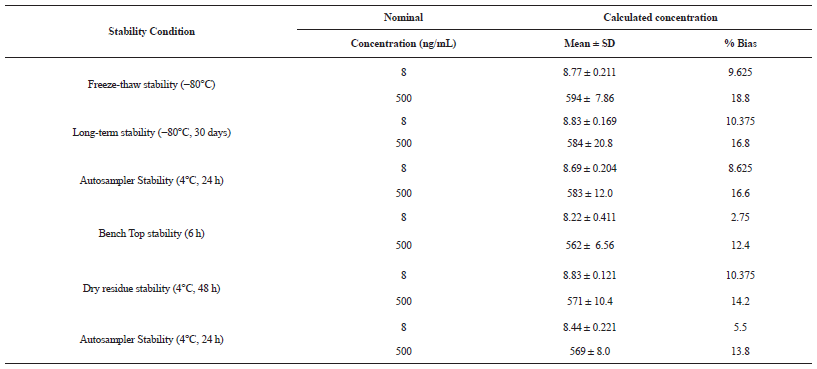 | Table 5: Results of stability studies. [Click here to view] |
.png) | Table 6: Calculated plasma concentrations in rabbits at each time point. [Click here to view] |
.png) | Fig. 6: Plasma concentration time profile of test animals. [Click here to view] |
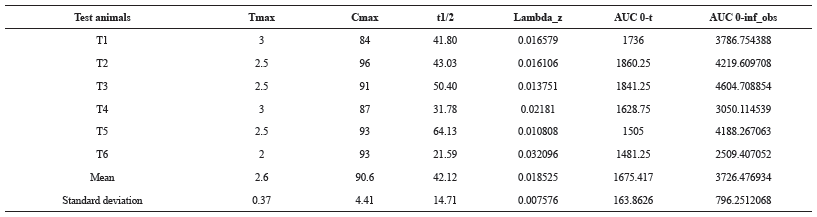 | Table 7: Calculated mean values of PK parameters for test animals. [Click here to view] |
CONCLUSION
The bio-analytical method developed for the determination of alogliptin is highly specific, rugged and rapid for assessing single dose or multiple dose pharmacokinetics and also for clinical trial samples with desired sensitivity, precision, accuracy and high throughput. The overall runtime is promising compared to other reported procedures for alogliptin. The established LLOQ is found to be low for conducting the pharmacokinetic studies of any marketing formulation of alogliptin in healthy rabbits.
REFERENCES
Guariguata L, Whiting DR, Hambleton I, Beagley J, Linnenkamp U, Shawet JE. Global estimates of diabetes prevalence for 2013 and projections for 2035. Diabetes Res Clin Pract, 2014;103(2):137-149. CrossRef
Meier JJ. Beta cell mass in diabetes: a realistic therapeutic target? Diabetologia, 2008;51(5):703-713. CrossRef
Kaneto H, Katakami N, Matsuhisa M, Taka-aki M. Role of reactive oxygen species in the progression of type 2 diabetes and atherosclerosis. Mediat Inflamm, 2010; 2010:1-12. CrossRef
Robertson RP, Harmon J, Tran POT. B-cell glucose toxicity, lipotoxicity, and chronic oxidative stress in type 2 diabetes. Diabetes, 2004; 53:119-24. CrossRef
Drucker DJ. Glucagon-like peptides. Diabetes,1998; 47:159-169. CrossRef
Nauck MA. Is glucagon-like peptide-1 an incretin hormone? Diabetologia, 1999; 42(3):373-379. CrossRef
Wang Y, Egan JM, Raygada M. Glucagon-like peptide-1 affects gene transcription and messenger ribonucleic acid stability of components of the insulin secretory system in RIN 1046-38 cells. Endocrinology, 1995; 136:4910-4917. CrossRef
Kieffer TJ, McIntosh CH, Pederson RA. Degradation of glucose-dependent insulinotropic polypeptide and truncated glucagon-like peptide 1 in vitro and in vivo by dipeptidyl peptidase IV. Endocrinology, 1995; 136(8):3585-3596. CrossRef
Deacon CF, Nauck MA, Toft-Nielsen M. Both subcutaneously and intravenously administered glucagonlike peptide I are rapidly degraded from the NH2-terminus in type II diabetic patients and in healthy subjects. Diabetes, 1995; 44(9):1126-1131. CrossRef
Moritoh Y, Takeuchi K, Asakawa T, Kataoka O, Odaka H. The dipeptidyl peptidase-4 inhibitor alogliptin in combination with pioglitazone improves glycemic control, lipid profiles, and increases pancreatic insulin content in ob/ob mice. Eur. J. Pharmacol, 2009; 602:448–54.. CrossRef
Sharma K and Parle A., Development and validation of HPTLC method for estimation of alogliptin benzoate in bulk drugs and tablet dosage forms. Int. Bull. Drug Res, 2015; 5: 81–89.
El-Bagary R, I Elkady E, F Ayoub BM., Liquid Chromatographic Determination of Alogliptin in Bulk and in its Pharmaceutical Preparation. Int. J. Biomed. Sci, 2012; 8: 215-218.
Zhang K, Ma P, Jing W, Zhang X, A developed HPLC method for the determination of Alogliptin Benzoate and its potential impurities in bulk drug and tablets. Asian J. Pharm. Sci, 2015; 10:152–158.
Deng J, Guo J, Dai R, Zhang G, Xie H., Determination of a novel dipeptidyl peptidase IV inhibitor in monkey plasma by HPLC-MS/MS and its application in a pharmacokinetics study. J. Pharm. Biomed. Anal, 2015; 117:99–103. CrossRef
Yadav J, Jadhav S, Mohite K., Development and validation of rp-hplc method for alogliptin benzoate in bulk drug and dosage form Int. J. Pharm. Pharm. Res, 2014; 1:1–9.
ICH guidelines for the stability of new drug substances and products. Q1A(R2) ICH, Geneva; 2005. p. 1-13.
ICH guidelines for validation of analytical procedures: text and methodology. Q2(R1) ICH, Geneva; 2005. p. 1-14.