
INTRODUCTION
Prostate cancer is a substantial health concern and the foremost cause of cancer-associated deaths among men globally. This disease primarily affects men between the ages of 45 and 60. The risk factors for prostate cancer include genetics, ethnicity, age, obesity, and various environmental influences [1,2]. Chemotherapy and novel hormone therapies are the most common therapies for prostate cancer [1]. Chemotherapy involves the use of chemotherapeutic agents such as docetaxel and works through nonhormonal mechanisms to inhibit the division and formation of new cancer cells. However, it also affects normal cells to some extent, leading to side effects for patients [3]. The most widely used treatment for prostate cancer, however, is novel hormone therapy, which involves the use of leuprolide and goserelin luteinizing hormone-releasing hormone (LHRH) agonists and degarelix and relugolix LHRH antagonists [4]. In addition to relugolix, all the currently available treatment options for prostate cancer are injectable dosage forms with some known serious side effects, including the risk of cardiac arrest. In contrast, globally, relugolix is the only approved nonpeptide gonadotropin-releasing hormone antagonist administered orally for prostate cancer, with fewer side effects. It rapidly suppresses testosterone, which makes it particularly effective for treating advanced and hormone-sensitive prostate cancer [5,6]. In 2019, relumina became the first approved brand name of relugolix in Japan to treat uterine fibroids, and recently, the European Commission in 2022 approved another brand, Orgovyx, of relugolix for advanced prostate cancer [7–9].
Relugolix is a derivative of N-phenyl urea [10] with three key related substances, i.e., amine, oxo, and carboxamide [11], and currently, none of the pharmacopoeias, including the British Pharmacopoeia, European Pharmacopoeia, Indian Pharmacopoeia, and the United States Pharmacopoeia provided a prescribed method for determining relugolix and its related substances. Moreover, there is a scarcity of published literature on the development and validation of high-performance liquid chromatography (HPLC) methods for relugolix. Unlike previous studies, which have limitations as outlined in Table 1, our research was specifically designed following the principles of the International Council for Harmonization of Technical Requirements for Pharmaceuticals for Human Use (ICH) Q14 guidelines, with the added use of design of experiments (DOE) software; an approach not previously employed in this area of study [10–15]. Additionally, we successfully separated and characterized relugolix-related substances, including amine, oxo, and carboxamide, which have not been investigated in prior literature as existing studies focus only on degradation products, not on drug-related substances, making our work the first to address this aspect comprehensively. Furthermore, unlike the existing studies we characterized the related substances using a wide range of both the conventional and modern techniques (IR, UV, HPLC, LC-MS, and nuclear magnetic resonance (NMR), which can be adopted by small- and large-scale industries as well as the academic research organizations [15,16].
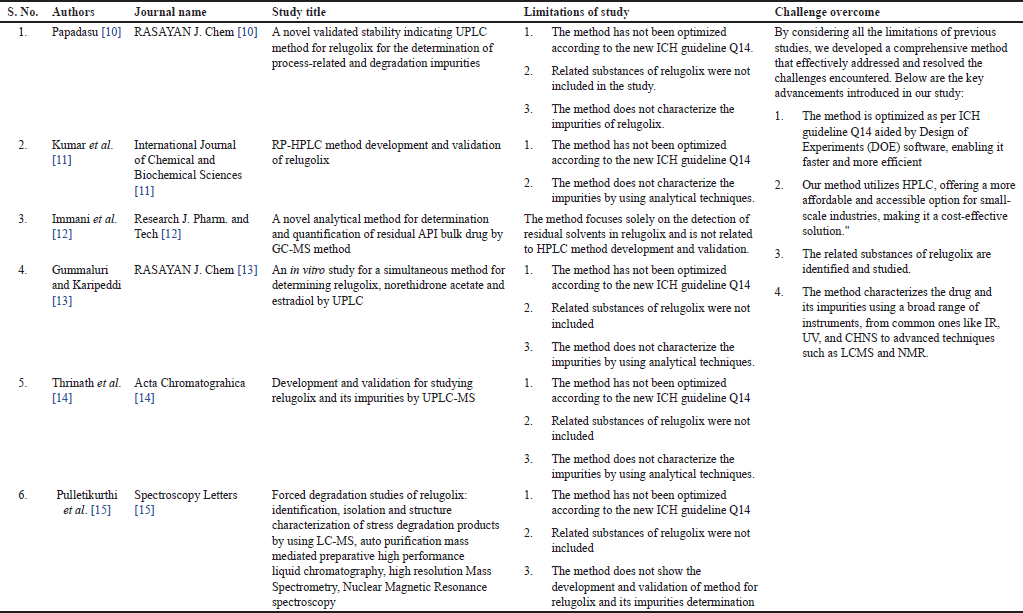 | Table 1. Existing studies of relugolix and their limitations. [Click here to view] |
The analytical quality by design (AQbD) process starts by defining the analytical target product profile, which confirms the desired quality. The second step focuses on identifying critical analytical attributes, and identification, peak separation, precision, accuracy and robustness, and critical method attributes (CMAs) are then determined to assess the performance of the analytical technique, considering factors such as mobile phase pH, injection volume, and column temperature. To pinpoint the central process and create a statistically significant design space, the DOE method was employed. Following this, method validation was performed to credibly verify the quality outcomes. Finally, a control strategy is implemented to ensure that the analytical technique consistently performs as expected [17]. The key steps in developing a method and the factors that may affect method development and validation based on AQbD are depicted in Figure 1a and 1b, respectively [18,19]. The chemical properties of relugolix and its related substances are presented in Table 2 [20–26]. A comprehensive methodology for determining relugolix content using modern method development and validation tools, including approaches like AQbD, was lacking. Therefore, this study was planned with the objective of developing a novel liquid chromatographic method, primarily based on AQbD for determination of relugolix and its related substances.
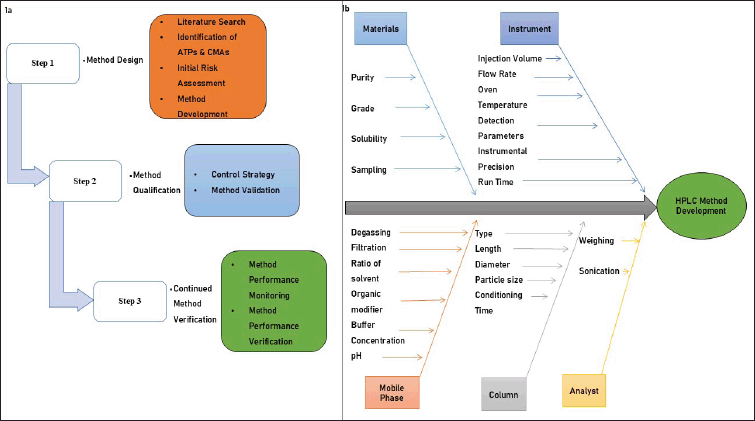 | Figure 1. (a) The key steps of analytical method development using QbD approach. (b) Factors affecting method development and validation. [Click here to view] |
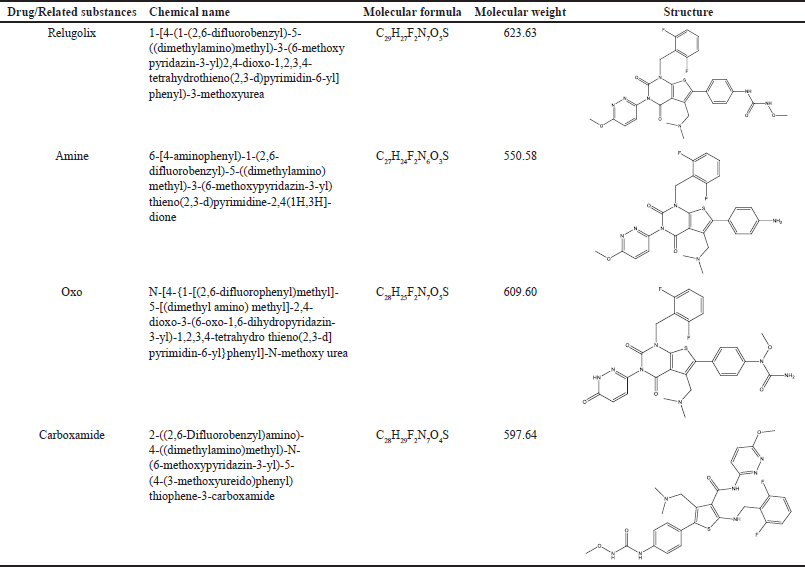 | Table 2. Chemical details of relugolix and its related substances. [Click here to view] |
EXPERIMENTAL MATERIAL AND METHODS
Materials
Relugolix (purity 99.43% w/w) was obtained as a gift sample from Zydus Cadila, Sikkim, acetonitrile (ACN) batch no. 8155030224 from Thermo Fischer Scientific Private India Limited (purity 99.8% w/w), and orthophosphoric acid (OPA) by batch no. 616980702bw from Finar Limited (purity 99.0% w/w). Potassium di-hydrogen orthophosphate AR grade: batch no. 9163228175W, by Finar Limited, India (purity 99.0% w/w), a purification system for water (Bio-Age), was used in all the solution preparations.
Instrumentation
For IR spectroscopy, Perkin Elmer FT-IR (version 5.0.1) spectrometer, UV-Visible Spectrophotometer Perkin-Elmer Lamda-35, Varian NMR 500 MHz, The HPLC system features include a quaternary pump separation module, diode array detector, degasser, oven column compartment, and dedicated software for analysis from the Waters Alliance e 2695 separation module, model no. 2489, Agilent Technologies 1290 infinity (Pump, model no. G1311C, 1260 Quat Pump VL), (Sampler, model no. G13298, 1260 ALS), (Column model no G1330B, 1260 ALS Therm), (Detector, model number G1316A, 1260 TCC), Agilent’s liquid chromatography–mass chromatography (LC-MS), and pH meter seven compact and weighing balance Xp 205 of Mettler Toldeo were used.
Software
For HPLC, Waters Empower Software version 3.6.1, EZ Chrom Elite version 3.3.2; for IR spectrometer, Spectrum, version 5.0.1; for UV spectroscopy, Perkin Elmer UV Winlab; for AQbD statistics, DOE version 13.0; for NMR, Vnmrj and chromera for LC-MS were used during the process.
SAMPLE PREPARATIONS
Buffer (liquid solvent system A): Anhydrous potassium dihydrogen phosphate (1.36 g) was weighed and placed in 1,000-ml flask and water was added to adjust the final volume. The pH of buffer was set to 2.5 ± 0.05 by using OPA and filtered by nylon filter 0.45 µm.
Liquid solvent system B: ACN
Diluent Liquid solvent system A: Liquid solvent system B (50:50). This diluent was used in the preparation of sample solutions.
Drug (Relugolix) Sample: A stock solution of 1,000 µg/ml relugolix drug sample was prepared in a diluent. The 50-µg/ml stock solutions of related substances (amine, oxo, and carboxamide) were prepared in diluent and were further diluted to 5.0-µg/ml concentration from the stock solution.
Sensitivity solution: The concentration of 0.5-µg/ml sensitivity solution was prepared from related substances stock for detecting the signal-to-noise ratio.
Resolution solution: A solution containing 1,000-µg/ml relugolix and 5-µg/ml related substances (amine, oxo, and carboxamide) was prepared to check the resolution between relugolix and related substances.
Specifications for the analytical target profile (ATP)
The method development parameters used to achieve ATP were set as per the guidelines of ICH Q2 (R2), and the specifications included separation of relugolix from its related substances at a resolution limit of 1.5, a tailing factor of 0.8–2.0, a theoretical plate count that should not be less than (NLT) 3000, quantification of relugolix and its related substances with a linearity range of 50%–150%, a recovery of 80%–120%, a relative standard deviation (RSD) of less than 10%, and signal-to-noise ratio of NLT 33% [27,28].
RESULTS
Method exploration (preliminary experiments)
The separation of a drug and its related substances depends on the column selection, pH and pKa of the drug, and the buffer solutions [29]. The preliminary trials for selection of columns were started by using C8 (Inertsil) and C18 (Kromasil) columns of 250 mm × 4.6 mm × 5.6 mm [30] and the C18 column provided better separation of relugolix and related substances, as depicted in Fig S1 in the supplementary information. By using the Marvin sketch software ChemAxon (Budapest, Hungary), the pKa and pH curves of relugolix and its related substances were determined and are shown in Fig S2a and S2b in the supplementary information [31]. The curves revealed that the relugolix and amine-related substances are basic in nature. Therefore, phosphate buffers with pKa values of 2.16, 7.21, and 12.32 (pH 2.5) and acetate buffers with a pKa value of 4.77 (pH 7.7) were selected as liquid solvent system A, with ACN used as liquid solvent system B. The chromatograms obtained during the study (Fig S3 in the supplementary information) show that the pH 7.7 acetate buffer causes tailing and elution of the amine peak in the relugolix peak in comparison to the pH 2.5 phosphate buffer, which shows good separation. Based on the trial chromatograms, the phosphate buffer of pH 2.5 was selected as the buffer for screening. The impact of column temperature on peak separation was considered during screening.
Critical method attributes and parameters
The method performance was measured by monitoring critical method attributes such as the resolution between the relugolix and its related substances and the tailing factor, which were selected as CMAs for this study [32]. The four critical method parameters considered and controlled after preliminary trials were the buffer pH (2.0–5.0), initial percent ratio of liquid solvent system B (5%–20%), column temperature (20°C–40°C), and buffer molarity (10–40 mM).
Design of Experiment
DOE is a contemporary approach used to efficiently plan and analyze experiments to optimize performance and derive meaningful insights. The methodology follows a structured process, which includes the following key steps.
Screening (factorial design)
Among various tools, the DOE is a unique experimental tool for assessing the relationships among factors and responses in terms of the anticipated accuracy, with possibly the lowest expenditure in terms of the usage of reagents, solvents, chromatographic runs, duration of the analysis, and other required resources [33]. This relationship between the factors and their responses is shown in the following linear equation [34]:
Ya = β0 + β1A1 + β2A2 + β3A3 + β4A4 + residuals [equation 1]
where Ya is the response measured, A1–A4 are the factors considered during the process of method development, β0 is an intercept, and β1–β4 are regression coefficients of experimental runs.
During the application of the DOE, the effect of each factor on its response was performed at two levels by using a full factorial design, which resulted the total runs 16 (24), as shown in Table 3. The factors and their responses were determined via linear regression and statistically validated via analysis of variance (ANOVA). Statistical parameters of this model are depicted in Table S1 in supplementary information, which clearly shows that the obtained model is driven well by the experimental data and is fit with good prediction capability. The model graphs obtained from the DOE depict the effects of various factors on the tailing response and resolution between relugolix and its amine-related substance as shown in Figure S4a and Figure S4b of supplementary information. The pH of the buffer (liquid solvent system A) and column compartment temperature had a direct effect on resolution and tailing factor, respectively, whereas the initial ratio (10%30%) and buffer molarity (10–40 mM) of the liquid solvent system B did not have a noteworthy effect on the tailing or resolution. To achieve maximum column efficiency and an HPLC system, the molarity of the buffer solution should be as minimal as possible. To limit the run time, the initial ratio of the liquid solvent system was set at 20%. The pH of the buffer solution was between 2.0 and 3.0, and column temperature was varied in between 25°C and 35°C to optimize the method.
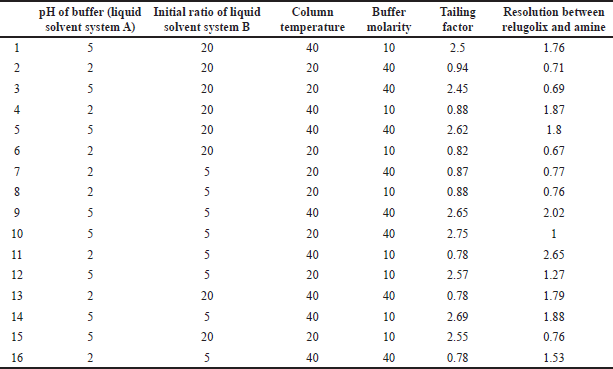 | Table 3. The full factorial design of the experimental run. [Click here to view] |
Response surface design (Method Optimization)
The response surface design via the central composite face-centered response surface design (CCD) approach was utilized to investigate the interactions of each factor via the following polynomial equation (equation 2) [35], and different combinations of 12 experimental runs are shown in Table 4
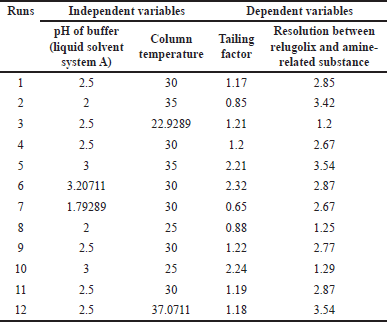 | Table 4. Response surface design via the CCD approach. [Click here to view] |
Ya = β0 + β1A1 + β2A2 + β11A12 + β22A22 + β12A1A2 + residuals (equation 2)
where Ya is the response measured, A1A2 are factors selected, β0 is an intercept, β1 and β2 are regression coefficients of experimental runs, β12 is the coefficient of interaction, and β11 and β22 are coefficients of quadratic terms [36].
ANOVA was implemented to validate the results statistically, and it was revealed that the model was fit and predictable, as shown in Table 5 [37]. The relationship of each factor with the response [38] was measured in terms of desirability and was 0.992 at pH 2.5 and a column temperature of 35°C by using the contour plot and 3D surface graph shown in Figure 2a–2e.
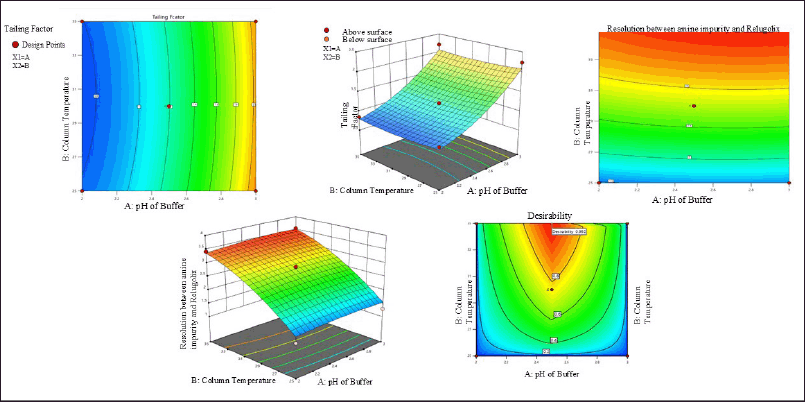 | Figure 2. (a) Contour plot of tailing factor. (b) Contour plot of resolution between amine impurity and relugolix. (c) Desirability value of all responses. (d) 3D graph of resolution between amine impurity and relugolix. (e) 3D graph of tailing factor. [Click here to view] |
Final conditions for HPLC method validation
The method was finally developed by utilizing a Kromasil C18 column (specifications: 250 mm × 4.6 mm, 5 µm), a liquid solvent system with phosphate buffer at pH 2.5 (liquid solvent system A), and 100% acetonitrile (liquid solvent system B). The pH of the phosphate buffer (liquid solvent system A) was set at 2.5 (pH 2.5) by using orthophosphoric acid. Degassing was done by filtration, followed by 10 minutes of sonication. Flow of 1 ml/minute, column temperature 35°C, wavelength 230 nm, and injection of 10 µl were used as final optimized conditions. The gradient composition employed in the chromatographic system using liquid solvent systems A and B was as follows: (0 minutes, 80:20), (5 minutes, 80:20), (40 minutes, 65:30), (50 minutes, 65:30), (55 minutes, 65:30), and (60 minutes, 65:30).
METHOD VALIDATION
The system suitability, specificity, linearity and range, precision, accuracy, limit of detection, limit of quantification, and robustness parameters were validated using ICH guidelines Q2 (R2) [39].
System suitability
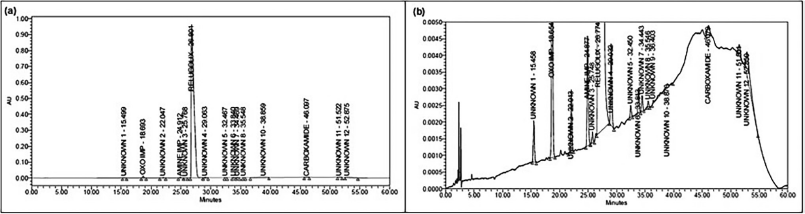
The system suitability is crucial for assessing the performance of a chromatographic system, which includes the retention time (RT), tailing factor, theoretical plates, resolution and percent RSD of six replicate injections of relugolix and its related substances [40]. Findings for these parameters were found within the ATP and are summarized in Table 5, and the corresponding chromatograms are shown in Figure 3a–3c.
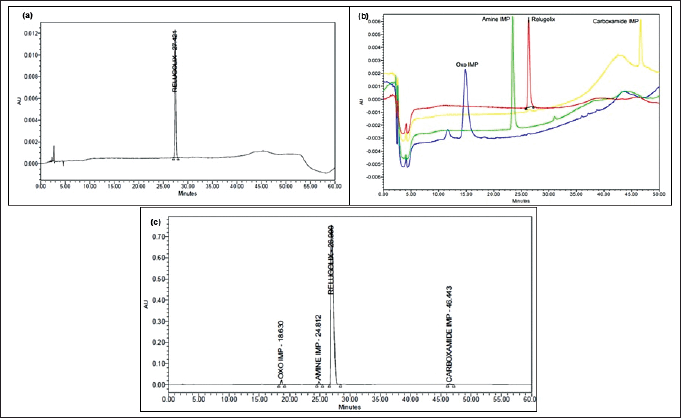 | Figure 3. Chromatogram showing (a) RT of relugolix, (b) RT of relugolix and its impurities, and (c) resolution between relugolix and its impurities. [Click here to view] |
Specificity
The ability to distinguish the peaks of the analyte and other components in a given sample is considered as specificity of the method. Our method was found to be precise for determining relugolix and its related substances, as these peaks were clearly separated, and no interferences were observed with peak purity values found to be 1.0 as shown in Figure S5 to S5d of supplementary information [41].
Relative response factor (RRF)
The RRF was determined for amine, oxo, and carboxamide-related substances as the ratio of the slope of the relugolix drug substance to the slope of the related substances. The values of RRF are depicted in Table 6.
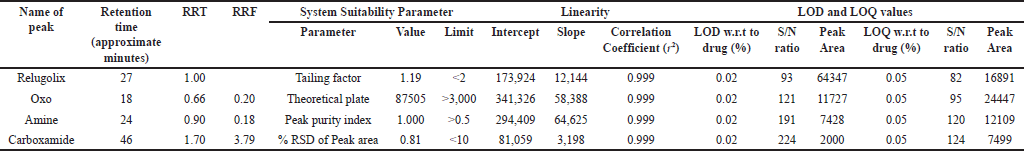 | Table 6. Results of system suitability parameters, linearity, and LOD and LOQ values. [Click here to view] |
Linearity
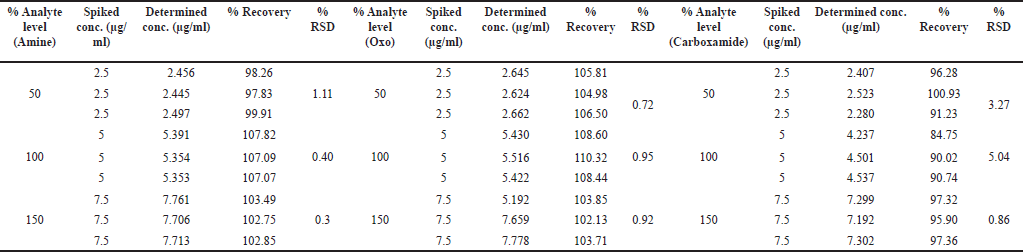
Linearity is crucial to ensure that the obtained results exhibit a consistent relationship with the concentration of the substance being analyzed. To evaluate linearity, a calibration curve within the range of 50–150 µg per ml was established for both the relugolix and its related substances [42]. The correlation coefficient (r2) values are presented in Table 6, which exceeds 0.999, demonstrating an excellent fit for the data, and Figure 4a–d presents the linearity curves.
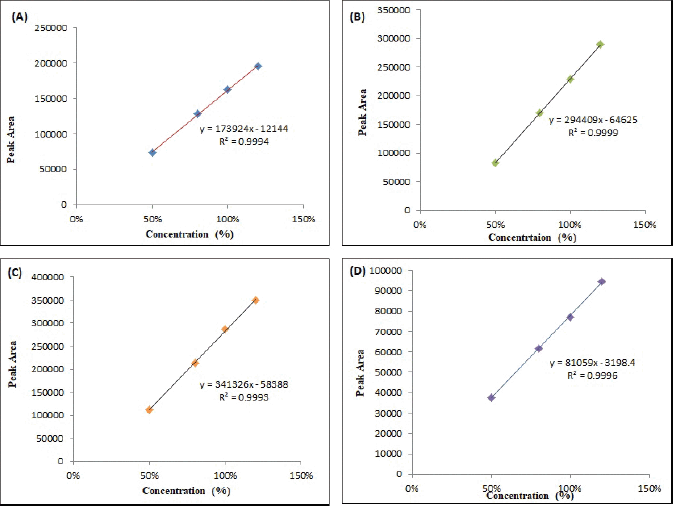 | Figure 4. Linearity plot (A) relugolix, (B) amine, (C) oxo, and (D) carboxamide. [Click here to view] |
Precision
It is the reliability of measurements obtained from numerous samples of the same homogeneous sample in specific conditions [42]. In this study, precision was measured at 2 levels, i.e., repeatability and ruggedness. Six replicate injections of 5 µg per ml of relugolix and related substances were used, and the % RSD was <10, which is within acceptable limits. The values obtained for the precision study are depicted in Table S2 of supplementary information.
Accuracy
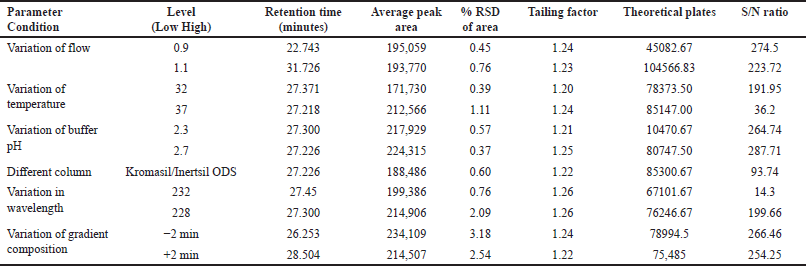
Accuracy is the nearness of the results to the true value, which was assessed through a recovery experiment using three different levels of solutions (50%, 100%, and 150%) containing relugolix and related substances. Each level of solution was prepared and analyzed in triplicate. The recovery was 80%–120%, which is acceptable and is described in Table 7 [43,44].
 | Table 7. Summarized results of the accuracy studies. [Click here to view] |
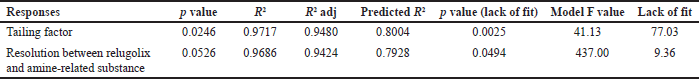
Robustness
It is the capability of a method to remain stable despite small intentional changes. The optimized conditions selected through the contour diagram were used for robustness study. The % RSD for the altered parameters was <3.5, which was within the acceptable range (Table 8) and reflects the robustness of our method [45].
 | Table 8. Evaluation data of the robustness studies. [Click here to view] |
Limit of detection (LOD)
The lowest concentration at which an analyte can be consistently detected, though not accurately quantified is considered as LOD [46]. The LOD obtained for each analyte was 0.02% and the signal-to-noise ratio was found more than 33%; the results are listed in Table 5, and chromatograms are shown in the supplementary material (Fig . S6–S9).
 | Table 5. Response surface design statistical parameters of the mathematical models. [Click here to view] |
Limit of quantification (LOQ)
LOQ is the minimum amount of analyte that can be measured with acceptable precision and accuracy [47]. The LOQ values obtained for each analyte was 0.05%, the signal-to-noise ratio was found more than 33%, and the results are shown in Table 5; the chromatograms are shown in supplementary information (Fig. S10–S13).
Solution stability
The sample solution stability was assessed at room temperature. The % RSD was intended to compare the results of previously stored sample solutions against those of freshly prepared samples [48]. The solution stability of 5-µg/ml relugolix and its related substances at room temperature was evaluated at different intervals for 42 hours. The % RSD was determined for the peak area and resolution between relugolix and amine-related substances, and the % degradation of each impurity was calculated [49] and is presented in Table 9. The chromatograms of the optimized initial chromatographic conditions are presented in Figure 5a and b.
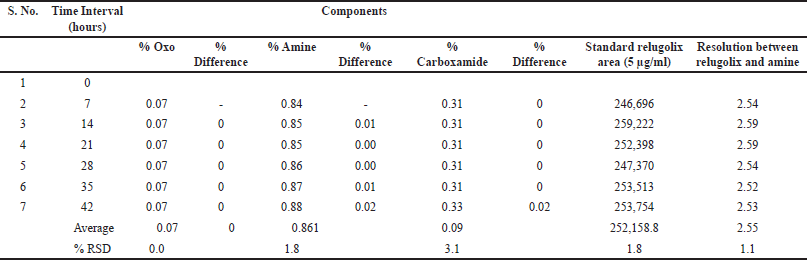 | Table 9. Results of the solution stability study of relugolix and its related substances. [Click here to view] |
 | Figure 5. Chromatograms after final optimum condition. (a) Auto-scale. (b) Full zoom. [Click here to view] |
Forced degradation study
Forced degradation analysis was accomplished to govern the chemical stability of the relugolix, its degradation mechanism, and the stability of the developed method [50,51]. The relugolix was subjected to various vigorous degradation conditions, such as thermal, alkali, acid, oxidative, and photodegradation, as described in the ICH Q2B guidelines. For hydrolysis, the relugolix was exposed to mildly acidic as well as alkaline (0.1 N NaOH and 0.1 N HCl) to harsh (1 N NaOH and 1 N HCl) conditions for 1 hour [51,52]. Photodegradation was performed by exposing the drug to UV light in a photostability chamber, and thermal degradation was completed by exposing the drug to 70°C in an oven for 24 hours. Additionally, oxidative degradation was determined by exposing the drug to 5% H2O2 for 3 hours [53]. The percent degradation was determined by comparison against freshly prepared samples, and it was observed that the drug underwent hydrolysis to 0.08% in 0.1 N HCl and 4.74% in 1-N HCl acidic conditions. In alkaline solutions such as NaOH, hydrolysis occurred at 2.25% and 4.26%. The drug displayed negligible oxidation at approximately 0.01% and 0.44% under thermal conditions, 0.27% at room temperature, and 0.34% under UV light during photodegradation. It was concluded that the drug is stable under stress conditions. The results of this study are presented in Table 10 and Figure 6, which shows the overlay of the degradation under various conditions by HPLC. Identification and characterization of relugolix and its related substances were performed after forced degradation studies via IR spectra, LC-MS graph of relugolix shown in Fig. 7a and b and (NMR) spectroscopy (Fig 8), and ultraviolet (UV) spectra in supplementary information (Figs. S14–16), and their interpretation results are summarized as follows.
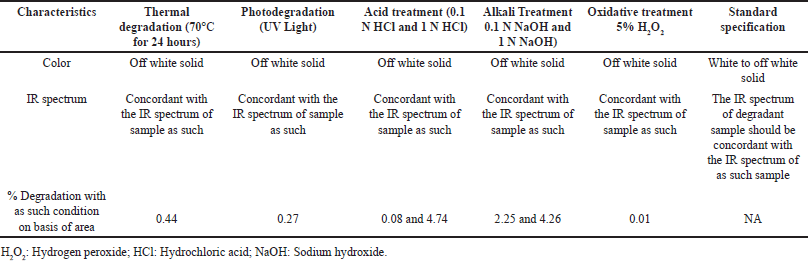 | Table 10. Results of forced degradation studies. [Click here to view] |
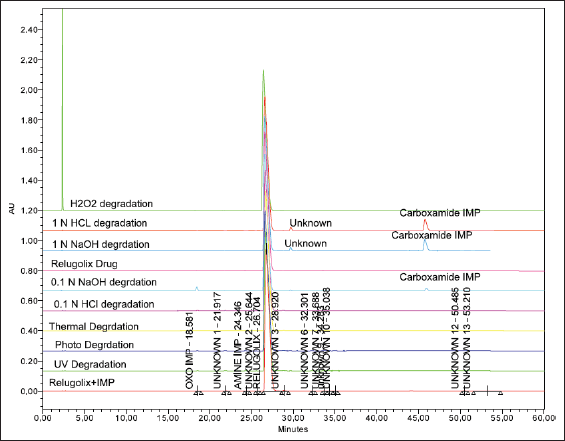 | Figure 6. The overlay forced degradation chromatograms by HPLC. [Click here to view] |
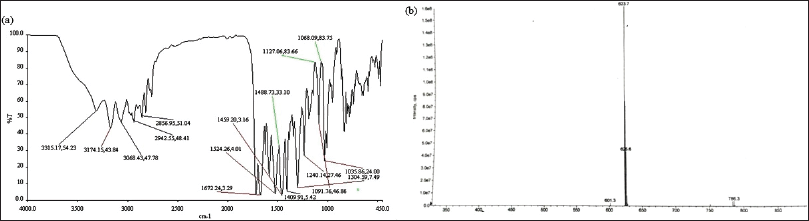 | Figure 7. (a) The IR spectrum of relugolix after forced degradation (b) The LCMS showing observed mass of relugolix after forced degradation. [Click here to view] |
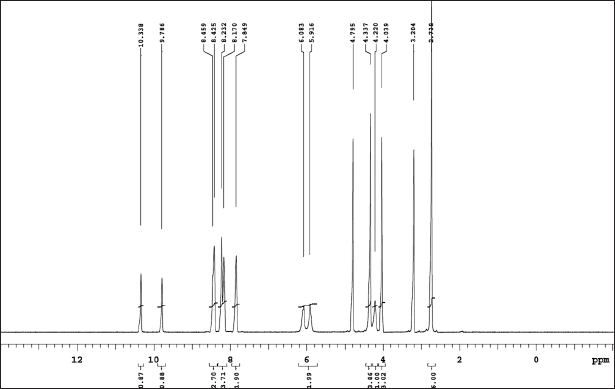 | Figure 8. (a) 1H NMR of relugolix. [Click here to view] |
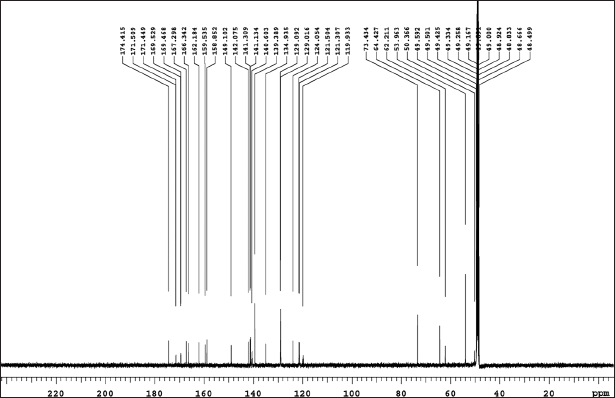 | Figure 8. (b) 13C NMR relugolix. [Click here to view] |
Interpretation of IR, LC-MS, NMR, and UV spectroscopy
Relugolix IR: The N–H stretching at 3,315.17 cm-1; -C–H stretching at 3,174.15 cm-1, 3,068.43 cm-1, 2,942.55 cm-1, and 2,856.95 cm-1; -C=O stretching at 1,672.24 cm-1 and 1,524.26 cm-1; -C=C and –C=N stretching at 1,488.73 cm-1, 1,459.20 cm-1, and 1,409.91 cm-1; -C–N and –C–O stretching at 1,304.59 cm-1, 1,240.14 cm-1, and 1,127.06 cm-1; and –C–F stretching at 1,091.76 cm-1, 1,068.09 cm-1, and 1,035.86 cm-1.
Relugolix LC-MS: The exact mass value (g/mol) that was observed (M+H)+ was 624.18 and (M)+ is 623.17 and its theoretical mass (M)+ is 623.17.
Relugolix NMR: The assignments of chemical shift are as follows: 1H NMR: δ-2.73 (s, 6H), 4.03 (s, 3H), 4.22 (s, 1H), 4.33 (s, 4H), 5.99 (d, 2H), 7.84 (s, 2H), 8.20 (d, 4H), 8.43 (s, 3H), 9.78 (s, 1H), and 10.33 (s, 1H). 13C-NMR: δ− 50.36, 53.96, 62.21, 64.42, 73.43, 119.93, 121.30, 121.50, 121.05, 129.01, 129.09, 134.93, 140.60, 141.13, 141.30, 142.07, 149.10, 158.85, 159.53, 162.18, 166.34, 167.29, 169.46, 169.52, 171.44, 171.50, and 174.41.
Relugolix UV: The lambda max was found 206 nm and the absorbance was 1.0218.
Amine IR:-N–H stretching at 3637.75 cm-1; -C–H stretching at 3,062.96 cm-1 and 3,045.60 cm-1-C=O stretching at 1,712.79 cm-1 and 1,670.35 cm-1; -C=C and –C=N stretching at 1,533.41 cm-1, 1,517.98 cm-1, 1,463.97 cm-1, and 1,409.96 cm-1; -C–N and -C–O stretching at 1,350.17 cm-1, 1,301.95 cm-1, and 1,278.81 cm-1; and –C-F stretching at 1,029.99 cm-1.
Amine LC-MS: The exact mass value (g/mol) that was observed (M+H)+ was 551.1 and its theoretical mass (M)+ was 550.16.
Amine NMR: The assignments of chemical shift are as follows: 1H NMR: δ-2.13 (s,6H), 3.65 (brs, 2H), 3.90 (s, 2H), 4.18 (s, 3H), 5.33 (brs, 2H), 6.70 (d, 2H), 6.92 (t, 2H), 7.13 (d, 1H), 7.31 (m, 3H), and 7.44 (d, 1H). 13C-NMR: 40.20, 45.08, 111.75, 111.80, 114.81, 119.32, 130.73, 130.57, 131.24, 110.06, 115.30, 121.35, 131.89, 134.45, 147.17, 149.69, 150.12, 152.16, 158.34, 161.54, 161.54, and 165.05
Amine UV: The lambda max was 202 nm and the absorbance was 0.4496.
Oxo IR:-N–H stretching at 3,246.20 cm-1 and 3,064.89 cm-1, -C–H stretching at 2,945.30 cm-1, 2,858.51 cm-1, and 2,823.79 cm-1, C=O stretching at 1,716.65 cm-1 and 1,664.57 cm-1; -C=C and –C=N stretching at 1,625.99 cm-1, 1,525.69 cm-1, 1,460.11 cm-1, and 1,409.96 cm-1; -C–N and –C–O stretching at 1,384.89 cm-1, 1,328.95 cm-1, and 1,298.09 cm-1; and -C–F stretching at 1,031.92 cm-1 and 1,004.91 cm-1
Oxo LC-MS: The exact mass value (g/mol) that was observed (M+H)+ was 610.1 and its theoretical mass (M)+ was 609.16.
Oxo NMR: The assignments of chemical shift are as follows: 1H NMR: δ-2.06 (s, 6H), 3.63 (m, 5H), 5.16 (m, 1H), 5.42 (m, 1H), 7.06 (d, 1H), 7.14 (t, 2H), 7.47 (m, 4H), 7.73 (d, 2H), 9.10 (s, 1H), 9.64 (s, 1H), and 13.30 (s, 1H). 13C-NMR: δ-41.32, 44.91, 53.19, 64.43, 110.80, 112.35, 114.88, 119.97, 125.80, 130.38, 131.64, 135.18, 138.97, 140.13, 149.72, 153.14, 157.33, 158.15, 160.96, 161.41, and 61.48
Oxo UV: The lambda max was found 203.2 nm and the absorbance was 0.4531.
Carboxamide IR:-N–H stretching at 3,257 cm-1; -C–H stretching at 2,949 cm-1; -C=O stretching at 1,680 cm-1; -C=C and –C=N stretching at 1,585 cm-1, 1,519 cm-1, and 1,460 cm-1; -C–N and –C–O stretching at 1,377 cm-1, 1,269 cm-1, and 1,234 cm-1; and –C–F stretching at 1,010 cm-1.
Carboxamide LC-MS: The exact mass value (g/mol) that was observed (M+H)+ was 598.40,596.2 (M-H)+ and its theoretical mass (M)+ was 597.20
Carboxamide NMR: The assignments of chemical shift are as follows: 1H NMR: δ-2.20 (s, 6H), 3.45 (s, 2H), 3.64 (s, 3H), 3.97 (s, 3H), 4.52 (brs, 2H), 7.16 (m, 3H), 7.23 (d, 2H), 7.44 (m, 1H), 7.68, (d, 2H), 8.34 (d, 1H), 8.99 (t, 1H), 9.15 (s, 1H), 9.72 (s, 1H), and 14.27 (s, 1H). 13C-NMR: 131.09, 139.57, 153.95, 157.41, 161.03, 161.38, 162.17, 163.73, and 166.19.
Carboxamide UV: The lambda max was 204.6 nm and the absorbance was 0.8828.
DISCUSSION
A comprehensive investigation and analysis of existing research and literature reveal that the separation of relugolix and its related substances poses significant challenges with the reported methods—an issue that is largely overlooked in the current studies. The degraded impurities of relugolix after forced degradation were characterized by Pulletikurthi et al. [15], but they did not address the related substances and method development or validation of relugolix. Similarly, Narayanreddy et al. discussed the degraded impurities of relugolix but lacked a comprehensive analysis of all related substances and used a shorter run time in their study, which prevented the separation of the carboxamide impurity, as its RRF with respect to relugolix is 3.79 [10]. Existing literature has emphasized degradation impurities without completely exploring the related substances, which are crucial in the formulation development of any drug in the pharmaceutical industry. Analyzing related substances is mandatory according to pharmaceutical regulations, specifically the ICH (Q6A) guidelines, which state that limits for related substances must be established and considered during method development. In our research, we thoroughly investigated related substances and presented a comprehensive analysis of relugolix and its related substances. We selected a C18, 250-mm column with flow rate of 1.0 ml/minute and a total run time of 60 minutes. Our focus was on achieving resolution between relugolix and the amine-related substances, which is essential for accurate relugolix determination. Due to their basic nature, the separation of amine impurities and relugolix is challenging, as the amine-related substance tends to co-elute with the relugolix peak. This issue, which was not addressed in previous studies, was resolved in our method. Additionally, we successfully separated the carboxamide impurity at an RT of approximately 46 minutes, a separation difficult to achieve with shorter run times reported in the existing literature. Our method achieved clear separation of oxo, amine, relugolix, and carboxamide at RT of 18, 22, 24, and 46 minutes, respectively. This demonstrates that longer run time is necessary for accurate separation of relugolix and its related substances. The comparatively shorter run times used in existing studies may result in overlapping peaks, underscoring the limitations of those methods. Furthermore, we applied the AQbD approach, which improved the reliability and robustness of our results. Moreover, our study offers a thorough analysis of relugolix’ related substances using a combination of cost-effective instruments such as IR, UV, and HPLC, alongside advanced techniques like LC-MS and NMR. This integrated approach, which had not been consolidated in a single study before, enhances the depth and reliability of our findings. Our comprehensive research has led to a more accurate and robust method, making it well suited for use in pharmaceutical analysis of relugolix and its related substances.
CONCLUSION
The approval of relugolix as the first oral treatment for advanced prostate cancer represents a major breakthrough. However, developing a reliable analytical method to accurately quantify relugolix and its related substances (amine, oxo, and carboxamide) presents a significant challenge, as no pharmacopoeial monograph or limited established literature with some limitations exists for this purpose. To address this gap, we have developed the HPLC analytical method using the AQbD approach, aligned with the ICH Q14 and Q2 R (2) guidelines for method development and validation. Our method, designed using a DOE approach, provides greater precision, effectiveness, and efficiency compared to preliminary methods by allowing for a better assessment of the unknown effects of various factors on outcomes. The method was further optimized using a CCD, which evaluated the interrelationship between critical factors such as buffer pH (solvent system A) and column temperature at different levels. The results, validated statistically through ANOVA, indicated optimal conditions at a pH of 2.5 and a column temperature of 35°C, achieving a desirability function close to 1. Furthermore, forced degradation experiments were performed under various stress conditions, and the related substances of relugolix were characterized using both common and advanced techniques such as IR, UV, LC-MS, and NMR. Consequently, this newly developed method has proven to be precise, accurate, robust, and stable, providing pharmaceutical manufacturers and research organizations with a valuable tool to reliably assess the quality and stability of relugolix and its related substances in formulations.
ACKNOWLEDGMENTS
The authors thank Indian Pharmacopoeia Commission, Ministry of Health and Family Welfare, Government of India, and Delhi Pharmaceutical Science and Research University, Pushp Vihar, New Delhi, India, for their support to this work.
AUTHORS’ CONTRIBUTIONS
All authors made substantial contributions to conception and design, acquisition of data, or analysis and interpretation of data; took part in drafting the article or revising it critically for important intellectual content; agreed to submit to the current journal; gave final approval of the version to be published; and agree to be accountable for all aspects of the work. All the authors are eligible to be an author as per the International Committee of Medical Journal Editors (ICMJE) requirements/guidelines.
FINANCIAL SUPPORT
There is no funding to report.
CONFLICTS OF INTEREST
The authors report no financial or any other conflicts of interest in this work.
ETHICAL APPROVALS
This study does not involve experiments on animals or human subjects.
DATA AVAILABILITY
All data generated and analyzed are included in this research article.
PUBLISHER’S NOTE
All claims expressed in this article are solely those of the authors and do not necessarily represent those of the publisher, the editors and the reviewers. This journal remains neutral with regard to jurisdictional claims in published institutional affiliation.
USE OF ARTIFICIAL INTELLIGENCE (AI)-ASSISTED TECHNOLOGY
The authors declares that they have not used artificial intelligence (AI)-tools for writing and editing of the manuscript, and no images were manipulated using AI.
REFERENCES
1. Belkahla S, Nahvi I, Biswas S, Nahvi I, Ben Amor N. Advances and development of prostate cancer, treatment, and strategies: a systemic review. Front Cell Dev Biol. 2022 Sep 9;10:991330. CrossRef
2. Bergengren O, Pekala KR, Matsoukas K, Fainberg J, Mungovan SF, Bratt O, et al. 2022 Update on prostate cancer epidemiology and risk factors—a systematic review. Eur Urol. 2023 Aug;84(2):191–206. CrossRef
3. Amjad MT, Chidharla A, Kasi A. Cancer Chemotherapy. In: StatPearls [Internet]. Treasure Island, FL: StatPearls Publishing; 2025. Available from: https://www.ncbi.nlm.nih.gov/books/NBK564367/
4. Shirley M. Relugolix: a review in advanced prostate cancer. Target Oncol. 2023 Mar;18(2):295–302. CrossRef
5. Miwa K, Hitaka T, Imada T, Sasaki S, Yoshimatsu M, Kusaka M, et al. Discovery of 1-{4-[1-(2,6-Difluorobenzyl)-5-[(Dimethylamino)Methyl]-3-(6-Methoxypyridazin-3-Yl)-2,4-Dioxo-1,2,3,4-Tetrahydrothieno[2,3-d]Pyrimidin-6-Yl]Phenyl}-3-Methoxyurea (TAK-385) as a Potent, Orally Active, Non-Peptide Antagonist of the Human Gonadotropin-Releasing Hormone Receptor. J Med Chem. 2011 Jul 28;54(14):4998–5012. CrossRef
6. Nakata D, Masaki T, Tanaka A, Yoshimatsu M, Akinaga Y, Asada M, et al. Suppression of the hypothalamic–pituitary–gonadal axis by TAK-385 (Relugolix), a novel, investigational, orally active, small molecule gonadotropin-releasing hormone (GnRH) antagonist: studies in human GnRH receptor knock-in mice. Eur J Pharmacol. 2014;723:167–74. CrossRef
7. Markham A. Relugolix: first global approval. Drugs. 2019 Apr;79(6):675–9. CrossRef
8. Center for Drug Evaluation and Research. FDA approves relugolix for advanced prostate cancer. Silver Spring, MD: US Food and Drug Administration. [cited 2023 Dec 08]. Available from: https://www.fda.gov/drugs/resources-information-approved-drugs/fda-approves-relugolix-advanced-prostate-cancer
9. Orgovyx. Amsterdam, The Netherlands: European Medicines Agency. [cited 2024 July 02]. Available from: https://www.ema.europa.eu/en/medicines/human/EPAR/orgovyx
10. Papadasu N. A novel validated stability indicative uplc method for relugolix for the determination of process-related and degradation impurities. Rasayan J Chem. 2024;17:325–36. CrossRef
11. Kumar M. Marakatham M, Siva Prasad S, Ravi V, Deepika P, Prathibha Bharathi M. RP-HPLC method development and validation of RELUGOLIX. IJCBS. 2023;24(6):850–5.
12. Immani Ramachandra Rao, Chava Lavanya, Punitha P. A new analytical method for determination and quantification of residual solvents in relugolix api bulk drug by GC-MS method. Res J Pharm Technol. 2023;16:4723–8. CrossRef
13. Gummaluri RK, Karipeddi R. An in-vitro study of a simultaneous method for determining relugolix, norethindrone acetate, and estradiol by UPLC. RASAYAN J Chem. 2023;16(03):1770–9. CrossRef
14. Thrinath SR, Lakshmi KS, Krishnan M. Development and validation of a method for studying relugolix and its impurities by UPLC-MS. Acta Chromatographica. 2024;16:1–12. CrossRef
15. Pulletikurthi KM, Annapurna N, Doddipalla R, Vijay R, Rumalla CS, Kaliyaperumal M, et al. Force degradation studies of relugolix: identification, isolation and structure characterization of stress degradation products by using liquid chromatography-mass spectrometry, auto purification mass mediated preparative-high performance liquid chromatography, high resolution mass spectrometry, nuclear magnetic resonance spectroscopy. Spectroscopy Lett. 2022;55(2):128–37. CrossRef
16. European Medicines Agency ICH Q14 Guideline on analytical procedure development. ICH. Amsterdam, The Netherlands: European Medicines Agency. [cited 2024 March 08]. Available from: https://www.ema.europa.eu/en/documents/scientific-guideline/ich-q14-guideline-analytical-procedure-development-step-5_en.pdf
17. Shamim A, Ansari MJ, Aodah A, Iqbal M, Aqil M, Mirza MA, et al. QbD-engineered development and validation of a RP-HPLC method for simultaneous estimation of rutin and ciprofloxacin HCl in bilosomal nanoformulation. ACS Omega. 2023;8(24):21618–27. CrossRef
18. Sha’at M, Spac AF, Stoleriu I, Bujor A, Cretan MS, Hartan M, et al. Implementation of QbD approach to the analytical method development and validation for the estimation of metformin hydrochloride in tablet dosage forms by HPLC. Pharmaceutics. 2022;14(6):1187. CrossRef
19. Patel KG, Patel AT, Shah PA, Gandhi TR. Multivariate optimization for simultaneous determination of aspirin and simvastatin by reverse phase liquid chromatographic method using AQbD approach. Bull Facul Pharm Cairo Univ. 2017;55(2):293–301. CrossRef
20. PubChem. Relugolix. pubchem.ncbi.nlm.nih.gov Available from: https://pubchem.ncbi.nlm.nih.gov/compound/Relugolix
21. Relugolix Amine Impurity Daicel Pharma Standards. 2022. [cited 2024 July 02]. Available from: https://www.daicelpharmastandards.com/product/relugolix/relugolix-amine-impurity
22. Lolla S, Gubbiyappa KS. Bio-analytical method development and validation for the quantitation of relugolix in plasma samples by lc-ms/ms: application to bioavailability study in rabbits. Rasayan J Chem. 2023;16(01):494–501. CrossRef
23. PubChem. Relugolix Impurity 17. 2022. [cited 2024 July 02]. Available from: Available from: https://pubchem.ncbi.nlm.nih.gov/compound/118378832
24. SitePoint. Simson Pharma Limited. [cited 2024 July 02]. Available from: https://www.simsonpharma.com/us/product/relugolix-impurity-42
25. Center for drug evaluation and research application number: 214621orig1s000 product quality review(s). [cited 2024 July 03]. Available from: https://www.accessdata.fda.gov/drugsatfda_docs/nda/2020/214621Orig1s000ChemR.pdf
26. Orgovyx (relugolix) FDA Approval History. [cited 2024 July 03]. Available from: https://www.drugs.com/history/orgovyx.html
27. Taylor MR, Kawakami J, McCalley DV. Managing sample introduction problems in hydrophilic interaction liquid chromatography. J Chromatogr A. 2023 Jul 5;1700:464006. CrossRef
28. Vogt FG, Kord AS. Development of quality-by-design analytical methods. J Pharm Sci. 2011 Mar;100(3):797–812. CrossRef
29. Bains, B. Improve chromatographic separations: consider mobile phase pH & analyte pKa. ACD/Labs Available from: https://www.acdlabs.com/blog/improve-chromatographic-separations-consider-mobile-phase-ph-analyte-pka/
30. Tome T, Obreza A, ?asar Z. Developing an Improved UHPLC method for efficient determination of European pharmacopeia process-related impurities in ropinirole hydrochloride using analytical quality by design principles. Molecules. 2020 Jun 10;25(11):2691. CrossRef
31. Introduction to MarvinSketch | Chemaxon Docs. docs.chemaxon.com. [cited 2024 July 03]. Available from: https://docs.chemaxon.com/display/lts-europium/introduction-to-marvinsketch.md
32. Tome T, Žigart N, ?asar Z, Obreza A. Development and optimization of liquid chromatography analytical methods by using AQbD principles: overview and recent advances. Organ Process Res Dev. 2019;23(9):1784–802. CrossRef
33. Schiefer H, Schiefer F, Schiefer H. Statistical design of experiments (DoE). Statistics for Engineers: an Introduction with Examples from Practice. 2021. Pp 1–20.CrossRef
34. Lamidi S, Olalere R, Yekinni A, Adesina K. Design of experiments (DOE): applications and benefits in quality control and assurance. Available from: https://www.intechopen.com/chapters/88829
35. Jensen WA. Response surface methodology: process and product optimization using designed experiments 4th edition. J Qual Technol. 2017;49(2):186–8. CrossRef
36. Bhattacharya S. Central composite design for response surface methodology and its application in pharmacy. Shirpur, India: IntechOpen; 2021.
37. Azhakesan A, Kuppusamy S. Analytical quality by design-assisted HPLC method for quantification of canagliflozin and stability studies. ACS Omega. 2023;8(8):7407–14. CrossRef
38. Harish V, Almalki WH, Alshehri A, Alzahrani A, Gupta MM, Alzarea SI, et al. Quality by design (QbD) based method for estimation of Xanthohumol in bulk and solid lipid nanoparticles and validation. Molecules. 2023;28(2):472. CrossRef
39. International Council for Harmonisation of Technical Requirements for Pharmaceuticals for Human Use, ICH Harmonised Guideline Validation Of Analytical Procedures Q2(R2); 2023.
40. Kowalska M, Wo?niak M, Kijek M, Mitrosz P, Szakiel J, Turek P. Management of validation of HPLC method for determination of acetylsalicylic acid impurities in a new pharmaceutical product. Sci Rep. 2022 Jan 6;12(1):1. CrossRef
41. Al-Shami N, Naseef H, Moqadi R, Kanaze F. HPLC method development and validation for the determination of Apixaban and Clopidogrel in novel fixed-dose combination tablets. J Chem, 2024;2024:e2675736. CrossRef
42. Pecchio M, Salman H, Irache JM, Renedo MJ, Dios-Viéitez MC. Development and validation of a HPLC method for the determination of cyclosporine a in new bioadhesive nanoparticles for oral administration. Indian J Pharm Sci. 2014 Mar;76(2):132–7.
43. Amer SM, Kadi AA, Darwish HW, Attwa MW. LC–MS/MS method for the quantification of Masitinib in RLMs matrix and rat urine: application to metabolic stability and excretion rate. Chem Central J. 2017 Dec 22;11(1):136. CrossRef
44. Kadi AA, Darwish HW, Attwa MW, Amer SM. Validated LC-MS/MS method for the quantification of Ponatinib in plasma: application to metabolic Stability. PLoS One. 2016 Oct 20;11(10):e0164967. CrossRef
45. Kovac? L, C?asar Z, Trdan Lus?in T, Ros?kar R. Development of an analytical method for determination of related substances and degradation products of Cabotegravir using analytical quality by design principles. ACS Omega. 2022;7(10):8896–905. CrossRef
46. Naseef H, Moqadi R, Qurt M. Development and validation of an HPLC method for determination of antidiabetic drug Alogliptin Benzoate in bulk and tablets. J Anal Methods Chem. 2018 Sep 24;2018:1902510. CrossRef
47. Dosugi NF, Elbashir AA. Development and validation of reverse phase high performance liquid chromatography with fluorescence detector (RP-HPLC-FL) method for the determination of gemifloxacin in pharmaceutical dosage forms. Biomedical J Sci Tech Res. 2022;43(3):34527–32. CrossRef
48. Gholve R, Pekamwar S, Wadher S, Kalyankar T. Stability-indicating RP-HPLC method development and validation for simultaneous estimation of Telmisartan and Rosuvastatin calcium in bulk and in tablet dosage form. Future J Pharm Sci. 2021;7(1):1–5. CrossRef
49. Dabhi B. Method development and validation of a stability-indicating RP-HPLC method for the quantitative analysis of Dronedarone hydrochloride in pharmaceutical tablets. Scia Pharm. 2013;81(1):115–22. CrossRef
50. Jahan MS, Islam MJ, Begum R, Kayesh R, Rahman A. A study of method development, validation, and forced degradation for simultaneous quantification of paracetamol and Ibuprofen in pharmaceutical dosage form by RP-HPLC method. Anal Chem Insights. 2014 Nov 18;9:75–81. CrossRef
51. Blessy M, Patel RD, Prajapati PN, Agrawal YK. Development of forced degradation and stability indicating studies of drugs—a review. J Pharm Anal. 2014;4(3):159–65. CrossRef
52. Zaman B, Hassan W. Development of stability indicating HPLC–UV method for determination of daclatasvir and characterization of forced degradation products. Chromatographia. 2018;81(5):785–97. CrossRef
53. Venkata Rao P. A novel, validated stability-indicating UPLC method for the estimation of Lansoprazole and its impurities in bulk drug and pharmaceutical dosage forms. Sci Pharm. 2013;81(1):183–93. CrossRef
SUPPLEMENTARY MATERIAL
The supplementary material can be accessed at the link here: [https://japsonline.com/admin/php/uploadss/4591_pdf.pdf]