INTRODUCTION
Amoxicillin (AMX) is an antibiotic derived from semisynthetic penicillin [1]. It is commonly consumed and used to treat various bacterial infections. The unethical behavior of manufacturers in the Asian region was reported to dispose of massive amounts of antibiotics into the water system [2]. Due to the low metabolic degradation rate, most antibiotic molecules are secreted into the environment. This led to the destruction of the natural aquatic ecosystem due to increased bacterial antibiotic resistance. The evolution of bacteria to gain antibiotic-resistant genes is induced by antibiotic residues in water bodies and is detrimental to the aquatic ecosystem and human health [3]. According to Chowdhury et al. [4], the AMX residues were harmful to zebrafish genetically by damaging and breaking the DNA, which disrupted the development of embryos. The evidence above proves that the presence of AMX residues in the environment is a major problem. Sustainable and effective degradation of the residues must be developed to solve these issues.
Biodegradation is one of the most effective methods to remove environmental pollution. However, various factors may influence this process, both positively and negatively. Therefore, a non-biased and robust method was suggested to screen for significant conditions. The method is known as fractional factorial design (FFD) and is commonly used for product and process design and improvement [5]. Compared to the full factorial design, FFD reduces the number of experimental runs while providing interactions between studied factors [6]. Previous researchers have utilized this experimental design to determine significant conditions for desired reactions using living microorganisms [7,8]. The factors chosen in this study include initial pH, incubation time, agitation speed, and inoculum level, as these parameters are commonly used in other studies for this species [9–12].
Therefore, this study aims to detect the significant factors influencing Aspergillus tamarii biodegradation capabilities on AMX using FFD and the interactions between the screened variables.
MATERIALS AND METHOD
Experimental design
FFD was carried out to screen the four variables for A. tamarii to biodegrade AMX. FFD allows us to obtain critical factors which may influence the resulting response [13]. Each variable was tested at two levels: the maximum level (+) and the minimum level (−). The four factors include initial pH (4.00 and 8.00), agitation speed (120 and 200 rpm), incubation time (24 and 96 hours), and inoculum size (100μl and 1,000 μl). Therefore, 4 factors with 2 levels resulted in a total of 24 experimental runs with triplicates according to the formula 2(n-1), where n is the number of factors. The percentage biodegradation of amoxicillin (AMX%) was used as an experimental response for fractional factorial analysis. The range of selected parameters is summarized in Table 1. The experimental runs were prepared and carried out according to the design matrix generated by the statistical software Minitab (Version 18).
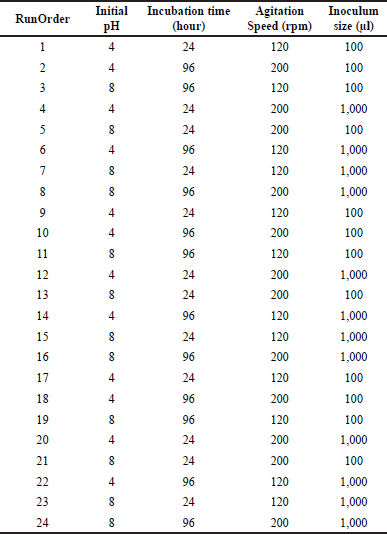 | Table 1. Experimental runs for FFD with a range of selected parameters were designed using Minitab (Version 18). [Click here to view] |
The significant factors in the current study were analyzed by Analysis of Variance (ANOVA) using the Minitab software. The variation between experimental and predicted data was determined using the correlation coefficient R2 at a significance level α = 0.05. All statistical analyses were conducted using the Minitab 18 software.
Fungal spore suspension preparation
Aspergillus tamarii was obtained from the Institute for Medical Research Shah Alam, Selangor. The fungus was prepared as described by Abd Hamid, Zulkifle et al. [14] and the stock solution is diluted to 1 × 10⁶ CFU/ml for biodegradation process usage.
Biodegradation assay
The biodegradation experiment will be conducted through the submerged fermentation technique indicated by Abd Hamid et al. [14]. First, the spore suspension of A. tamarii was inoculated into a 100.0 ml sterilized potato dextrose broth (Merck, Germany) medium in a 250 ml Erlenmeyer flask culture under aseptic conditions. The parameters for biodegradation studies were carried out according to the experimental design indicated in Table 1. After the first 72 hours of incubation, the AMX solution will be inserted into the same culture broth with a final AMX concentration of 100 ppm. The culture was further incubated according to the experimental design. After that, the sample was subjected to high-performance liquid chromatography (HPLC) analysis to determine the biodegradation percentage. The AMX% is calculated based on the following equation (Equation 1):
where AMX% is the percentage biodegradation of AMX, AMXi is the initial concentration of AMX (abiotic), and AMXf is the final concentration of AMX after the biodegradation process.
Partial purification and extraction of AMX residues
Liquid-liquid Extraction (LLE)
The AMX residues were treated with LLE according to Abd Hamid et al. [14] and Seifollahi et al. [15] methods with modifications. This technique was executed in a separating funnel by mixing 25 ml of HPLC-grade water with 25 ml of HPLC-grade ethyl acetate and 6 ml of biotransformation products. The mixture was shaken and settled down for 10 minutes to allow the formation of two layers of solvents. Each layer will be collected into a different 50.0 ml falcon tube and concentrated with a rotary evaporator to reduce pressure. Subsequently, concentrated AMX was dissolved in 3.0 ml of dimethyl sulfoxide. Next, the AMX residue was further purified in solid-phase extraction (SPE).
Solid-phase extraction
The residue was transferred into the C18 Hypersep SPE (CHROMABOND) cartridge preparation for a further clean-up step. The method was based on Zhang et al. [16] with slight modifications. A pre-conditioned SPE cartridge with 3.0 ml methanol and 3.0 ml of water was carried out before extraction. The sample volume of 4.0 ml was loaded into the column allowing it to pass through by gravity. Then, the cartridge was washed with 2 ml of HPLC-grade water and eluted with 3 ml acetonitrile (CAN). Extraction efficiency was measured using the method mentioned and obtained a 97.31% recovery percentage. The percentage recovery of AMX (AMXrec) was calculated using the following equation:
where AMXrec is the percentage recovery of AMX, a represents the concentration of AMX after separation while b represents the concentration of AMX without separation.
Quantitative analysis of AMX residues by HPLC
Preparation of AMX standard curve
The standard AMX solution was prepared by weighing approximately 100 mg of AMX powder and was transferred into a 250 ml Erlenmeyer shake flask containing 100 ml of 0.1 M KH2PO4 (pH 3.5). This resulted in a final AMX concentration of 1,000 ppm. The mixture was then filtered with a 0.45 μm nylon syringe filter and transferred into a 50 ml centrifuge tube. The tube was then wrapped with aluminum foil to prevent photolysis.
The AMX stock was subjected to different stock concentrations (ppm) ranging from 100 to 700 ppm using 5 points. Each point was measured in triplicates. The results were recorded, and the standard curve was plotted using the average area under the graph (mAU*s) versus the concentration of AMX standards. Then, the curve was evaluated by the coefficient of determination (R2).
High-performance liquid chromatography
This technique was conducted based on the Heaton et al. [17] method with modifications. The extraction was performed using a C18 Agilent analysis reverse phase column (ZOBRAX SB-C18, 5 μm, 4.6 × 250 mm). The contaminants in the column were washed and eluted using HPLC-grade ACN (60:40) for 10 minutes before the separation. The mobile-phase solvent was made using initial phosphate buffer (KH2PO4) and HPLC-grade ACN. The system was a constituent of 0.1 M phosphate buffer (pH 3.5) and ACN (40:60). Analytical High-Performance Liquid Chromatography (Agilent 1,200) was used to analyze the residues of AMX after biodegradation using a wavelength of 215 nm.
Statistical analysis and model fitting
Data analysis was determined by using the statistical software Minitab 18TM. The significance level of the full model term and adequacy checking of the FFD were determined by the F-value and p-value acquired from the ANOVA at a significance level of α = 0.05. ANOVA is a statistical method utilized for testing the differences between two or more factors by comparing of their means [18]. R2 and adjusted-R2 coefficients were used to determine the accuracy and quality of the model [19].
RESULTS AND DISCUSSION
FFD analysis of AMX degradation
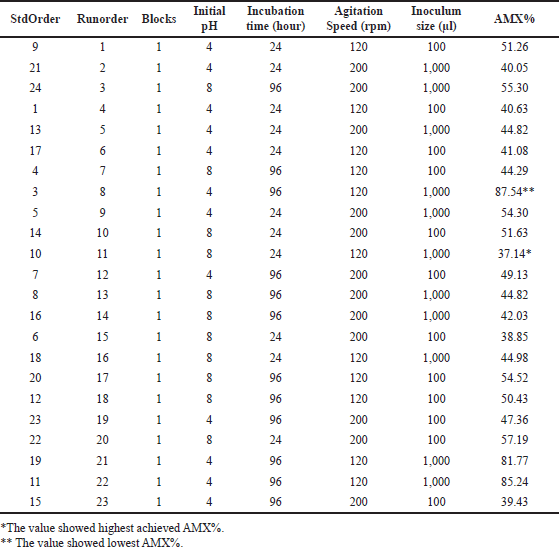
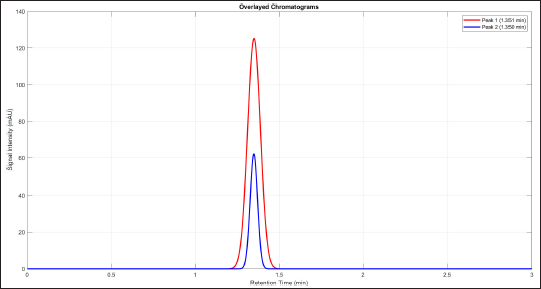
The experimental design of FFD is utilized to find the significant parameters and their unique interaction effects. The parameters and their values were identified according to previous studies as stated in the methodology section. Table 2 shows the experimental response (AMX%) of the 24-1 FFD design matrix were conducted with a total of 24 experimental runs were carried out. To reduce the effects of uncontrolled factors, the experimental sequence (Std Order) was randomized. Results indicate that the AMX% was in the range of 37.14%–87.54%. Figure 1 shows the chromatogram of both the highest and lowest amount of AMX residual. The red line is the highest amount of AMX residual (715.70 mAU*s), while the blue line is the lowest amount of AMX residual (179.70 mAU*s). Significant factors were evaluated on biodegradation percentage using the Minitab 18 software by a normal probability plot of standardized effects, a Pareto chart, main effects, and a contour plot at significance level α = 0.05.
 | Figure 1. Chromatogram for the highest and lowest AMX residual through HPLC. [Click here to view] |
 | Table 2. Design matrix for 24-1 FFD and AMX% measured. [Click here to view] |
Full regression model analysis
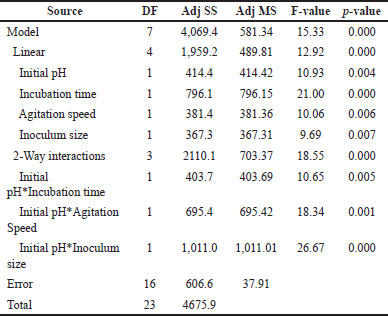
The full analysis of the regression model for AMX% was analyzed by ANOVA at significance level α = 0.05. According to Table 3, the value of p < 0.05 indicate that the model terms are significant to the response of this experiment. The high F and low p-values of the main effects and the two-way interactions suggest that they contribute significantly to the response (AMX%). The model F-value and p-value were recorded at 15.33 and 0.000, respectively. Thus, it shows that the regression model is statistically significant. The R2 value of the model was 0.8703 which indicates 87.03% of variations attributed to AMX% with 12.97% of the total variability could not explained be by the model.
 | Table 3. ANOVA of the reduced regression model for AMX% analysis of variance. [Click here to view] |
The study used both R2 and adjusted-R2 are used to predict the accuracy of the current regression model of fungal biomass in antibiotic biodegradation studies. The difference between R2 and adjusted-R2 values is 5.6% which denotes that there is a slight chance that non-significant terms have been inserted in the model and a good agreement between the actual and predicted values [20–22].
Pareto chart
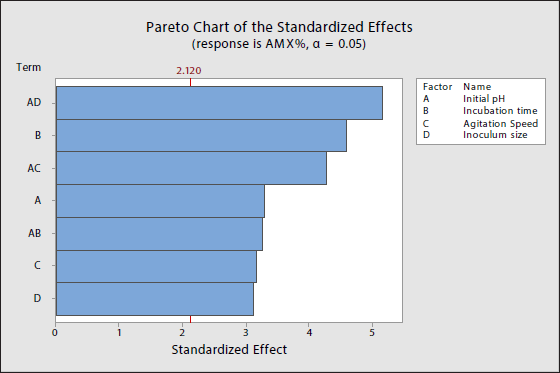
Figure 2 below displays the Pareto chart of standardized effects. The vertical line in the chart shows the minimum statistically significant effect value for the 0.05 significance level. On the other hand, the length of the horizontal column corresponds to the degree of significance for the effects, respectively. If the factor or interaction surpasses the vertical line, it is deemed to have a significant impact on the percentage of biodegradation or vice versa [23,24]. According to the chart, all effects and interactions are significant. The sequence corresponds to results obtained from the regression model in Table 4, showing that they are statistically significant, ranked in order of AD, B, AC, A, AB, C, and D being the least significant.
 | Figure 2. Pareto chart of the standardized effects for AMX%. [Click here to view] |
 | Table 4. Estimated effects and coefficients of the regression model for AMX [Click here to view] |
Main effects plot
Incubation time
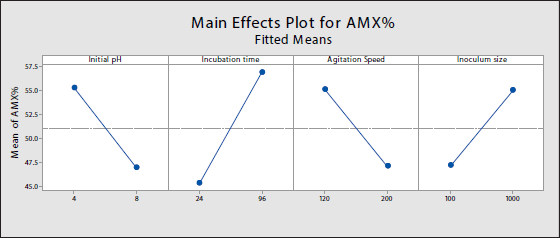
Incubation time has the most significant influence on AMX degradation. Table 3 shows the F-value and p-value of the main effect of incubation time at 21.00 and 0.000, respectively, which indicate that incubation time is statistically significant. Figure 3 also displays a steep increase in slope from 24 hours to 96 hours inferring that those 96 hours of incubation time offers a more significant percentage of biodegradation compared to 24 hours. Previous research also discovered that incubation time influences their desired reaction, and they achieved maximum response after a specific amount of time [25–27]. These studies suggest that a longer incubation period is not always ideal, especially when other parameters are not controlled. The activity of the enzymes may gradually decrease as time goes on due to the inactivation and denaturation of the protein 3-D structure. Therefore, having a specific incubation time may provide maximal results for a particular process.
 | Figure 3. Main effects plot for initial pH, incubation time, agitation speed and inoculum size. [Click here to view] |
Initial pH
Our Pareto chart displayed that initial pH is significant to the response. Table 3 shows an F-value of 10.93. with a p-value of 0.004 indicating that initial pH is statistically significant towards the AMX%. Figure 3 also displays a steep decreasing slope from initial pH 4.0 to 8.0 explaining that initial pH 4.0 offers maximum AMX% compared to initial pH 8.0. It has been known in previous literature that pH influences fungal growth, spore germination, organic acid, and enzyme production [28–31]. Despite being able to grow over a wide pH range, a high or low pH directly impacts the activity of enzymes secreted in the extracellular, as they have an optimal pH for maximum activity [32].
Agitation speed
Agitation speed significantly affects the response according to the respective F-value and p-value of 10.06 and 0.006 (Fig. 2 and Table 3). Figure 3 also displays a steep decreasing slope from 120 to 200 rpm, stating that 120 rpm offers an increased percentage of biodegradation compared to 200 rpm. Previous research supports that agitation speed influences the desired response [33,34]. Different agitation speeds change the morphology and the enzyme production of the fungi. The optimal agitation speed may provide good dissolved oxygen and nutrient distribution for the fungi simultaneously improving their growth and biomass [35]. Despite that, agitation may also induce shear stress changes in morphology, and possibly damage the cell structure [36].
Inoculum size
Inoculum size comes last compared to other parameters. However, this factor still significantly affects the response of this experiment with F-values and p-values of 9.69 and 0.007, respectively, according to Figure 2 and Table 3. Figure 3 also displays a steep increasing slope from 100 µl to 1,000 µl, suggesting that 1,000 µl of inoculum size offers a higher percentage of biodegradation compared to 100 µl. According to previous literature, fermenting low inoculum size may cause insufficient cell culture to utilize the available substrate for cellular growth. On the other hand, high inoculum size may cause an increase in the viscosity of the medium due to an increase in fungal growth, which affects the nutrient uptake of the cells excessively when the cells are not ready for enzyme production [25,37,38].
Contour plots
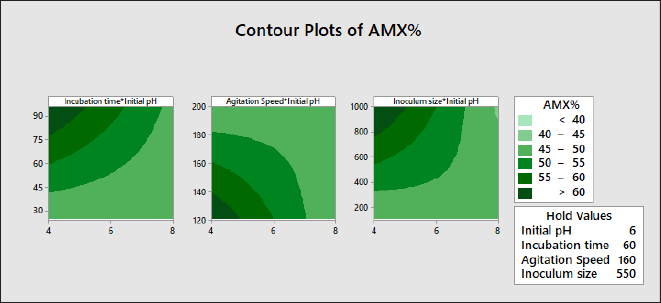
The contour plot is generated and visualized to study the interaction terms as displayed in Figure 4. The darker colors indicate a higher AMX% values. The hold values are variables that is not on the plot constant, as the plot can only include two continuous variables.
 | Figure 4. Contour plots for incubation time*initial pH, agitation speed*initial pH and inoculum size*initial pH. [Click here to view] |
Inoculum size and initial pH
The interaction between inoculum size and initial pH significantly affects the response according to the Pareto chart in Figure 2 and ANOVA (Table 3) with F-value of 26.67 and a p-value 0.000. Figure 4 displays that the maximum AMX% is achieved at the upper left of the plot with inoculum size at 1,000 µl and initial pH at 4.0.
Agitation speed and initial pH
The interaction between agitation speed and initial pH has a significant effect on the response, with F-value of 18.34 and a p-value less than 0.05 (p = 0.001) as shown in Figure 2 and Table 3. Maximum AMX% is achieved at the bottom left of the plot with agitation speed at 120 rpm and initial pH at 4.0, as shown in Figure 4.
Incubation time and initial pH
The interaction between incubation time and initial pH has a significantly affects the response according to the Pareto chart in Figure 2. Table 3 supports the previous statement, showing an F-value of 10.65 with a p-value less than 0.05 (p = 0.005). According to Figure 4, the maximum AMX% is achieved at the upper left of the plot with an incubation time of 96 hours and an initial pH of 4.0.
Regression model for percentage of AMX degradation
Table 4 presents the estimated effects and regression coefficients (Coef) including the standard deviation (SDcoef), t-statistics (T), and probability (p) values, for the main effects and second-order interaction terms. The Minitab software generates the regression equation (3) from the least squares method.
Model adequacy checking
Model adequacy is evaluated by the residual plots. Although a histogram can be utilized, its limitations, especially with a small sample size, cause the plot to fluctuate in shape and does not indicate any serious violation of the assumption [39]. Therefore, the normal probability plot is used, as it is a more effective and straightforward procedure. Figure 5 shows a normal probability plot of the standardized residual. The plot displays that all points are plotted close to the straight line. The plot also shows an outlier which slightly escapes the range within the interval of –2 and +2. Normally, removing the outlier would produce a normally distributed plot, however, it could be assumed that the outlier is a natural part of the data. It could also be a calculation mistake, copying, or a data coding error [39].
 | Figure 5. Normal probability plot of standardized residuals. [Click here to view] |
Best condition and validation experiment
In Figure 6, Minitab software generated the best condition, offering maximum response AMX% by A. tamarii. The plot produced a combination set of optimal parameters: an initial pH 4.0, an agitation speed of 120 rpm, an incubation time of 96 hours, and an inoculum size of 1,000 µl. Provided these conditions are utilized, the model predicts y = 84.850 for the biodegradation percentage of AMX using A. tamarii. In the validation experiment, a triplicate run was carried out. The AMX% was consistent with the FFD runs which were 82.78%, 77.65%, and 83.11%. Results showed that the conditions were one of the best yet in achieving optimum AMX% using A. tamarii. Hence, the FFD model utilized in this study is successful in finding the best conditions for maximum percentage biodegradation of AMX by A. tamarii.
 | Figure 6. Response optimizer for AMX%. [Click here to view] |
CONCLUSION
FFD was conducted to identify significant factors affecting the AMX% by A. tamarii. A 24-1 FFD halved the number of experimental runs to 24 including triplicates. The design has resulted that all parameters; initial pH, agitation speed, incubation time, and inoculum size are significant to the response by the order of incubation time > initial pH > agitation speed > inoculum size. Furthermore, a regression model was calculated with R2 and R2(adj) of 87.03% and 81.35%, respectively, sufficient to predict the fractional factorial model for the current studies [40] . Using the conditions (initial pH 4.0, 120 rpm, 96 hours, and 1,000 µl), we achieved maximum percentage biodegradation with an average of 81.37% ± 1.61% (mean±SE). The findings displayed that A. tamarii has excellent potential for applications in wastewater treatment due to its ability to degrade β-lactam antibiotics.
ACKNOWLEDGMENT
The authors would like to thank Universiti Teknologi MARA, the Ministry of Higher Education Malaysia and Institute for Medical Research.
AUTHOR CONTRIBUTIONS
All authors contributed significantly to the work’s concept and design, data collection, analysis, and interpretation, as well as its drafting and critical revision for key intellectual content, and the final approval of the published version. All authors have agreed to be accountable for all parts of the work and have participated to ensure that questions about the work’s accuracy or integrity are adequately investigated and resolved. All are entitled to be specified as authors according to the International Committee of Medical Journal Editors’ guidelines (ICMJE).
FINANCIAL SUPPORT
This research study was fully funded by 600-RMC/GIP 5/3 (013/2023), Universiti Teknologi MARA (UiTM), and the Ministry of Higher Education Malaysia.
CONFLICTS OF INTEREST
The authors report no financial or any other conflicts of interest in this work.
ETHICAL APPROVAL
This study does not involve experiments on animals or human subjects.
DATA AVAILABILITY
This research article presents all the data that was generated and examined.
PUBLISHER’S NOTE
Publisher’s Note: All claims expressed in this article are solely those of the authors and do not necessarily represent those of the publisher, the editors and the reviewers. This journal remains neutral with regard to jurisdictional claims in published institutional affiliation.
USE OF ARTIFICIAL INTELLIGENCE (AI)-ASSISTED TECHNOLOGY
The authors declares that they have not used artificial intelligence (AI)-tools for writing and editing of the manuscript, and no images were manipulated using AI.
REFERENCES
1. Papich MG. Chapter 39—Antimicrobial drugs. In: Washabau RJ, Day MJ, editors. Canine and feline gastroenterology. Saint Louis, MI: W.B. Saunders; 2013. pp. 471–6. CrossRef
2. Bielen A, Šimatovi? A, Kosi?-Vukši? J, Senta I, Ahel M, Babi? S, et al. Negative environmental impacts of antibiotic-contaminated effluents from pharmaceutical industries. Water Res. 2017;126:79–87. CrossRef
3. Verma M, Haritash AK. Photocatalytic degradation of Amoxicillin in pharmaceutical wastewater: a potential tool to manage residual antibiotics. Environ Technol Innov. 2020;20:101072. CrossRef
4. Chowdhury J, Mandal TK, Mondal S. Genotoxic impact of emerging contaminant amoxicillin residue on zebra fish (Danio rerio) embryos. Heliyon. 2020;6(11):e05379. CrossRef
5. Salleh EM, Zuhailawati H, Ramakrishnan S. Synthesis of biodegradable Mg-Zn alloy by mechanical alloying: statistical prediction of elastic modulus and mass loss using fractional factorial design. Trans Nonferrous Met Soc China. 2018;28(4):687–99. CrossRef
6. Echeverría JC, Moriones P, Garrido JJ, Ugarte MD, Cervera L, Garaio E, et al. Steering the synthesis of Fe3O4 nanoparticles under sonication by using a fractional factorial design. Mat Chem Phys. 2021;270:124760. CrossRef
7. Srinivasan A, Viraraghavan T. Oil removal from water by fungal biomass: a factorial design analysis. J Hazard Mater. 2010;175(1):695–702. CrossRef
8. de Oliveira Rodrigues P, Gurgel LVA, Pasquini D, Badotti F, Góes-Neto A, Baffi MA. Lignocellulose-degrading enzymes production by solid-state fermentation through fungal consortium among Ascomycetes and Basidiomycetes. Renewable Energy. 2020;145:2683–93. CrossRef
9. Das A, Bhattacharya S, Shivakumar S, Shakya S, Sogane SS. Coconut oil induced production of a surfactant-compatible lipase from Aspergillus tamarii under submerged fermentation. J Basic Microbiol. 2017;57(2):114–20. CrossRef
10. Shanmugavel M, Vasantharaj S, Yazhmozhi A, Bhavsar P, Aswin P, Felshia C, et al. A study on pectinases from Aspergillus tamarii: toward greener approach for cotton bioscouring and phytopigments processing. Biocatal Agri Biotechnol 2018;15:295–303. CrossRef
11. El-Sharkawy RM, Swelim MA, Hamdy GB. Aspergillus tamarii mediated green synthesis of magnetic chitosan beads for sustainable remediation of wastewater contaminants. Sci Rep 2022;12(1):1–15. CrossRef
12. Mohan R, Subramanian R, Muthiah S, Natarajan S. Enhancement of α-amylase production in pelleted Aspergillus tamarii through optimization for desizing of cotton fabric. J Environ Biol. 2019;40(5):1084–93. CrossRef
13. Gunst RF, Mason RL. Fractional factorial design. Wiley Interdiscip Rev Comput Stat. 2009;1(2):234–44.
14. Abd Hamid AHH, Zulkifle NT, Mahat MM, Safian MF, Ariffin ZZ. Aspergillus tamarii isolate 58 and Lichtheimia ramosa strain R: a potential amoxicillin biodegrader. J Appl Pharm Sci. 2023;13(10):149–56. CrossRef
15. Seifollahi Z, Abbasi A, Rahbar-Kelishami A. Application of solvent extraction for the removal of amoxicillin drug residues in environmental waters. Iran J Pharm Sci. 2019;15(4):41–52. CrossRef
16. Zhang C, Zeng J, Xiong W, Zeng Z. Rapid determination of amoxicillin in porcine tissues by UPLC-MS/MS with internal standard. J Food Comp Anal. 2020;92:103578. CrossRef
17. Heaton JC, Smith NW, McCalley DV. Retention characteristics of some antibiotic and anti-retroviral compounds in hydrophilic interaction chromatography using isocratic elution, and gradient elution with repeatable partial equilibration. Anal Chim Acta. 2019;1045:141–51. CrossRef
18. Mercado Rueda AP. Chapter 31—Analysis of variance: ANOVA. In: Eltorai AEM, Bakal JA, DeFroda SF, Owens BD, editors. Translational sports medicine. London, UK: Academic Press; 2023. pp. 157–60. CrossRef
19. Samarghandi MR, Dargahi A, Shabanloo A, Nasab HZ, Vaziri Y, Ansari A. Electrochemical degradation of methylene blue dye using a graphite doped PbO2 anode: optimization of operational parameters, degradation pathway and improving the biodegradability of textile wastewater. Arabian J Chem. 2020;13(8):6847–64. CrossRef
20. Myers RH, Montgomery DC, Anderson-Cook CM. Response surface methodology: process and product optimization using designed experiments. 4 ed: Hoboken, NJ: John Wiley & Sons; 2016.
21. Plonsky L, Ghanbar H. Multiple regression in L2 research: a methodological synthesis and guide to interpreting R2 values. The Mod Lang J. 2018;102(4):713–31. CrossRef
22. Singh RS, Chauhan K, Kaur K, Pandey A. Statistical optimization of solid-state fermentation for the production of fungal inulinase from apple pomace. Bioresour Technol Rep. 2020;9:100364. CrossRef
23. Adio SO, Omar MH, Asif M, Saleh TA. Arsenic and selenium removal from water using biosynthesized nanoscale zero-valent iron: a factorial design analysis. Process Saf Environ Prot. 2017;107:518–27. CrossRef
24. Razali SA, Rasit N, Ooi CK. Statistical analysis of xylanase production from solid state fermentation of rice husk associated fungus Aspergillus niger. Mater Today: Proc. 2021;39:1082–7. CrossRef
25. Melnichuk N, Braia MJ, Anselmi PA, Meini MR, Romanini D. Valorization of two agroindustrial wastes to produce alpha-amylase enzyme from Aspergillus oryzae by solid-state fermentation. Waste Manag. 2020;106:155–61. CrossRef
26. Lahouar A, Marin S, Crespo-Sempere A, Saïd S, Sanchis V. Effects of temperature, water activity and incubation time on fungal growth and aflatoxin B1 production by toxinogenic Aspergillus flavus isolates on sorghum seeds. Revista Argent Microbiol. 2016;48(1):78–85. CrossRef
27. Barman S, Sit N, Badwaik LS, Deka SC. Pectinase production by Aspergillus niger using banana (Musa balbisiana) peel as substrate and its effect on clarification of banana juice. J Food Sci Technol. 2015;52:3579–89. CrossRef
28. Kosegarten CE, Ramírez-Corona N, Mani-López E, Palou E, López-Malo A. Description of Aspergillus flavus growth under the influence of different factors (water activity, incubation temperature, protein and fat concentration, pH, and cinnamon essential oil concentration) by kinetic, probability of growth, and time-to-detection models. Int J Food Microbiol. 2017;240:115–23. CrossRef
29. Stevenson A, Hamill PG, Dijksterhuis J, Hallsworth JE. Water-, pH-and temperature relations of germination for the extreme xerophiles Xeromyces bisporus (FRR 0025), Aspergillus penicillioides (JH 06 THJ) and Eurotium halophilicum (FRR 2471). Microb Biotechnol. 2017;10(2):330–40. CrossRef
30. Banjo T, Kareem S, Akinduti P, Popoola T, Akinloye O. Optimization and production of ascorbic acid by fusant cell of Aspergillus flavus and Aspergillus tamarii. J King Saud Univ Sci. 2019;31(4):931–6. CrossRef
31. Akasaka N, Kato S, Kato S, Hidese R, Wagu Y, Sakoda H, et al. Agmatine production by Aspergillus oryzae is elevated by low pH during solid-state cultivation. Appl Environ Microbiol. 2018;84(15):e00722–18. CrossRef
32. Markina-Iñarrairaegui A, Spielvogel A, Etxebeste O, Ugalde U, Espeso EA. Tolerance to alkaline ambient pH in Aspergillus nidulans depends on the activity of ENA proteins. Sci Rep. 2020;10(1):14325. CrossRef
33. Miranti A, Arbianti R, Utami TS, editors. Effect of pH, temperature and medium agitation rate in production of AA, DHA, EPA from Aspergillus oryzae with submerged fermentation. IOP Conf Series Earth Environ Sci. 2018;105(1):012113. CrossRef
34. A’yuni H, Ilmi M, editors. Lipase production from Aspergillus aculeatus Ms. 11 in broth medium with variation of agitation speed. AIP Conf Proc. 2021;2353:030081. CrossRef
35. Darah I, Sumathi G, Jain K, Lim S. Influence of agitation speed on tannase production and morphology of Aspergillus niger FETL FT3 in submerged fermentation. App Biochem Biotechnol. 2011;165:1682–90. CrossRef
36. Ibrahim D, Weloosamy H, Lim SH. Effect of agitation speed on the morphology of Aspergillus niger HFD5A-1 hyphae and its pectinase production in submerged fermentation. World J Biol Chem. 2015;6(3):265. CrossRef
37. Dinarvand M, Rezaee M, Foroughi M. Optimizing culture conditions for production of intra and extracellular inulinase and invertase from Aspergillus niger ATCC 20611 by response surface methodology (RSM). Brazil J Microbiol. 2017;48:427–41. CrossRef
38. Adeoye A, Lateef A, Gueguim-Kana E. Optimization of citric acid production using a mutant strain of Aspergillus niger on cassava peel substrate. Biocatal Agri Biotechnol. 2015;4(4):568–74. CrossRef
39. Montgomery DC. Design and analysis of experiments 9ed: Hoboken, NJ: John wiley & sons; 2017.
40. Almasi A, Mohammadi M, Baniamerian F, Berizi Z, Almasi M, Pariz Z. Modeling of antibiotic degradation in sonophotocatalytic process, increasing biodegradability and process optimization by response surface methodology (RSM). Int J Environ Sci Technol. 2019;16:8437–48. CrossRef