INTRODUCTION
Lenalidomide (LND) falls under the category of immunomodulatory drugs. It serves as a therapeutic agent for various medical conditions, including cancer types such as blood cancer and myelodysplastic syndromes (MDS), a group of disorders characterized by abnormal blood cell production. LND exerts its effect by slowing cancer progression and enhancing the production of healthy blood cells [1]. This is achieved through its ability to modify the immune system and the bone marrow microenvironment. Multiple mechanisms of action are at play, encompassing increased immune cell activity, controlled production of cytokines and growth factors, and the inhibition of new blood vessel formation that sustains tumors (anti-angiogenic effects). Given its potency, LND necessitates meticulous administration and monitoring under the supervision of a healthcare professional well-versed in its usage and potential side effects. Possible adverse effects of LND include weakness, rash, diarrhea, neutropenia (a decrease in white blood cell count), thrombocytopenia, anemia, and an elevated risk of blood clots [2].
Nanopharmaceuticals are rapidly emerging as a groundbreaking and promising treatment approach [3,4]. Nanoformulations offer a more favorable drug release profile while also enhancing drug penetration and retention. Scientific literature has documented the enhanced efficacy of nanoformulated anti-cancer drugs, attributing this improvement to the enhanced targetability of the formulation and increased bioavailability [5,6].
Mesoporous silica nanoparticles (MSNs) possess a structural resemblance to the cells of a honeycomb due to their silica (SiO2) framework [7]. This inherent porosity, along with their adaptability in terms of size and shape, biocompatibility, and expanded surface area, offers a range of advantages. Notably, their extensive surface area, derived from their porous structure, facilitates the attachment of functional groups to MSNs. Drug loading into the core or onto the surface of MSNs can be achieved through several feasible mechanisms, including electrostatic adsorption, hydrophobic interactions, and covalent binding. LND was loaded in the MSNs using the sol–gel-based method [8]. The structure of the drug is illustrated in Figure 1.
Numerous analytical techniques can be employed for drug quantification within the formulation, including UV spectrophotometry, reverse-phase (RP)-HPLC, HPTLC, and LC-MS/MS methods. However, a limited body of literature addresses the estimation of LND from MSNs. The objective and novelty of this study were to quantify LND by RP-HPLC method attached with a photodiode array (PDA) detector from the MSNs using the Design of expert (DoE) tool. We validated this method following the guidelines outlined in International Conference on Harmonization (ICH) Q2 R1 and further optimized it through the utilization of a Central Composite design (CCD). The method was developed specifically for the quantification of LND from MSNs. The application of DoEs involves statistical tools that aid in identifying and exploring critical factors during the development of analytical methods [9,10]. DoE plays a crucial role in the analytical process, beginning with the preliminary screening and determining important chromatographic characteristics and extending to optimization and the assessment of robustness, as documented in numerous instances. The properties of LND are shown in Table 1.
Prasad and their research group have previously reported a quantification method for LND using a DoEs-based analytical approach [11]. Notably, this represents the sole instance of utilizing a quality by design method for LND analysis. However, their analysis is primarily objective to resolving and evaluating impurities associated with LND, rather than quantifying the drug itself [12]. Consequently, a suitable HPLC analytical procedure for quantifying LND and other drug components within nanoformulations, employing DoE, was presumed to be unavailable. To establish optimal chromatographic conditions, a central composite response surface design was used [13,14]. Furthermore, a stress-induced degradation test was conducted to check the stability and specificity of the developed analytical method in quantifying LND amidst potentially degraded products when the drug was exposed to various stressors. This optimized and validated analytical method was subsequently employed to quantify LND within MSNs.
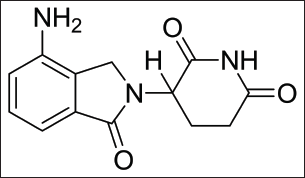 | Figure 1. Pictorial representation of LND. [Click here to view] |
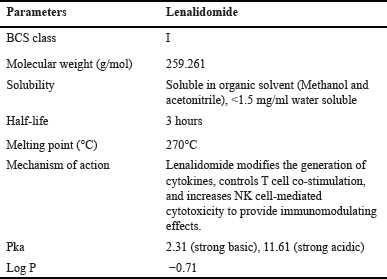 | Table 1. Physicochemical properties of lenalidomide. [Click here to view] |
MATERIAL AND METHODS
Material and reagents
LND (off-white powder; purity > 98%) was procured from Apicore Pharmaceutical Ltd (Vadodara, Gujarat). The supplier of sodium hydroxide pellets (purity ≥98%), orthophosphoric acid (88%), and potassium dihydrogen phosphate (purity >98%) was Merck Ltd. located in Mumbai, India. Finar supplied the HPLC-grade organic solvent (acetonitrile and methanol). The Milli-Q (Type 1 water) was produced in a laboratory. Finar Ltd. (Ahmedabad, India) supplied 35% pure AR hydrochloric acid. We purchased a membrane filter of 0.45 μm from Riviera Glass Pvt. Ltd (Mumbai, India). 120 Å, 250 mm × 4.6 mm, 5 µm particle size Spherisorb ODS C18 column. Cetyltrimethylammonium bromide (CTAB) was procured from TCI Pharmaceuticals, Tokyo Chemical Industry (India) Pvt. Ltd (Japan), Tetraethylorthosilicate (TEOS) was acquired from Sisco Research Laboratories Pvt. Ltd. (SRL) (Mumbai, India), Triethanolamine was acquired from Loba Chemie Pvt. Ltd., Mumbai, India,
Methods
Instrumentation and apparatus
The Shimadzu HPLC system LC20-AD was attached with a PDA detector (SPD-20A & SPD-M10A) and the software used for the analysis was LabSolution. All the chemicals used in the analysis were weighed carefully on the calibrated weighing balance (Sartorius Mechatronics CP225D, India). The prepared buffer solution was filtered through a glass vacuum filtration assembly unit, the 0.45 µm membrane filter was used. Ultrsonicator (servewell instruments, India) was used to degas the solvents for 10 minutes. A calibrated pH meter from Systronics India Ltd (Ahmedabad, India) was used to check the pH of the mobile phase.
Analytical methods for estimation of LND
To find the correct wavelength for the estimation of LND, to achieve a concentration of 10 µg/ml, the produced working stock solution was utilized and further diluted. Using water as a blank, the final solution was produced and examined in a double-beam UV-Vis spectrophotometer (UV-1,800) operating in the range of 190–800 nm to identify absorption maxima (λmax).
Screening of mobile phase and stationary phase
Considering the pKa value of LND (2.31), buffers with pH +/- of the pKa value such as 10 mM Ammonium acetate pH 5.5 were tried. Stationary phases such as the Spherisorb ODS C18 column were tried as the stationary phase. Isocratic mode was used for all indicated experiments, and the autosampler temperature was set to 10°C.
Preparation of standard solution for the drug
Accurately, 10 mg of LND dissolved in 10 ml of methanol obtained a 1 mg/ll (1,000 µg/ml) concentration for the primary stock solutions. Then, for 2 minutes, the drug solution was vortexed. As a further step, we created working stock solutions of LND by diluting the primary stock solutions to concentrations between 0.6 and 12 µg/ml with the suitable diluent.
Selection of critical independent variables
According to the literature review, preliminary trials were used to examine the effect of varying processing parameters on outcomes, including peak area, retention time, and resolution (15–17). These parameters included ratio, organic phase ratio (methanol/ACN), flow rate, column temperature, and injection volume. Also, a working range was established for each variable, and a one-factor-at-a-time (OFAT) analysis was accomplished to select these independent variables and find those significantly affecting the method outcomes [18].
Chromatographic conditions optimized with the help of CCD
An ideal chromatographic approach for estimating analytes requires determining and analyzing the crucial parameters that cause effective elution of LND. Several time-consuming experiments could be performed without an experimental design. One must refine the identified critical variables to get reliable experimental parameters as part of an optimized method. Optimizing values for these essential parameters in HPLC requires knowledge of the chemistry of individual components and their relationships. DoE is a mathematical method that may help you make sense of these varied complexity levels. Several types of response surfaces are used in DoE to help find the sweet spot of parameter space where a reliable response may be obtained. Two potential methods are CCD and Box Behnken design (BBD) [13,19]. The design was quadratic to evaluate the effect of both independent and interactive variables. A more accurate picture emerges from this analysis since it ignores the outlier values of the variables. Therefore, Design of Experiments software was utilized to fine-tune the CCD model strategy. Four variables were used as independent in this optimization process: buffer phase ratio (X1), buffer pH (X2), flow rate (X3) and injection volume (X4. The retention time (Rt) of LND (Y1), peak area of LND (Y2), and theoretical plate (Tp) (X3) were obtained at the same time.
Method validation as per ICH guidelines ICH Q2(R1)
According to ICH Q2(R1) guidelines, the developed and optimized RP-HPLC analytical method of LND was validated [1]. System suitability
This helps to check whether the system is suitable for the method development. In this validation parameter, six samples of the LND were injected with a concentration of 1 µg/m. The tailing factors (Tf), theoretical plate (Tp), and retention time (Rt) were calculated for a standard solution of LND.
Specificity and selectivity
Analyzing the blank interference helped determine the analytical method specificity. Three duplicate injections of blank diluent were analyzed at LND retention time.
Linearity
Five sets of injections were performed with varying doses of standard drug solution (0.5–16 µg/ml) to determine linearity. A linear calibration curve covered the whole concentration range. Peak area (y) was analyzed in relation to concentration (x) using a regression model.
Accuracy
Three injections of the known concentration (1 µg/ml) at concentrations of 80%, 100%, and 120% were used to assess the accuracy of the procedure. RSD and recovery percentages were determined.
Precision (Interday and Intraday)
The precision of the method was determined by injecting the standard sample of 1 µg/ml intra-day and inter-day. Six-time samples were injected at three different concentrations (80%, 100%, and 120%).
LOD and LOQ
To determine the limits of detection (LOD) (Equation 1) and limit of quantification (LOQ) (Equation 2), the slope and standard deviation of the responses were utilized.
Robustness
The current method’s sensitivity was investigated by changing chromatographic parameters slightly at a time, and it has been shown to be reliable under typical situations (20).
1) Change in the pH 6.35 and 6.45
2) Change in the temperature 24 and 26
3) Change in the flow rate 0.8 and 1
4) Change in the injection volume 14 and 16
5) Change in the wavelength +1 and -1.
Stability studies
Bench-top stability
To evaluate the LND stability in a reference solution on a laboratory bench. The sample (1 µg/ml) was kept at room temperature. The freshly (1 µg/ml) prepared and bench-top samples were injected into HPLC in triplicates after 24 hours [21].
The peak area observed after 24 hours corresponds to the old standards, while the freshly prepared sample exhibits an average peak area of the newly prepared sample. The amount of drug represents the concentration of the drug in old and newly prepared samples.
Stress-induced degradation studies
The established analytical method performance that indicates stability was assessed by subjecting a standard drug solution containing 1 µg/ml of LND to different stress conditions in accordance with ICH recommendations. The stress-induced degradation studies conducted under acidic degradation (0.1 N HCl and 1 N HCl) [21], basic degradation (0.1 N NaOH and 1 N NaOH) [22,23], oxidative hydrolysis (3% H2O2) [24,25], photolytic degradation [26], and thermal degradation 40°C. In each degradation study, a 1 ml standard stock solution of LND with a concentration of 1 µg/ml was employed. Following the addition of 1 ml of each stressor to the drug solution, it was heated to 60°C for approximately 24 hours [27]. The resulting solution was subsequently neutralized and diluted, and the samples were injected into the HPLC for the stability analysis [28,29].
Application of the developed RP-HPLC analytical method
Fabrication of MSNs
MSNs were fabricated using a sol-gel technique. This procedure involved mixing deionized water with CTAB and NaOH, gradually adding TEOS, and stirring at 800 rpm for 2 hours at 78°C. The formulation was centrifuged at 10,000 rpm for 10 minutes, washed 3 times, and dried using a hot air oven at 600C for 24 hours. Later, the formulation was kept for calcination in a muffle furnace at 550°C for 3 hours. Dependent factors such as particle size, zeta potential, and polydispersity index were used to fabricate the placebo MSNs.
Preparation for LND loaded MSNs
The drug, LND loading into MSNs was done using the incubation method. Briefly, 3 mg of LND was dissolved in 1 ml of ethanol. Furthermore, this solution was incubated in 2 mg of MSNs ethanol solution. The step was followed by sonication of MSNs for 5 minutes and stirring of MSNs dispersion at 500 rpm for 24 hours at room temperature. The resultant dispersion was centrifuged at 15,000 rpm for 10 minutes. The step was followed by washing the precipitate with ethanol three times. Finally, the fabricated LND-loaded MSNs (LND@MSNs) were characterized and optimized using dependent variables such as particle size, zeta potential, and PDI [30–32].
Determination of % entrapment efficiency (% EE) and % Drug loading (% Dl)
After the loading procedure, the dispersion was centrifuged at 15,000 rpm for 10 minutes, and the LND remaining in the supernatant (unentrapped LND) was determined using the developed HPLC method. The % EE (Equation 4) and % DL (Equation 5) of LND in MSNs were determined using the following formula [33,34]:
Scanning electron microscopy (SEM) analysis
SEM was used to evaluate the surface characteristics of the fabricated MSNs. The samples were prepared for SEM by applying MSNs on an aluminum counterfoil. The sample was examined using a scanning electron microscope (SEM) (EVO MA18, Zeiss) after a thin layer of gold was deposited using a gold sputtering coater [35,36].
RESULTS AND DISCUSSION
Method development
The LND absorbance maxima were determined to be 219 nm using a UV-Vis spectrophotometer.
Selection of mobile phase and stationary phase
During the development of the analytical method for LND, we explored various alternative mobile phases. The first attempt involved utilizing a phosphate buffer and acetonitrile/methanol at different ratios, but this resulted in LND eluting in the dead volume with a high tailing factor.
Subsequently, we tested an alternative approach using an ammonium acetate buffer and acetonitrile/methanol as the mobile phase. However, this combination caused the buffer and acetonitrile to elute LND in the dead volume, resulting in poor symmetry and a plate count of less than 2,000. In a final trial, we experimented with different ratios of ammonium acetate and methanol as the mobile phase. This approach successfully yielded elution of LND after only 3 minutes, with a tailing factor of less than 2 and a theoretical plate count exceeding 2,000, meeting the acceptance criteria. Initially, we employed a generally used C18 stationary phase (250 mm × 4.6 mm i.d., 5 μm particle size, Waters), which produced peak LND properties that met the required criteria. Further refinement and optimization of the chromatographic conditions were carried out using DoE methodology.
Method optimization by CCD
The optimization technique employed in this method development directly impacts the independent parameters influenced by the chromatographical results. Previously reported analytical methods for the LND quantification did not mention the effect of independent variables such as buffer ratio and flow rate. These factors can significantly affect the drug peak properties such as peak area and retention time. The absence of a comprehensive understanding of these pivotal method parameters compromises the method’s robustness, elevating the risk of method failure when applied in different settings. Therefore, it is imperative to identify and thoroughly investigate these influential factors to establish a reliable and resilient analytical method for precise LND estimation.
In this present study, we used a three-level CCD to optimize specific independent factors: buffer ratio (X1), buffer pH (X2), flow rate (X3), and injection volume (X4). The upper and lower limit values for these pivotal parameters were determined based on the results obtained from preliminary OFAT trials. We established a lower limit of 60% in the mobile phase for the buffer ratio and an upper limit of 70%. Buffer pH spanned from 5.3 (lower limit) to 5.8 (upper limit), while the flow rate ranged from 0.8 ml/minute (lower limit) to 1 ml/minute (upper limit). Injection volume covered 5 µl (lower limit) to 10 µl (upper limit). However, relying exclusively on OFAT-based approaches can be laborious and challenging. Therefore, the incorporation of CCD and other response surface designs expedites the optimization process and enhances the development of a robust analytical technique.
There were 25 trial runs carried out in all, with one center point. Table 2 presents the specifics of these trial runs along with the replies that went along with them. Significant interactions between the independent variables were found using the Analysis of variance (ANOVA) analysis, and the observations are shown in Table 3.
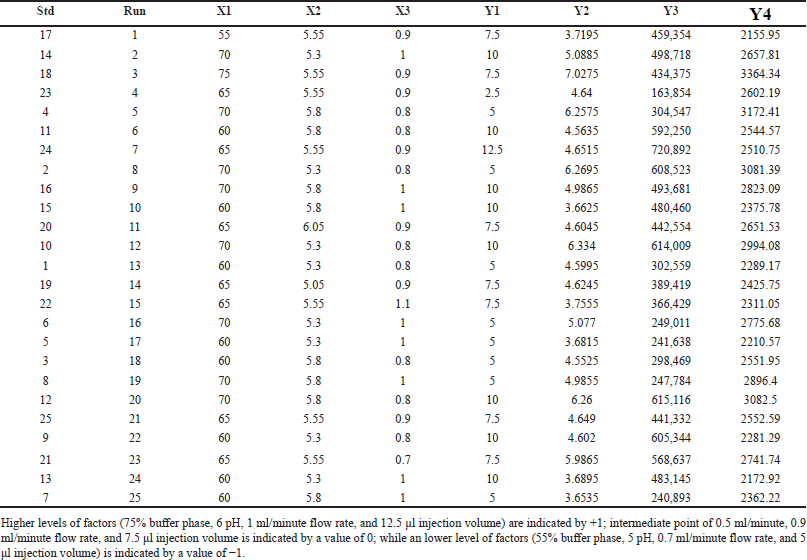 | Table 2. Independent variables recommended by the DoE and the associated responses. [Click here to view] |
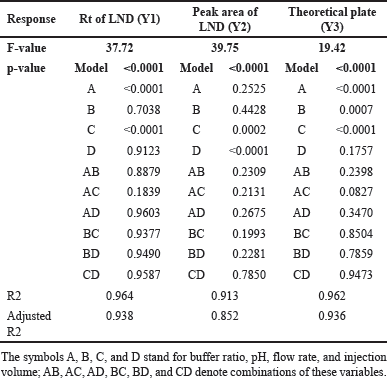 | Table 3. ANOVA results of central composite design. [Click here to view] |
Impact of independent factors on Rt of LND (Y1)
The quadratic equation (Equation 6) and ANOVA analysis revealed the independent factors, buffer ratio (X1), and flow rate (X3), demonstrating an effect on the Rt of LND. Conversely, buffer pH (X2) and injection volume (X4) had a lesser impact on retention time. Specifically, an increase in buffer ratio and a decrease in flow rate led to an extended retention time for LND. In this study, we altered X1 and X3 values from 55% to 75% and from 0.8 to 1 ml/minute, resulting in a shift in Rt from 3.25 to 7.02 minutes. The effects of these independent variables, X1 and X3, are depicted in the 3D and perturbation plots shown in Figures 2a and 3a.
Y1 = +4.88 + 0.7863 × A–0.0192 × B–0.5448 × C + 0.0055 × D–0.0087 × AB–0.0846 × AC + 0.0031 × AD–0.0048 × BC–0.0039 × BD + 0.0032 × CD Equation (6)
Impact of independent factors on the peak area of LND (Y1)
The quadratic equation (Equation 7) ANOVA analysis revealed that independent variables, flow rate (X3) and injection volume (X4), exhibited a significant impact on the peak area of LND. Conversely, buffer ratio (X1) and buffer pH (X2) had a relatively minor effect on the LND peak area. Specifically, a decrease in flow rate (X3) and an increase in injection volume (X4) led to an augmentation in the peak area of LND. In this study, we adjusted X3 and X4 values from 0.8 to 1 ml/minute and 5 to 10 µl, increasing the peak area from 163,854 to 720,892. The effects of these independent variables, X3 and X4, are visually depicted in the 3D and perturbation plots featured in Figures 2b and 3b.
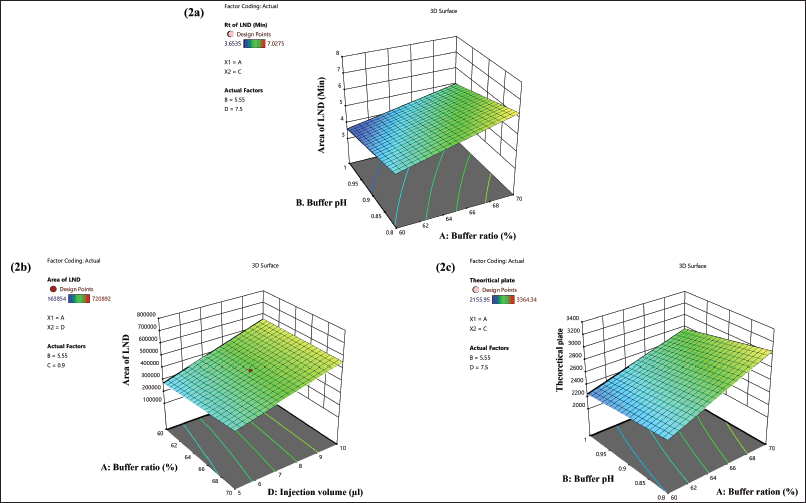 | Figure 2. 3D surface response graphic illustrating how independent factors have an impact: (2a) on the retention time of LND, (2b) on the peak area of LND, and (2c) on the theoretical plate of LND. [Click here to view] |
Y2 = +4.34 + 14028.13× A–9311.58 × B–58745.96 × C + 1.251 × D–18782.13 × AB–1878213 × AC–16623.81 × AD + 19397.31 × BC + 18145.50 × BD + 4003.56 × CD Equation (7)
Impact of independent factors on the theoretical plates (Y3)
The quadratic equation (Equation 8) ANOVA analysis revealed that independent variables, buffer ratio (X1), buffer pH (X2), and flow rate (X3), exerted an influence on the Tp of LND. In contrast, injection volume (X4) had a relatively minor impact of the Tp for LND. Notably, an increase in buffer ratio (X1), an increase in buffer pH (X2), and a decrease in flow rate (X3) resulted in an elevation of the theoretical plate for LND.
In this study, we raised X1, X2, and X3 values from 55% to 75%, from 5 to 6, and from 0.8 to 1 ml/minute, respectively, leading to an increase in the Tp from 2155.95 to 3364.34. The effects of these independent factors, X1, X2, and X3, are graphically illustrated in the 3D and perturbation plot featured in the Figures 2c and 3c.
Y3 = 2623.51 + 296.32 × A + 74.90 × B–107.68 × C–24.61 × D–25.95 × AB–39.49 × AC–20.57 × AD–4.06 × BC + 5.85 × BD–1.42 × CD Equation (8)
Desirability
The preceding analysis yielded an optimized RP-HPLC analytical method with a desirability value of 0.933. The resulting method specified a buffer ratio of 70%, a buffer pH of 5.5, and an injection volume of 10 µl. To validate the suggested method, it was executed in six replicates, and the obtained outcomes for each response were compared with the values indicated by the software. This comparison revealed that the % relative error for the responses remained below 10%. Subsequently, the suggested method underwent further validation in accordance with the ICH Q2 (R1) guidelines. Figure 4 displays the chromatogram that was achieved under optimal circumstances.
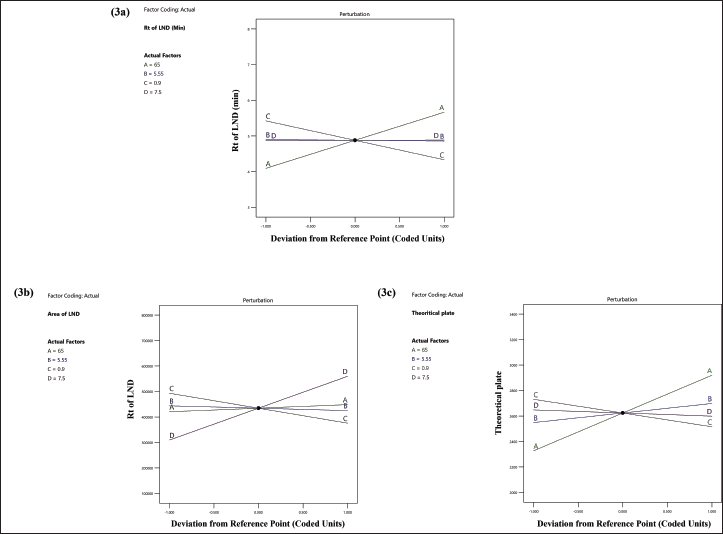 | Figure 3. Perturbation diagram that illustrates how independent variables interact (3a) on the retention time of LND, (3b) on the peak area of LND, and (3c) on the theoretical plate of LND. [Click here to view] |
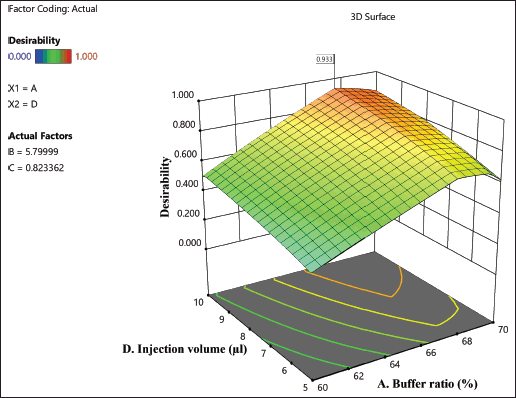 | Figure 4. Desirability plot from the ANOVA analysis. [Click here to view] |
Method validation
Parameters including retention duration, tailing factor, resolution, and theoretical plates were calculated to assess the system’s applicability (Table 4).
System suitability
The optimized RP-HPLC method was run for system suitability, so parameters such as tailing factor, Rt and Tp were calculated. All the outcomes for the system suitability were satisfactory and came under the acceptance criteria.
Linearity
Linearity was obtained for the LND with the calibration range of 0.06–12 µg/ml. The R2 value for LND was calculated from the calibration curve 0.999, respectively. The linearity equation for the LND was y = 78569 × – 3710.7.
Sensitivity
The LOD and LOQ were found to be 11.79 ng/ml and 35.74 ng/ml, respectively.
Accuracy
Three separate tests were conducted to determine the accuracy of the established method: 80%, 100%, and 120%. As per the ICH recommendations, the percent recovery of LND fell within an acceptable range between 90% and 110%. The approach that was devised was precise and accurate.
 | Table 4. Validation data of the optimized analytical method. [Click here to view] |
Precision
The LND’s intra- and inter-day precision was examined. It was observed that the intra-day and inter-day %CVs were less than 2.0%.
Robustness
Small adjustments to the temperature, injection volume, flow rate, pH, and wavelength of the buffer were assessed. These chromatographic condition adjustments had no discernible impact on the theoretical plate, peak area, retention factor, or tailing factor. Table S1. This suggests that the established approach for the LND estimate is reliable.
Bench-top stability
After 24 hours, the recovery from the working solution was found to be 100%–105% and %CV was less than 2%.
Stress-induced degradation studies
The forced degradation study was conducted to assess the stability of LND under various stress conditions, simulating the conditions encountered during formulation development. As depicted in Figure 6, LND demonstrated susceptibility to certain stress conditions. Specifically, it exhibited significant degradation in acidic and alkaline environments. In a 0.1M HCl solution, degradation exceeded 65%, while in a 1M HCl solution, degradation was over 85%. In alkaline conditions, degradation was substantial, with more than 75% in a 0.1M NaOH solution and over 90% in a 1M NaOH solution. In addition, exposure to an H2O2 solution resulted in degradation exceeding 35%. However, LND showed better stability under other stress conditions. At elevated temperatures, degradation was less than 35%, and exposure to sunlight (UV) caused less than 13% degradation.
Application of the developed RP-HPLC analytical method
Characterization of fabricated placebo MSNs and LND@MSNs
The average particle size of placebo MSNs and LND@MSNs was found to be 246 nm and 280 nm, respectively. Notably, the placebo MSNs and LND@MSNs showcased a polydispersity index of 0.149 and 0.088, indicating uniform particle size distribution within the formulation as shown in the figures. The Zeta potential of placebo MSNs and LND@MSNs was found to be −28.9 mV and −32.7 mV (Figure 7).
The specificity of the validated method
The absence of interference from the excipients at the Rt of LND confirms the method’s specificity for accurately estimating the drug within the MSNs. The chronogram of placebo and LND-loaded MSNs is shown in Figure 5.
% Entrapment efficiency and % drug loading
The % EE for LND in MSNs was found to be 76.66% and % DL for LND in MSNs was found to be 14%, respectively.
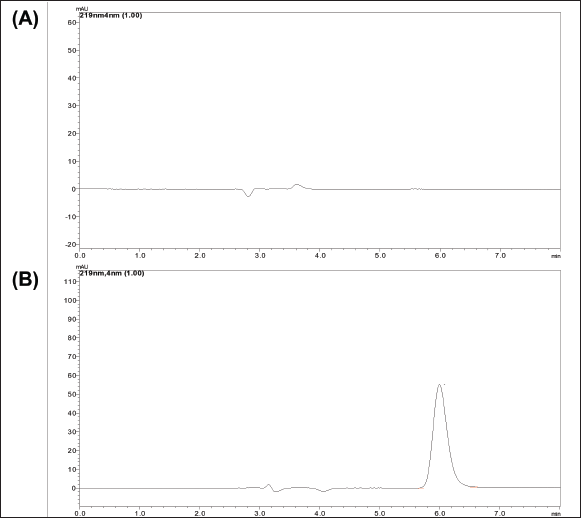 | Figure 5. Chromatogram obtained at optimized conditions (A) Chromatogram of blank MSNs, (B) Chromatogram of LND loaded MSNs. [Click here to view] |
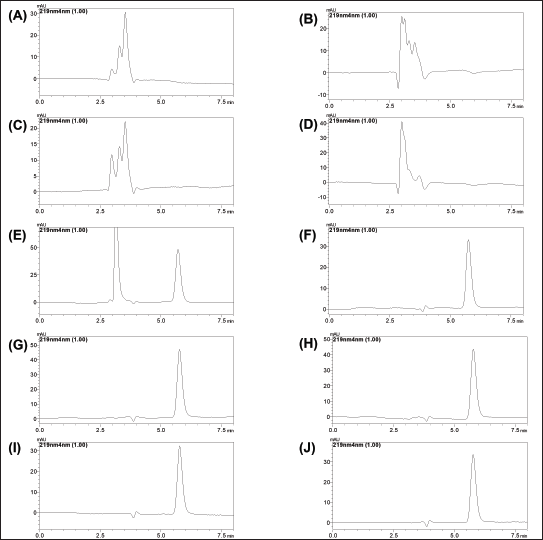 | Figure 6. Chromatogram of (A) 0.1N Hcl, (B) 1N Hcl, (C) 0.1N NaOH, (D) 1N NaOH, (E) H2O2, (F) photothermal, (G) Temperature 40°C, (H) Temperature 60°C, (I) Bench-top stability, and (J) standard. [Click here to view] |
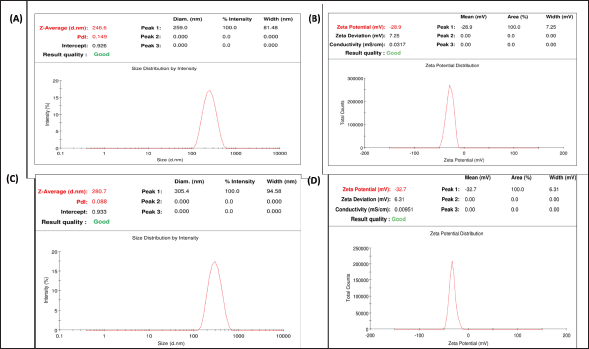 | Figure 7. Characterization of fabricated formulation: (A) Particle size of placebo MSNs, (B) Zeta potential of placebo MSNs, (C) Particle size of LND@MSNs, and (D) Zeta potential of LND@MSNs. [Click here to view] |
 | Figure 8. SEM result of loaded MSNs in drug LND therefore in figure showing the average value of loaded LND with 209 nm and actual size of drug-loaded MSNs with 280 nm. [Click here to view] |
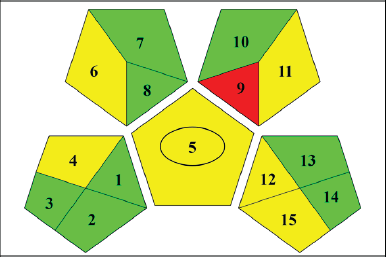 | Figure 9. Diagram shows the suggested HPLC procedure for estimating LND from MSNs using the Green Analytical Procedure Index pictogram. The color red represents a high danger to the environment, while yellow and green symbolize lower danger and better greenness. Eight parameters relating to the sample (collection, preservation, transport, storage, types of processing method, scale of extraction, solvent/reagent used, additional reagent, and so on), three parameters relating to reagents and compounds (amount to solvent/reagent, health hazard, and safety hazard) and four parameters relating to instrumentation (energy, occupational hazard, waste, and waste treatment). [Click here to view] |
Scanning electron microscopy
The SEM image of LND@MSNs revealed the formulation morphology and each particle nanostructure (Figure 8). The morphology of the synthesized MSNs can be modified by varying the CTAB and TEOS concentrations. Adjusting the CTAB and TEOS concentration in MSNs average size was found to be 209 nm and surface morphology was spherical and aggregated.
GREENNESS ASSESSMENT OF DEVELOPED HPLC METHOD
The recommended analytical method of environmental friendliness was evaluated by analyzing twelve GAPI criteria pertaining to the equipment, reagents and compounds, and sample. Independent variables include things like extraction volume, solvent or reagent used, storage, transportation, processing, and additional reagents. The risks associated with chemicals and reagents were the amount of solvent or reagent required and possible threats to the health and safety of humans. Energy, workplace risk, waste, and waste treatment were taken into account [37]. We generated an image (Figure 9) that illustrates the method of environmental friendliness using the GAPI program. Within a pictogram, a circle at the center symbolizes the capacity to serve both qualitative and quantitative goals. Red denoted a severe environmental concern, whereas yellow and green denoted less of a threat and greater greenery, respectively. The strategy received a total score of six green, six yellow, and three red, making it ecologically friendly.
CONCLUSION
An ecofriendly RP-HPLC method for the determination of LND was successfully developed. The three-level CCD was used to optimize the analytical method. The desirability from the DoE analysis was found to be 0.933. The optimized method was validated as per ICH guidelines, the parameters were linearity, sensitivity, accuracy, precision, and robustness. Furthermore, stress-induced degradation study confirmed the sensitivity of the validated method. Using the validated method, the calculated %EE and %DL were 76.66% and 14.00% for the MSNs formulation. The excipients of MSNs did not show any interference with the retention time of LND. This method could be employed for the estimation for the successful formulation development and analysis of these drugs.
ACKNOWLEDGMENT
The authors are thankful to the Science and Engineering Research Board (SERB), Government of India, New Delhi, for providing the fund in the form of a Start-Up Research Grant (SRG) (SRG/2022/001870) for the research project to Dr. Namdev Dhas. The authors are thankful to the Indian Council of Medical Research (ICMR) for the funding provided under the ICMR-SRF fellowship program. The authors are also grateful to Manipal Academy of Higher Education, Manipal, Karnataka, for providing the facilities. The authors are thankful for Biorender.com, a figure-making tool.
LIST OF ABBREVIATIONS
ANOVA, Analysis of variance; CCD, Central composite design; DoE, Design of expert; LND, Lenalidomide; MSNs, Mesoporous silica nanoparticles; OFAT, One-factor at a time; ICH, International Conference on Harmonization
CONFLICTS OF INTEREST
The authors state that the manuscript does not include any conflicts of interest.
AUTHOR CONTRIBUTIONS
All authors made substantial contributions to conception and design, acquisition of data, or analysis and interpretation of data; took part in drafting the article or revising it critically for important intellectual content; agreed to submit to the current journal; gave final approval of the version to be published; and agree to be accountable for all aspects of the work. All the authors are eligible to be an author as per the international committee of medical journal editors (ICMJE) requirements/guidelines.
ETHICAL APPROVALS
This study does not involve experiments on animals or human subjects.
DATA AVAILABILITY
All the data is available with the authors and shall be provided upon request.
PUBLISHER’S NOTE
All claims expressed in this article are solely those of the authors and do not necessarily represent those of the publisher, the editors and the reviewers. This journal remains neutral with regard to jurisdictional claims in published institutional affiliation.
USE OF ARTIFICIAL INTELLIGENCE (AI)-ASSISTED TECHNOLOGY
The authors declares that they have not used artificial intelligence (AI)-tools for writing and editing of the manuscript, and no images were manipulated using AI.
REFERENCES
1. Gribben JG, Fowler N, Morschhauser F. Mechanisms of action of lenalidomide in B-cell non-hodgkin lymphoma. J Clin Oncol. 2015 Sep 1;33(25):2803–11.
2. Imbesi S, Allegra A, Calapai G, Musolino C, Gangemi S. Cutaneous adverse reactions to lenalidomide. Allergol Immunopathol (Madr). 2015 Jan 1;43(1):88–91.
3. Salama L, Pastor ER, Stone T, Mousa SA. Emerging nanopharmaceuticals and nanonutraceuticals in cancer management. Biomedicines. 2020 Sep 12;8(9):347.
4. Gupta A, Nishchaya K, Saha M, Naik GARR, Yadav S, Srivastava S, et al. Recent advancements in nanoconstructs for the theranostics applications for triple negative breast cancer. J Drug Deliv Sci Technol. 2024 Jan 25;105401.
5. Systematic Development of solid lipid nanoparticles of abiraterone acetate with improved oral bioavailability and anticancer activity for prostate carcinoma treatment | ACS Omega [Internet]. [cited 2023 Sep 10]. Available from: https://pubs.acs.org/doi/10.1021/acsomega.1c07254
6. Gupta A, Shetty S, Mutalik S, Chandrashekar HR, K N, Mathew EM, et al. Treatment of H. pylori infection and gastric ulcer: need for novel pharmaceutical formulation. Heliyon. 2023 Oct 1;9(10):e20406.
7. Bharti C, Nagaich U, Pal AK, Gulati N. Mesoporous silica nanoparticles in target drug delivery system: a review. Int J Pharm Investig. 2015;5(3):124–33.
8. Narayan R, Nayak UY, Raichur AM, Garg S. Mesoporous silica nanoparticles: a comprehensive review on synthesis and recent advances. Pharmaceutics. 2018 Aug 6;10(3):118.
9. Tavares Luiz M, Santos Rosa Viegas J, Palma Abriata J, Viegas F, Testa Moura de Carvalho Vicentini F, Lopes Badra Bentley MV, et al. Design of experiments (DoE) to develop and to optimize nanoparticles as drug delivery systems. Eur J Pharm Biopharm. 2021 Aug 1;165:127–48.
10. Saha P, Pandey MM. Design of experiment (DoE)-approach based RP-HPLC analytical method development and validation for estimation of efavirenz in bulk and formulations. J Chromatogr Sci. 2022 Jan 1;60(1):35–44.
11. Development and optimization of liquid chromatography analytical methods by using AQbD principles: overview and recent advances | Organic process research & development [Internet]. [cited 2023 Jul 9]. Available from: https://pubs.acs.org/doi/10.1021/acs.oprd.9b00238
12. Jankovic A, Chaudhary G, Goia F. Designing the design of experiments (DOE)—An investigation on the influence of different factorial designs on the characterization of complex systems. Energy Build. 2021 Nov 1;250:111298.
13. Mutalik SP, Mullick P, Pandey A, Kulkarni SS, Mutalik S. Box–behnken design aided optimization and validation of developed reverse phase HPLC analytical method for simultaneous quantification of dolutegravir sodium and lamivudine co-loaded in nano-liposomes. J Sep Sci. 2021 Aug;44(15):2917–31.
14. Miriam Marques S, Shirodkar RK, Kumar L. Analytical ‘Quality-by-Design’ paradigm in development of a RP-HPLC method for the estimation of cilnidipine in nanoformulations: forced degradation studies and mathematical modelling of in-vitro release studies. Microchem J. 2023 Oct 1;193:109124.
15. Sun L, Jin H yu, Tian R tao, Wang M juan, Liu L na, Ye L ping, et al. A simple method for HPLC retention time prediction: linear calibration using two reference substances. Chinese Med. 2017 Jun 19;12(1):16.
16. Alzoman NZ. A Validated stability-indicating and stereoselective HPLC method for the determination of lenalidomide enantiomers in bulk form and capsules. J Chromatogr Sci. 2016 May;54(5):730–5.
17. Saravanan G, Rao BM, Ravikumar M, Suryanarayana MV, Someswararao N, Acharyulu PVR. Development of an HPLC assay method for Lenalidomide. Chroma. 2007 Aug 1;66(3):287–90.
18. Sarisaltik Yasin D, Arslantürk Bingül A, Karaküçük A, Teksin ZS. Development and validation of an HPLC method using an experimental design for analysis of amlodipine besylate and enalapril maleate in a fixed-dose combination. Turk J Pharm Sci. 2021 Jun 18;18(3):306–18.
19. Full factorial design for development and validation of a stability-indicating RP-HPLC method for the estimation of timolol maleate in surfactant-based elastic nano-vesicular systems—PubMed [Internet]. [cited 2023 Jul 9]. Available from: https://pubmed.ncbi.nlm.nih.gov/34435614/
20. Salwa, Kumar L. Quality-by-design driven analytical method (AQbD) development and validation of HPLC–UV technique to quantify rivastigmine hydrogen tartrate in lipidic nanocarriers: forced degradation, and assessment of drug content and in vitro release studies. Microchem J. 2023 Oct 1;193:108944.
21. Hamid MHM, Elsaman T. A stability-indicating RP-HPLC-UV method for determination and chemical hydrolysis study of a novel naproxen prodrug. J Chem. 2017 Oct 25;2017:e5285671.
22. Mandal S, Bose A. Stability indicating assay method by HPLC for simultaneous estimation of metformin and Glipizide in bulk and pharmaceutical dosage forms. World J Pharm Pharm Sci. 2015 May 25;4:1410–31.
23. Zaman B, Hassan W, Khan A, Mushtaq A, Ali N, Bilal M, et al. Forced degradation studies and development and validation of HPLC-UV method for the analysis of velpatasvir copovidone solid dispersion. Antibiotics (Basel). 2022 Jul 5;11(7):897.
24. Zuromska-Witek B, Zmudzki P, Szlósarczyk M, Maslanka A, Hubicka U. Development and validation of stability-indicating HPLC methods for the estimation of lomefloxacin and balofloxacin oxidation process under ACVA, H2O2, or KMnO4 treatment. Kinetic evaluation and identification of degradation products by mass spectrometry. Molecules. 2020 Nov 11;25(22):5251.
25. Goyal PK, Jaimini M. Development and validation of stability indicating Rp-Hplc method for quantitative estimation of metoprolol succinate and azelnidipine from synthetic mixture. J Pharm Negat Results. 2023 Feb 6;772–9.
26. Emanuelli J, Eva Scherman Schapoval E. Stability-indicating HPLC method for estimation of omarigliptin in tablets—oxidative and photolytic kinetics and degradation products formed under oxidative conditions. Microchem J. 2020 Sep 1;157:105084.
27. Peraman R, Lalitha KV, Raja NM, Routhu HB. Identification of degradation products and a stability-indicating RP-HPLC method for the determination of flupirtine maleate in pharmaceutical dosage forms. Sci Pharm. 2014;82(2):281–93.
28. Gupta A, Navti PD, Mutalik S, Saha M, Moorkoth S. DoE guided development of an HPLC method for evaluation of amoxicillin and metronidazole co-loaded mucoadhesive GRDDS formulation for H. pylori eradication. Chromatographia [Internet]. 2023 Oct 28 [cited 2023 Oct 29]; Available from: https://doi.org/10.1007/s10337-023-04290-z
29. Marques SM, Salwa, Kumar L. Quality-by-design-based development of an eco-friendly HPLC method for the estimation of nisoldipine in nanoformulations: forced degradation studies and in-vitro release studies. Sustain Chem Pharm. 2023 Dec 1;36:101254.
30. Qiao ZA, Zhang L, Guo M, Liu Y, Huo Q. Synthesis of mesoporous silica nanoparticles via controlled hydrolysis and condensation of silicon alkoxide. Chem Mater. 2009 Aug 25;21(16):3823–9.
31. Ashour MM, Mabrouk M, Soliman IE, Beherei HH, Tohamy KM. Mesoporous silica nanoparticles prepared by different methods for biomedical applications: comparative study. IET Nanobiotechnol. 2021 Feb 22;15(3):291–300.
32. Farazin A, Mohammadimehr M, Naeimi H, Bargozini F. Design, fabrication, and evaluation of green mesoporous hollow magnetic spheres with antibacterial activity. Mater Sci Eng: B. 2024 Jan 1;299:116973.
33. Mohseni M, Gilani K, Mortazavi SA. Preparation and characterization of rifampin loaded mesoporous silica nanoparticles as a potential system for pulmonary drug delivery. Iran J Pharm Res. 2015;14(1):27–34.
34. Shabana MS, Taju G, Abdul Majeed S, Nafeez Ahmed A, Karthika M, Ramasubramanian V, et al. Preparation and evaluation of mesoporous silica nanoparticles loaded quercetin against bacterial infections in Oreochromis niloticus. Aquaculture Reports. 2021 Nov 1;21:100808.
35. Sharma M, Mittapelly N, Banala VT, Urandur S, Gautam S, Marwaha D, et al. Amalgamated microneedle array bearing ribociclib-loaded transfersomes eradicates breast cancer via CD44 targeting. Biomacromolecules. 2022 Mar 14;23(3):661–75.
36. Jagadish Shetty S, Shilpa MP, Shirish Bhat S, Pavithra KS, Moorkoth S, et al. Surface functionalized multi-wall carbon nanotubes for degradation of organic dyes. Mater Chem Phys. 2024 Jan 1;311:128566.
37. Plotka-Wasylka J. A new tool for the evaluation of the analytical procedure: green analytical procedure index. Talanta. 2018 May 1;181:204–9.
SUPPLEMENTARY MATERIAL
Supplementary data can be downloaded from the journal’s website link here: [https://japsonline.com/admin/php/uploadss/4424_pdf.pdf]