INTRODUCTION
Fibroblast growth factor receptors (FGFRs) are tyrosine kinase receptors that are involved in differentiation, cell proliferation, survival, angiogenesis, and migration. Infigratinib is a kinase blocker that targets these receptors (Fig. 1). When external signals, predominantly FGFRs, bind to FGFRs, FGFR dimerizes to boost the phosphorylation of downstream molecules and the activation of the Ras-mitogen-activated protein kinase (MAPK) cascade [1,2]. This is an important step in the signaling cascade. A broad variety of neoplasms, such as prostate, urothelial, breast, liver, and ovarian cancer, have been linked to alterations in the FGFR receptors. These alterations include amplifications, fusions, and mutations in the FGFR receptors. Recent investigations have shown that up to 45% of patients with intrahepatic cholangiocarcinoma had gene reorganization that resulted in the FGFR II fusion protein. In particular, FGFR II fusion is strongly connected to intrahepatic cholangiocarcinoma [3]. The drug has a water solubility of 0.0299 mg/ml, a molecular weight of 560.48 gmol1, and the formula C26H31Cl2N7O3. It was chemically designated as 3-(2,6-dichloro-3,5-dimethoxyphenyl)-1-[6-[4-(4-ethylpiperazin-1-yl)anilino]pyrimidin-4-yl]-1-methylurea.
Changes in FGFR that occur in tumors may lead to FGFR signals, which help malignant cells proliferate and survive. It is a reversible, noncompetitive inhibitor of all four FGFR subgroups—FGFR I, FGFR II, FGFR III, and FGFR IV—that inhibits the FGFR signal and decreases cell proliferation in cancer cell lines with activating FGFR amplification, mutations, or fusions. FGFR stands for fibroblast growth factor receptor, and there are four subtypes of FGFR. The drug has the most binding affinity for FGFR I, FGFR II, and FGFR III out of the four different FGFR subtypes. It attaches to the allosteric location between the two kinase lobes of the FGFR, or more precisely, to the ATP-binding cleft of the FGFR. This prevents the FGFR from functioning properly. By binding to this cleft, autophosphorylation of the receptor may be avoided, and downstream signaling cascades, which would normally activate MAPK, are prevented from being activated [4].
 | Figure 1. Chemical structure of infigratinib. [Click here to view] |
Literature on infigratinib revealed that only one analytical procedure was reported on liquid chromatography tandem mass spectrometry (LC-MS-MS) [5]. One ultra-performance liquid chromatography tandem mass spectrometry method for the quantification of infigratinib was developed in the rat plasma [6]. No methods were reported for the pharmacokinetic estimation of infigratinib in healthy rabbits. For this reason, the LC-MS-MS technique was absolutely necessary for the investigation of biological materials, as it will be useful in pharmacokinetic, pharmacodynamic, and forensic research, respectively. In the present investigation, we created a method that is predicated on human K2EDTA plasma.
MATERIALS AND METHOD
Chemical reagents
In the research investigation, purified water for the chromatographic system was generated using the MilliQ system (Millipores, USA), which was used to manufacture the water. Chromatography-grade methyl alcohol, acetonitrile, AR-grade formic acid, and ammonia, were purchased from Merck Ltd, Mumbai, India. Both infigratinib and dasatinib were purchased from Beijing Sunflower Technology Development Co., Ltd., Beijing, China. The ethical number was obtained from the institutional ethical committee (1447/PO/Re/S/11/CPCSEA-69/A) to conduct the pharmacokinetic experiments on healthy rabbits.
Instrument
An LC-MS-MS equipment of Premier QuattrosX.E joined with the HPLC2695 isolating module was employed for the present study. The software version of Mass Lynx V 4.1 was utilized for the processing of chromatograms and data generation during the research work.
Internal standard (ISTD) preparation
The dasatinib reference component of 10 mg was added, dissolved, and filled with acetonitrile in a 10.0 ml volumetric flask. A calibrated pipette was used to transfer 0.5 ml of ISTD stock solution (1,000 μg/ml) into a 100.0 ml volumetric flask. The diluent was then added at the same volume (5.0 μg/ml). Mixed well, labeled, and kept at 5°C–10°C.
Preparation of calibration standards
Weigh and transfer 50.0 mg of infigratinib standard to a 50.0 ml flask. Dissolve in acetonitrile and make up the volume. Label and keep at 10°C. Use the process of serial dilution to get the concentrations of the solutions ready, which should range from 1 to 1,640 ng/ml, and be prepared with a movable phase. Using human K2EDTA plasma may prepare the spiked calibration standards to be used within a similar concentration range.
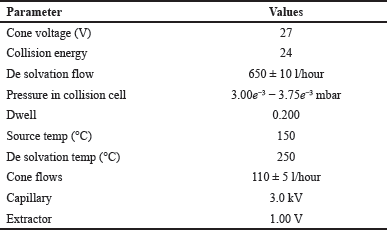 | Table 1. Settings of mass instrument. [Click here to view] |
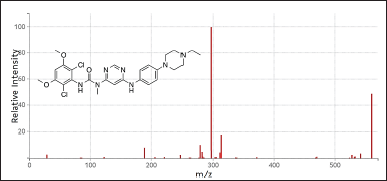 | Figure 2. Mass spectrum of infigratinib. [Click here to view] |
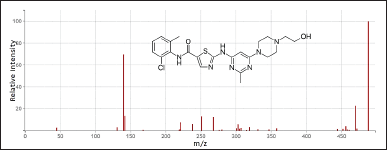 | Figure 3. Mass spectrum of dasatinib. [Click here to view] |
Processing of quality controls (QCs)
Using a calibrated balance, 50.0 mg of infigratinib was weighed and relocated into a 50-ml flask. Dissolve the contents and make up the volume with acetonitrile. A QC stock solution was used to produce low-QC (LQC) (3.0 ng/ml), medium QC (MQC) (820 ng/ml), and high-QC (HQC) (1,230 ng/ml) spiked samples.
Sample extraction
The necessary plasma solutions from the deep freezer were thawed to room temperature. Except for the STD Blank, 5.0 μg/ml IS working samples were added to pre-labeled empty tubes in a batch sequence to get the final concentration of 450 ng/ml. 200 μl of plasma was mixed for 10 seconds in an ISTD tube. Vortex all tubes by the addition of 2.50 ml of ethyl acetate as an extraction solvent and spin at 500 rpm for 10 minutes. Centrifuge all tubes at 5,000 rpm at 5°C for 5 minutes. The top clear portion was relocated to the evaporating tube, where it was evaporated under nitrogen at 45°C ± 5°C until dry. For 1 minute, vortex all tubes with a 250 μl mobile phase. Use designated autosampler vials to introduce 5.0 μl of reconstituted solution into LC-MS-MS.
 | Figure 4. Representative chromatograms of aqueous A) LQC, B) MQC, and C) HQC solutions. [Click here to view] |
Chromatographic optimized conditions
An Orosil, 3 μm, C18, 150 × 4.6 mm column, acetonitrile, methanol, and 0.1% formic acid (60:30:10) movable system at 0.8 ml/minute was employed for the isolation of components. 5 μl volumes were employed to isolate the drug and ISTD in 2.00 minutes at 30°C ± 5°C of oven temperature. Infigratinib retention was 0.82 minutes, and ISTD was 1.11 minutes.
Mass system parameters
The settings for conducting mass spectrometry employing an electro-spray ionization source and multiple reaction monitoring (MRM) are shown in Table 1. Infigratinib’s MRM transitions were m/z 561.21/297.18 and the ISTD at 488.16/140.02.
Infigratinib pharmacokinetics in rabbits
Before beginning the studies, the rabbits were allowed to go without food for a whole day. After a dosing period of 4 hours, the meals were made available again. Animals were given an infigratinib tablet that was given orally as a single dose, and 0.5 ml of blood samples were collected at regular time intervals from the retro-orbital puncher at times 0, 0.50, 1, 1.50, 2, 2.50, 3, 4, 6, 8, 12, 16, 20, and 24 hours after the dose. These blood samples were then placed in Eppendorf tubes that contained heparin to prevent blood from clotting. Blood was centrifuged at 4,000 rpm in a cooled centrifuge for 5–10 minutes to separate the plasma, which was then frozen at 20°C until the results of the study could be analyzed [7].
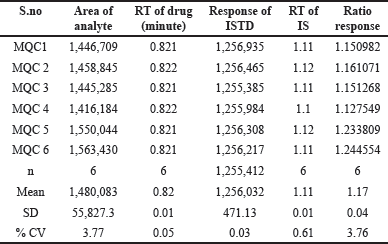 | Table 2. Infigratinib system suitability. [Click here to view] |
Method validation
Validation of the devised technique was performed in line with the European Medicines Agency, 2011, and Food and Drug Administration, 2001 standards [8–10,19–20].
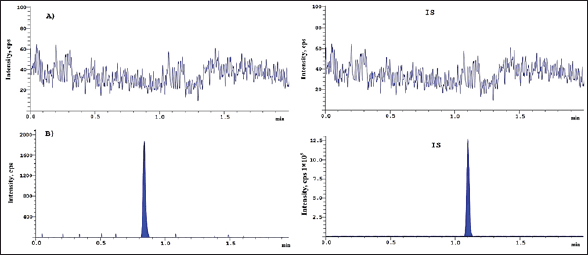 | Figure 5. Chromatogram of A) blank and B) LLOQ + IS solution. [Click here to view] |
RESULT AND DISCUSSIONS
Method validation
System suitability
The sample was subjected to processing that included six consecutive infusions of an aqueous standard combination at the MQC (Fig. 2–4). concentration. On a daily basis during the technique validation process, system suitability was examined [11–14]. Retention timings % coefficient of variation (CV) values were ≤0.62 for infigratinib and IS. %CV of peak response ratios (analyte response/IS response) exhibited ≤3.8%. Table 2 summarizes the results of system suitability.
Auto-sampler carryover effect
The carryover effect of the auto sampler was evaluated by infusing an unextracted sample solution of the movable system, the lower limit of quantification (LLOQC), and upper limit of quantification (ULOQC), as well as extracted solutions of standard blank, ULOQC, and LLOQC [15]. The results of this investigation indicated that there was no carryover impact.
Biological matrix screening and specificity
An LC-MS-MS method showed specificity in standard plasma samples. For a specificity estimate, 10 plasma batches were investigated [16]. Seven of the 10 samples included anticoagulant plasma, 1 hemolytic, 1 lipidemic, and 1 heparin. All investigated human plasma lots had no significant interferences with the drug’s retention timings or IS (Fig. 5).
Sensitivity
By assessing six LLOQs, the method’s sensitiveness was estimated to be 1.0 ng/ml for infigratinib. At the LLOQC level, infigratinib’s accuracy and precision were discovered to be 4.04% and 98.81%, respectively [17].
Matrix effects
Six batches of chromatographically screened plasma were utilized to assess the LC-MS-MS matrix influence. Each batch of plasma was prepared with infigratinib concentrations equal to the LQC and HQC and delivered in triplicate at each stage [18]. The overall CV of the back-calculated concentration was 4.08 and 5.40 for the higher and lower QC samples of all the lots. Back-calculated outcomes were 98.08 and 97.81 (Table 3) for higher and lower QC samples of all lots, respectively.
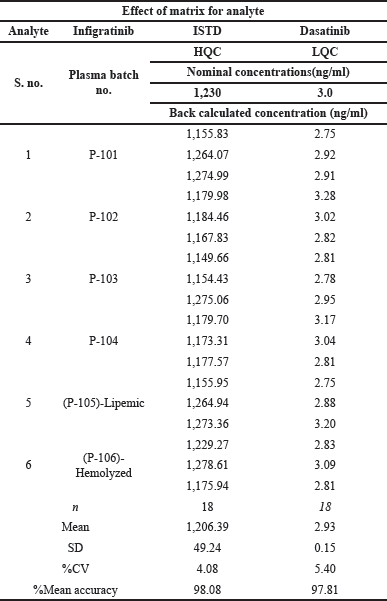 | Table 3. Infigratinib matrix effects. [Click here to view] |
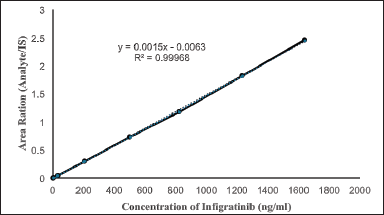 | Figure 6. Infigratinib linearity. [Click here to view] |
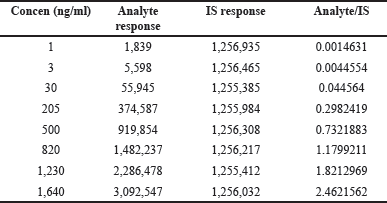 | Table 4. Linearity of infigratinib. [Click here to view] |
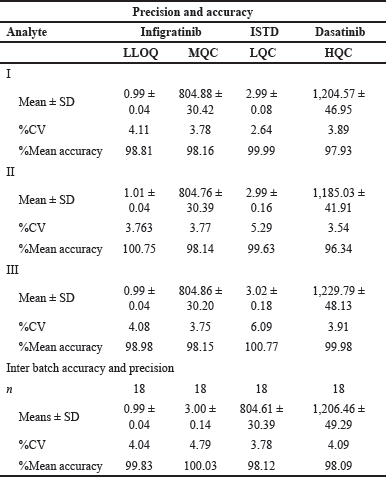 | Table 5. Precision and accuracy of infigratinib. [Click here to view] |
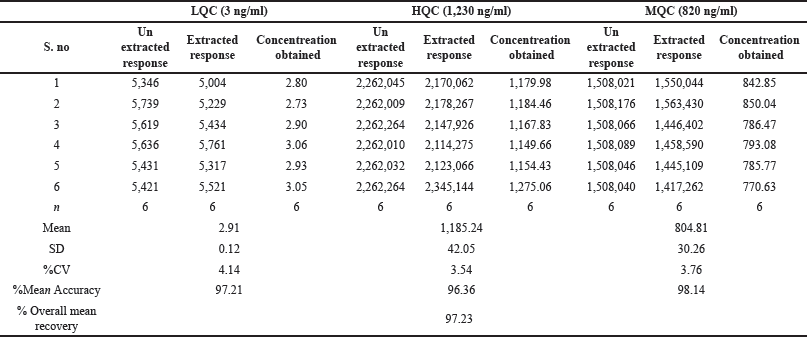 | Table 6. Recovery of infigratinib. [Click here to view] |
Calibration curve
A 1/x2 weighted least squares regression study of calibration graphs from an 8-point linear curve verified the method’s linearity [11]. During validation, all calibration curves were linear for standard concentrations ranging from 1 to 1,640 ng/ml. Figure 6 shows an example calibration curve from the first precision and accuracy batch. Validation showed an r2 = 0.9997 (Table 4) and an equation of y = 0.0015x − 0.0063.
Precision
The validation approach examined the accuracy of the LC-MS-MS technique using %CV at varied LQC, LLOQC, HQC, and MQC concentrations [11,18]. All QC samples had back-calculated concentration solution CVs between 2.63 and 6.09, within the 15% range. All LLOQ samples had a CV of back-calculated concentrations of 4.04, within the permitted 20.00% range. Table 5 provides a summary of the findings.
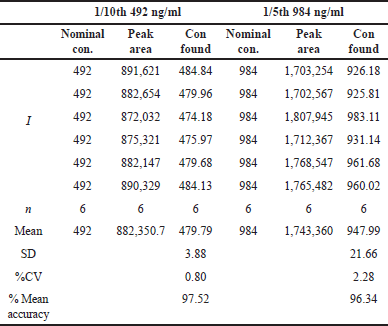 | Table 7. Dilution integrity of infigratinib. [Click here to view] |
Accuracy
The accuracy of the assay was evaluated based on the ratio of the estimated average readings of QCs to the nominal values associated with those readings. This ratio was expressed as a percentage. Back calculations of concentration levels showed that all control solutions had accuracies in the range of 96.34%–100.76% (Table 5) on average [16].
Recovery
The QCs that were extracted from plasma were compared to the ones that were not extracted at the LQC, HQC, and MQC [17] levels to find the average recoveries, which were shown as a percentage. Infigratinib exhibited a mean recovery of 98.14%, 96.36%, and 97.21% (Table 6) when tested at MQC, HQC, and LQC concentrations, respectively. Every single QC level had a mean recovery of 97.23.
Integrity of dilution
The dilution integrity of the procedure was evaluated by first diluting it 1/5th and then 1/10th times to get to 3ULOQ. It was found that the accuracies for the integrity of dilutions at the 1/5th and 1/10th concentrations were 2.28% and 0.80%, respectively (Table 7).
Stability studies
The infigratinib and IS were kept out of the fridge for 8 hours at room temperature to ensure their short-term stability. LQC and HQCs were tested for a 10-day, 16-hour, and 20-minute period at temperatures ranging from 2.0°C to 8.0°C for long-term stability. The samples were frozen at −28°C ± 5°C and at −70°C ± 10°C and thawed at room temperature (25°C) three times. QC sample solutions were spiked and left to stand for 17 hours and 28 minutes on the benchtop [15]. To test their durability, the prepared controls were kept in an auto sampler for 2 days, 20 hours, and 27 minutes at 5°C ± 3°C. Wet extract stability was assessed by keeping spiked QC samples at room temperature for 23 hours and 42 minutes. At 2°C–8°C, the half-life of a wet extract was 2 days, 20 hours, and 23 minutes. The shelf life of dry extracts of spike controls was evaluated over a period of 2 days, 20 hours, and 2 minutes at −28°C ± 5°C. All readings fell within acceptable parameters, as shown in Table 8.
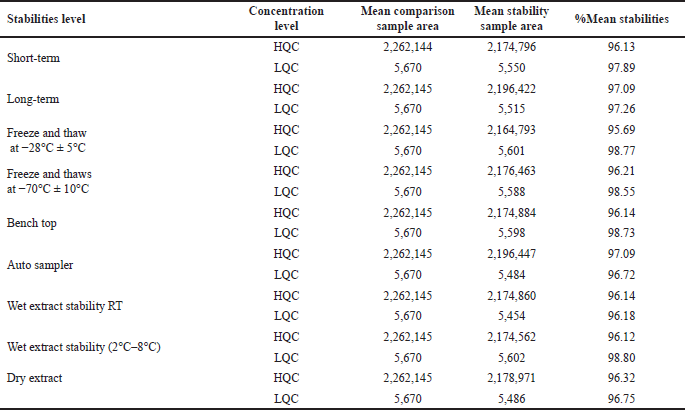 | Table 8. Stability data of infigratinib. [Click here to view] |
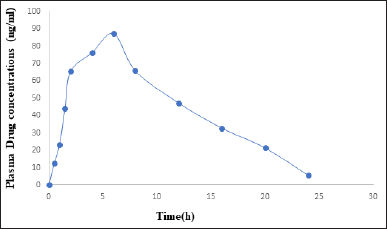 | Figure 7. Average plasma concentrations-time profile for infigratinib in rabbits (n = 6). [Click here to view] |
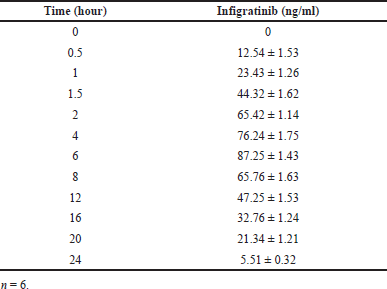 | Table 9. Plasma concentration profiles of Infigratinib. [Click here to view] |
Pharmacokinetic studies
One-way analysis of variance and the Tukey–Kramer multiple comparison test were used in Graph Pad InStat software (version 3.00, Graph Pad Software, San Diego, CA). Statistical significance was determined by p < 0.05. Rabbit plasma concentration-time curves following a single oral dosage of Infigratinib tablets are shown in Figure 7. Infigratinib oral pharmacokinetics in rabbits are presented in Tables 9 and 10. The Cmax, Tmax, and T1/2 of infigratinib were 87.25 ± 1.43 ng/ml, 6.0 ± 0.03 hours, and 15.24 ± 0.53 hours, respectively. An important measure in assessing medication bioavailability from the dosage form is AUC, which indicates the total integrated area under the blood concentration-time profile and the total quantity of drug reaching the systemic circulation following oral delivery. The AUC0-∞ infinity for infigratinib was 291.74 ± 3.67 ng h/ml.
 | Table 10. Average pharmacokinetic parameters of infigratinib. [Click here to view] |
CONCLUSION
A precise and linear LC-MSMS technique was developed for the estimation of infigratinib in human K2EDTA plasma. Chromatographic isolation of infigratinib and dasatinib was attained on Orosil, 3 μm, C18, 150 × 4.6 mm stationary phase with a 0.8 ml/minute movable phase flow rate. The method was rectilinear in a concentration range of 1–1,640 ng/ml. Validation showed an r2 = 0.9997 and an equation of y = 0.0015x − 0.0063. The average accuracies of back-assessed concentrations for all QCs were between 96.34 and 100.76. At MQC, HQC, and LQC concentrations, Infigratinib had 98.14%, 96.36%, and 97.21% mean recoveries, respectively. The developed method was successfully applied for the pharmacokinetic study of infigratinib in healthy rabbits. The Cmax, Tmax, and T1/2, of the infigratinib were 87.25 ± 1.43 ng/ml, 6.0 ± 0.03 hours, and 15.24 ± 0.53 hours, respectively. AUC0-∞ infinity for infigratinib was 291.74 ± 3.67 ng h/ml.
AUTHOR CONTRIBUTIONS
Kunala Anusha made substantial contributions to conception and design, acquisition, analysis, and interpretation of data and took part in drafting the article. Gummadi Sowjanya was involved in drafting and critically revising the manuscript for important intellectual content. Both the authors agreed to submit to the current journal, gave final approval of the version to be published and agree to be accountable for all aspects of the work. All the authors are eligible to be an author as per the International Committee of Medical Journal Editors (ICMJE) requirements/guidelines.
FINANCIAL SUPPORT
There is no funding to report.
CONFLICTS OF INTEREST
The authors report no financial or any other conflicts of interest in this work.
ETHICAL APPROVALS
The ethical number was obtained from the institutional ethical committee (1447/PO/Re/S/11/CPCSEA-69/A) to conduct the pharmacokinetic experiments on healthy rabbits.
DATA AVAILABILITY
All data generated and analyzed are included in this research article.
USE OF ARTIFICIAL INTELLIGENCE (AI)-ASSISTED TECHNOLOGY
The authors declares that they have not used artificial intelligence (AI)-tools for writing and editing of the manuscript, and no images were manipulated using AI.
PUBLISHER’S NOTE
All claims expressed in this article are solely those of the authors and do not necessarily represent those of the publisher, the editors and the reviewers. This journal remains neutral with regard to jurisdictional claims in published institutional affiliation.
REFERENCES
1. Botrus G, Raman P, Oliver T, Bekaii-Saab T. Infigratinib (BGJ398): an investigational agent for the treatment of FGFR-altered intrahepatic cholangiocarcinoma. Expert Opin Investig Drugs. 2021;30(4):309–16.
2. Blechacz B. Cholangiocarcinoma: current knowledge and new developments. Gut Liver. 2017;11(1):13–26.
3. Lima NC, Atkinson E, Bunney TD, Katan M, Huang PH. Targeting the Src pathway enhances the efficacy of selective FGFR inhibitors in urothelial cancers with FGFR3 alterations. Int J Mol Sci. 2020;21(9): 21093214.
4. FDA approved drug products: TRUSELTIQ (infigratinib) capsules, for oral use. Rome, Italy: FDA; 2021. Available from: https://www.accessdata.fda.gov/drugsatfda_docs/label/2021/214622s000lbl.pdf
5. Mostafa GAE, Kadi AA, AlMasoud N, Attwa MW, Al-Shakliah NS, AlRabiah H. LC-MS/MS method for the quantification of the anti-cancer agent infigratinib: application for estimation of metabolic stability in human liver microsomes. J Chromatogr B Analyt Technol Biomed Life Sci. 2021;1179:122806.
6. Xu X, Chen C, Liu Y, Meng X, Cai JP, Xu R. Establishment and validation of a UPLC-MS/MS bioassay for the quantification of infigratinib in rat plasma. Arab J Chem. 2022;15(7):103893.
7. Pasupuleti KB, Venkatachalam B, Bhaskar Reddy K. Formulation and in vitro–in vivo pharmacokinetic evaluation of cardiovascular drug-loaded Pulsatile drug delivery systems. Int J App Pharm. 2021;13(6):144–51.
8. Darshan Bhatt, Rajkamal B. A UPLC-MS/MS method development and validation for the estimation of sofosbuvir from human plasma. Int J Appl Pharm. 2017;9(1):30–6.
9. FDA drug approvals and databases: FDA grants accelerated approval to infigratinib for metastatic cholangiocarcinoma. Rome, Italy: FDA. Available from: https://www.fda.gov/drugs/resources-information-approved-drugs/fda-grants-accelerated-approval-infigratinib-metastatic-cholangiocarcinoma
10. Wu YL, Smit TE, Bauer TM. Capmatinib for patients with non-small cell lung cancer with MET exon 14 skipping mutations. A review of preclinical and clinical studies: Canc Treat Rev. 2021;95:102173.
11. Shah JV, Shah PA, Shah PB, Sanyal M, Shrivastav PS. Fast and sensitive LC–MS/MS method for the simultaneous determination of lisinopril and hydrochlorothiazide in human plasma. J Pharm Anal. 2017;7:163–9.
12. Lolla S, Gubbiyappa KS, Cheruku S, Bhikshapathi DVRN. Validation of an LC-MS/MS method for quantitation of fostemsavir in plasma. J Pharmacol Toxicol Methods. 2023;120:107254.
13. Shankar CH, Bhikshapathi D, Medipalli V, Arjuna RN, Sadasivam RK. Bioanalytical method development and validation for the quantitation of larotrectinib in human plasma: application to pharmacokinetics in healthy rabbits. J Appl Pharm Sci. 2023;13(11):111–8.
14. US FDA. Guidance for industry bioanalytical method validation. Rockville, MD: Food and Drug Administration, Center for Drug Evaluation and Research (CDER); 2001.
15. Victor M, Richard G, Jeffrey Y, Margarita M, MartinW, Hendrik TA, et al. Pharmacokinetics and safety of capmatinib with food in patients with MET-dysregulated advanced solid tumors. Clin Ther. 2021;04:6.
16. Saraner N, Karagoz A, Guney B, Saglam O. Determination of dasatinib in human plasma by using liquid chromatography-tandem mass spectrometry. Int J Analyt Bioanalyt Methods. 2019;1:2.
17. Sai Uday Kiran G, Sandhya P, Shankar CH, Bhikshapathi DVRN, Mamatha P. An LC–MS/MS quantification method development and validation for the dabrafenib in biological matrices. J Appl Pharm Sci. 2023;13(01):180–6.
18. Fan X, Yang G, Cui W, Liu Q, Zhang Z, Zhang Z. Development and full validation of an LC–MS/MS methodology to quantify capmatinib (INC280) following intragastric administration to rats. Biomed Chromatogr. 2020;34(3):e4768.
19. European Medicines Agency. 2011. Guideline on bioanalytical method validation. Available from: https://www.ema.europa.eu/en/documents/scientific-guideline/guideline-bioanalytical-method-validation_en.pdf
20. International Council for Harmonization of Technical Requirements for Pharmaceuticals for Human Use. 2019. ICH guideline M10 on bioanalytical method validation and study sample analysis. Available from: https://www.ich.org/page/multidisciplinary-guidelines