INTRODUCTION
Helicobacter pylori (H. pylori) is a Gram-negative bacteria, that is classified as a type I carcinogen by the International Agency for Research on Cancer, a division of the World Health Organization [1,2]. This bacterium stays in the stomach mucosa and causes different diseases such as gastric ulcers, diarrhea, malnutrition, or other infections such as cholera or typhoid fever. For the treatment of H. pylori infection, a combination of antibiotics and proton pump inhibitors (PPIs) are utilized owing to the inherent anti-bacterial activity of PPIs [3].
Due to the antibiotic resistance and polypharmacy, the available treatments are not successful. The failure of the therapy and the antibiotic resistance have contributed to the rise in H. pylori-associated gastrointestinal problems [4]. The prevalence of H. pylori is significantly high worldwide. The resistance to antibiotics and the treatment failure can be managed by using the P-glycoprotein (P-gp) inhibitors. P-gp is a transmembrane glycoprotein with a molecular weight of 170 kDa, belonging to the extensive superfamily of ATP-binding cassette transporters. P-gp inhibitors are often used as a bioavailability enhancer because of their crucial function in modifying drug uptake and permeability. Stomach ulcers caused by H. pylori may be caused by an overproduction of P-gp. The role of P-gp in absorbing drugs and therapy for H. pylori infection was described by Damanhuri et al. [5] They found that P-gp-expressed rats were much more susceptible to developing H. pylori-induced ulcers than P-gp-inhibited rats.
The eradication of H. pylori involves the usage of antibiotics but the efficacy of these antibiotics can be reduced by the activity of P-gp in the stomach lining. It pumps the antibiotics out of the stomach before they are fully absorbed and can reach the site where H. pylori resides. By inhibiting the activity of P-gp, the antibiotics can cling in the stomach for a longer period of time and achieve higher concentrations to effectively kill H. pylori. Apart from bacterial eradication, P-gp inhibitors also showed a more than 90% healing rate compared to standard treatment in the case of gastric ulcers [5]. Several studies have shown that P-gp inhibitors, such as verapamil, cyclosporin A, and quinidine, can increase the effectiveness of antibiotics against H. pylori [6]. Piperine (PIP) is a P-gp inhibitor that stops the adhesion of H. pylori to the gastric mucosa and helps in the eradication of bacteria [7]. PIP has been found to possess anti-inflammatory, antioxidant, and anti-ulcer properties, which may help in the management of gastric ulcers. Some studies have shown that PIP can reduce gastric inflammation and oxidative stress, and inhibit the growth of H. pylori, the bacteria associated with gastric ulcers. PIP has also been shown to increase the production of gastric mucus, which could help protect the stomach lining from damage. PIP has been studied for its potential to enhance the bioavailability of other compounds, such as curcumin. The combination of pantoprazole (PAN) and PIP can increase the efficacy of the drug and cure the ulcer early. Here, in this work, the high-performance liquid chromatography (HPLC) analytical method has been developed to simultaneously quantify the PAN and PIP from the gastroretentive drug delivery system (GRDDS). Here, in Table 1, a few reported HPLC methods for PAN and PIP have been shown.
GRDDS has gained interest for localized stomach targeting and longer retention of the drug in gastric mucosa. Chitosan and sodium alginate were utilized as the mucoadhesive polymers in this work. EUDRAGIT® L 30 D-55 is an anionic copolymer made of methacrylic acid and ethyl acrylate that is dispersed in water. This polymer was used for the enteric coating of GRDDS of PAN because PAN is not stable in the gastric environment. This allows the drug to pass through the stomach intact and be released in the more alkaline environment of the small intestine, where it can be absorbed more effectively. For the fabrication of a novel drug delivery system of PAN and PIP, simultaneous quantification of drugs is important. Therefore, it is important to find a way to estimate both PAN and PIP, simultaneously. Figure 1 and Table S1 show the structure and properties of PAN and PIP.
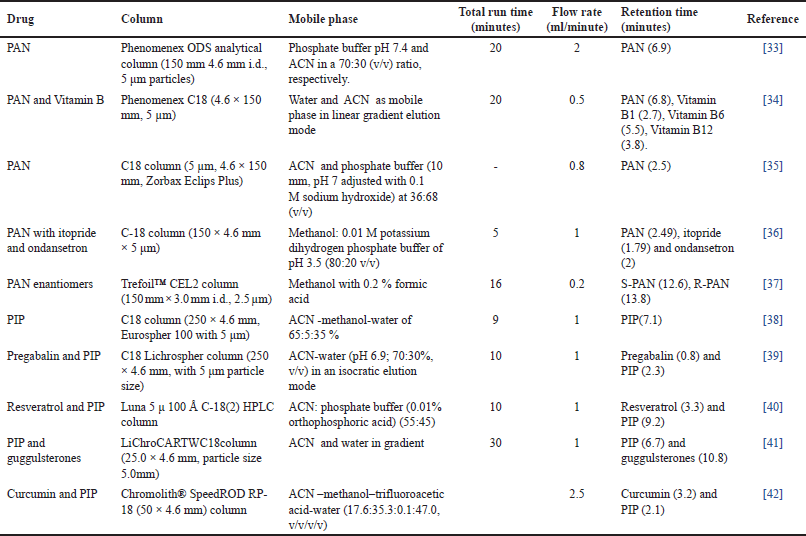 | Table 1. The previously reported analytical HPLC method for PAN and PIP. [Click here to view] |
The objective and novelty of this study were to simultaneously estimate PAN and PIP by reverse-phase (RP)-HPLC method equipped with a photo-diode array (PDA) detector from the chitosan-based sodium alginate mucoadhesive beads utilizing design of experiments (DOEs) methodology. The DoEs is a systematic approach to determining and analyzing key aspects of a process. DoE has been employed in several steps of analytical procedures, such as preliminary screening, determining key chromatographic parameters, optimizing, and estimating robustness. This method was validated as per the International Conference on Harmonization (ICH) Q2 R1 guideline and was optimized by using of Box-Behnken design (BBD). In addition, the developed method was found to be highly stable and showed good response at low concentrations. A forced degradation study was conducted by exposing the drugs on purpose to different stress factors to evaluate their stability and the specificity of the method to estimate the pharmaceuticals among degraded products. The optimized method was applied to estimate the PAN and PIP in the mucoadhesive formulation to evaluate the entrapment efficiency.
MATERIALS AND METHODOLOGY
Gift samples of PAN (off-white powder; purity > 98%) were kindly provided by Sun Pharma of Gurgaon, Haryana, India. PIP (light yellow, purity > 97%) sourced from Sigma, Himedia Labs Pvt. Ltd. (Mumbai, India) supplied the hydrogen peroxide (30%) and the sodium hydroxide pellets (98% purity). Orthophosphoric acid (88%) was purchased from Merck Ltd. Mumbai, India. HPLC grade methanol (MeOH) and acetonitrile (ACN) were purchased from Finar Ltd (Ahmedabad, India). High pure water (18.2 MΩ.cm resistivity, Milli-Q) was obtained from the Direct-Q ® 3 water purification system, Millipore Corporation, Billerica, USA. Finar Ltd. (Ahmedabad, India) supplied the 35% pure AR-hydrochloric acid. Riviera Glass Pvt. Ltd. (Mumbai, India) provided 0.22 μm membrane filters. Potassium dihydrogen phosphate (purity >98%) and sodium hydroxide were purchased from Merck Labs Pvt. Ltd. in Mumbai, India. The HyperClone Octadecylsilane (ODS) C18 column was purchased from Phenomenex (Hyderabad, India) and included particle sizes of 5 μm and 120 Å, and a length and width of 250 × 4.6 mm. The ingredients for the mucoadhesive beads, including sodium alginate and chitosan (purity > 98%), were obtained from Loba chemicals in Mumbai, India. Merck Labs Pvt. Ltd. supplied the calcium chloride (purity > 98%). Evonik generously provided the sample of EUDRAGIT® L 30 D-55. The HPLC-grade chemicals were employed in the method development and validation processes.
 | Figure 1. Structure of drugs. (a) PAN sodium. (b) PIP. [Click here to view] |
Instrumentation
To optimize and validate the chromatographic process, a Shimadzu HPLC system equipped with an LC20-AD pump, SIL20-AC HT autosampler, CTO-10 ASVP column oven, SPD-20A and SPD-M10 detectors, and LabSolutions software were used. To make the standard solution and the buffer, we used an analytical balance for the weighing purpose, that had been calibrated (a Sartorius Mechatronics CP225D, India). The mobile phase solution was filtered via a 0.22 μm membrane filter using a glass vacuum filtering assembly from Merck Millipore, Bangalore, India, and degassed in an ultrasonic bath from GT Sonic in Guangdong, China. The pH of the mobile phase was determined with the help of a calibrated digital pH meter (ELICO (Model #LI 617), Telangana, India). During the course of the sample preparation procedure, the calibrated variable micropipettes Construct (in Eppendorf, Germany) with volumes ranging from 0.2 to 10, 10 to 100, and 100 to 1,000 μl were used.
Preparation of mobile phase and standard solution
Mobile phase (MP)
The MP was composed of a 30% 10 mm ammonium acetate buffer and a 70% methanol solution. The buffer was made by dissolving ammonium acetate in Milli-Q water and then adjusting the pH with glacial acetic acid or ammonia solution to a value of 4.5. The buffer was then filtered through a 0.22 μm membrane filter before sonicating it.
Standard and sample solution
A stock solution of 1 mg/ml was prepared by dissolving correctly weighed portions of PAN (10 mg) and PIP (10 mg) into 5 ml of Milli-Q water using bath sonication. The volume was then brought up to 10 ml using more methanol. Using 1 ml of each drug’s stock solution, we brought the total amount up to 10 ml to create a functional stock solution of PAN and PIP. A final concentration of 100 μg/ml was reached in the working stock solution. Different PAN and PIP concentrations were prepared from the working stock.
DoE guided HPLC method development using BBD
To find the correct wavelength for the simultaneous estimation of PAN and PIP and to achieve the desired concentration of 10 μg/ml, the working stock was further diluted. The prepared solution was analyzed using a double beam UV-Vis spectrophotomer (UV-1800, Shimadzu, Kyoto, Japan) in the range of 200–800 nm to detect absorption maxima (λmax) using water as a blank. The ammonium acetate buffer pH 4.5(10 mM) was selected on the basis of the pKa value of the PAN (3.92, 8.19) and PIP (12.22) and on the basis of preliminary trials conducted. The stationary phase of the method was selected on the basis of the literature and the properties of the drugs (hydrophobic interactions). Hyperclone ODS C18 column was selected as the stationary phase [8–11].
A comprehensive literature review was conducted to investigate the impact of various processing factors, including organic phase ratio, flow rate, column temperature, and injection volume, on parameters such as retention time (TR), peak area, and resolution. Previous experiments using the one factor at a ime (OFAT) technique revealed the factors significantly influencing the separation.
The optimization process involves the precise adjustment of these key factors to establish stable testing parameters. Altering numerical values for these experimental factors requires a deep understanding of the underlying chemistry and the intricate interactions among the components. The DoE tool investigates the interaction between variables and the effect of variables on the outcomes. The DoE approach sets the range for trials and from the response of trials it selects the optimal method with robust response. The BBD and central composite design are the models used for the optimization. BBD is the response surface design that gives detailed results with the less experimental trials and hence was utilized in the current study [12,13].
This optimization procedure identified four chromatographic parameters, including buffer phase (X1), buffer pH (X2), flow rate (X3), and injection volume (X4), as independent variables, and peak area of PAN (Y1), peak intensity of PAN (Y2), peak area of PIP(Y3), peak intensity of PIP (Y4), and resolution (Y5) as the responses (Table 1).
Method validation
The ICH Q2 (R1) validation criteria were applied to the established reverse phase HPLC method for determining PAN and PIP simultaneously. The sensitivity, specificity, linearity, limits of detection (LOD), limits of quantitation (LOQ), accuracy, precision, robustness, and stability analysis were done [14,15].
Degradation studies
The objective of stress-induced degradation is to evaluate the stability of the drugs under extreme conditions. Various forms of stress, including chemical, physical, thermal, oxidative, and light stress, were applied to the drug samples. The study on stress-induced degradation performed drug solutions of 1 μg/ml for both PAN and PIP. The drug concentrations in the degradation samples were calculated per the defined protocol, and all analyses were carried out in triplicate to quantify the percentage of degradation.
Hydrochloric acid was added to samples at 0.1 and 1 M concentrations to investigate the effects on acid hydrolysis. After fully mixing 2 ml of acid in 1 ml of drug solution (1 mg/ml), it was heated to 60°C and left to react for a whole day. Using 0.1 and 1 M NaOH, the resultant solutions were neutralized. The sample was further diluted before the HPLC analysis [16,17].
PAN and PIP were tested in an alkaline medium with two different molar concentrations of NaOH (0.1 and 1 M) to evaluate their degradation behavior under pressure. After mixing 1 ml of drug solution (1 mg/ml) with 2 ml of alkali solution, the mixture was heated for 24 hours at 60°C. The solution was then neutralized with 0.1 and 1 M HCl. The sample was further diluted before the HPLC analysis [18].
1 ml of a PAN and PIP solution (1 mg/ml) was combined with 2 ml of a 3% w/v H2O2 solution to prepare a combination that would cause oxidative degradation using hydrogen peroxide. This combination was kept at room temperature in the dark for a whole day. The samples were then suitably diluted, and an HPLC analysis was carried out [19,20].
A drug solution (1 mg/ml) was exposed to the sun for 24 hours to investigate photolytic deterioration. The samples were then diluted, and an HPLC analysis was carried out [21].
To check the thermal degradation, 1 mg/ml of each drug’s solution was mixed with 2 ml of water, and the vials were kept in an oven set to 60°C for 24 hours. After diluting the samples, HPLC was used to assess the degradation [22].
Evaluation of drug entrapment efficiency (DEE) of mucoadhesive formulation
The DEE of the new GRDDS formulation including PAN and PIP, for the eradication of H. pylori infection, were evaluated using the validated reverse phase HPLC technique. To develop drug-loaded mucoadhesive beads, an ionic gelation method was employed. First, sodium alginate was dissolved in distilled water at a concentration of 7% (w/v). Concurrently, a 1% acetic acid solution was employed to dissolve calcium chloride and chitosan, with continuous agitation until achieving uniformity. The sodium alginate solution was then blended with PAN and PIP until a uniform mixture was obtained. Subsequently, the drug-loaded sodium alginate solution was added drop by drop, utilizing a 26G needle, to the homogeneous mixture of calcium chloride and chitosan which contain 5% (w/v) EUDRAGIT® L 30 D-55 for the enteric coating of the beads. The resulting beads were gathered through filtration and air-dried for a duration of 8–10 hours. These prepared spherical beads were stored in an airtight container for subsequent studies [23,24].
Determination of DEE%
The PAN and PIP-loaded mucoadhesive beads underwent a process of crushing followed by immersion in 100 ml of phosphate buffer at pH 7.4. Subsequently, the suspension was sonicated at 37°C for 1 hours and allowed to stand overnight before HPLC analysis. Following centrifugation of the resultant solution, the supernatant was further diluted 30-fold using the mobile phase (diluent) before undergoing HPLC testing to determine drug content. The calculation of the percent DEE% was carried out using Equation 1.
RESULT AND DISCUSSION
The risk of a failure of method transfer may be mitigated by first identifying and optimizing the key chromatographic parameters, and then validating the method. Because of their significant absorption at 288 and 341 nm, respectively, PAN and PIP were analyzed using HPLC coupled to a PDA detector. The samples may be analyzed by PDA detectors at many wavelengths without having to re-analyze them. ODS C18 column was used to separate PAN and PIP since their log p values of the drugs are 2.05 and 0.28, respectively. The hydrophobic benzimidazole ring of PAN and the alkyl chain of PIP interact with the hydrophobic ODS stationary phase, despite the fact that PAN and PIP themselves are non-polar. Since PAN and PIP are retained less strongly in the stationary phase due to their hydrophobic interaction, they may be readily eluted. As a result, we employed a Phenomenex C18 250 mm 4.5 mm, 5 μm column for our pilot tests. Different MPs were tested throughout method development to get the optimum separation between PAN and PIP. Trials for the method development were started with Milli-Q water (type 1 water) and ACN as a mobile phase where drug peaks were not eluted in the C18 150 × 4.5 mm column. With phosphate buffer and MeOH, drugs were not eluting. After changing of column size to C18 250 × 4.5 mm, both the drugs were eluting early as well as peak shape and plate count were observed to be less than the acceptance criteria. Phosphate buffer pH 6.2 and ACN were tried for the method development, where PAN showed retention with TR 10.9 minutes and PIP showed 12.6 minutes. A combination of organic phase (ACN and MeOH) was also used but drug peaks were not eluted.
According to their respective pKa values, PAN and PIP should be in their ionized forms at a pH of 4.5. Therefore, ammonium acetate was chosen since it is a preferred buffer for keeping the pH steady between 4.5 and 5.5 [25–30]. DoE was then used to further optimize the chromatographic conditions.
DoE-guided optimization of the method using BBD
The optimization of independent variables was conducted utilizing a three-level BBD, encompassing buffer phase (X1), buffer pH (X2), flow rate (X3), and injection volume (X4) as factors. The upper and lower limits of these critical values were determined through the OFAT method. The buffer phase was constrained to a minimum concentration of 30% and a maximum of 35%. The pH range for the buffer was specified with a minimum of 4.0 and a maximum of 5.0. Flow rates varied between 0.8 and 1.0 ml/minute, while injection volumes spanned from 10 to 20 μl. The DoEs encompassed a total of 29 distinct runs involving these independent variables, including five center points for further investigation.
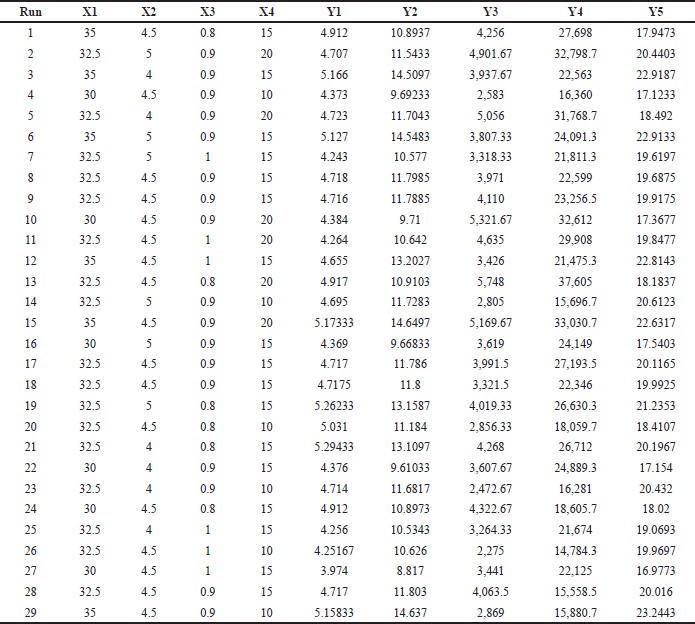 | Table 2. The DoE suggested independent variables and their corresponding responses. [Click here to view] |
These 29 different combinations of the independent variables were run through the HPLC, and the results were analyzed to determine the optimal setting. Retention time (TR) of PAN (Y1), TR of PIP (Y2), peak area (Y3), peak area (Y4), and resolution (Y5) were chosen as responses to optimize the chromatographic conditions. The results for each variable are listed in Table 2. The results of an analysis of variance (ANOVA) show that the model for the chosen independent variable is statistically significant at the 0.001 level shown in Table 3. BBD’s response surface analysis shed light on how various independent factors affected the various chromatographic outputs.
Effect of independent variables on retention time of PAN sodium (Y1)
The ANOVA results indicated that the Y1 is significantly affected by the independent parameters of X1, X2, and X3, but not by the X4. The ANOVA analysis yielded a quadratic equation (Eq. 2), which demonstrated a positive relationship between the X1 and Y1. If the buffer ratio is increased, PAN’s TR will also rise. Both the X2 and the X3 were shown to have a detrimental influence on Y1. The Y1 is not noticeably affected by the X4. The interaction between the X1 parameters was shown to affect the Y1 in the effect analysis. Interactions between independent factors that affected the response Y1 were also shown by the analysis.
Y1 = + 6.15004 + 0.693972 × A ? 0.118972 × B ? 0.407722 × C ? 0.0128889 × D ? 2.12 × AB ? 0.375 × AC + 0.00116667 × AD ? 0.0134167 × BC ? 0.00241667 × BD + 0.0624167 × CD (2)
Both the 3D plot in Figure 2a and the perturbation plot in Figure 3a demonstrated how changing the buffer ratio (A) and flow rate (C) greatly affected the PAN retention time. There was a positive correlation between Y1 and X1, but a negative correlation with X2 and X3.
Effect of independent variables on retention time of PIP (Y2)
ANOVA analysis yielded a quadratic equation (Eq. 3), which showed that X1 and X3 substantially influenced the response Y2 with p < 0.05. With a rise in X1, the Y2 also increased. As the factor X3 increased, the Y2 was raised. There was no discernible change in Y2 as a function of increasing X2 or X4. This analysis also found that the interplay between X1 and X3 had a significant effect on Y2 (p < 0.05).
Y2 = + 11.628 + 2.00381 × A + 0.00616667 × B ? 0.479556 × C ? 0.0324722 × D ? 0.00483333 × AB + 1.09733 × AC ? 0.00125 × AD ? 0.00158333 × BC ? 0.0519167 × BD + 0.0724167 × CD (3)
The 3D plot Figure 2b and the perturbation plot Figure 2b indicated that Y2 was considerably altered by adjusting the buffer ratio (A) and flow rate (C). Increasing the buffer ratio was shown to enhance Y2, whereas increasing the flow rate decreased Y2.
Effect of independent variables on peak area of PAN sodium (Y3)
There is a statistically significant relationship between the independent variables X3 and X4, but only a marginal one between X1 and X2. Equation (4) derived using ANOVA revealed that an increase in X4 may increase the Y3 and a reduction in X3 can increase the Y3. In principle, increasing the injection volume increases the number of moles of analyte accessible to emit signal. A higher Y3 concentration may explain this. Similarly, as the flow rate increases, the contact duration for the analyte with the stationary phase diminishes, resulting in a small decline in response Y3. The findings demonstrated that the reaction Y3 is affected by the interaction between X3 and X4.
Y3 = + 3583.08 ? 49.9167 × A + 387.611 × B ? 399.694 × C + 1266.78 × D ? 201.333 × AB ? 64.25 × AC + 55.5 × AD ? 13.0833 × BC + 157.25 × BD ? 180.917 × CD (4)
Both the 3D plot in Figure 2c and the perturbation plot in Figure 3c demonstrated how changing the injection volume (D) can affect Y3. The Y3 was solely affected by the injection volume.
Effect of independent variables on peak area of PIP (Y4)
There was a statistically significant relationship between the independent variables X3, X4, and Y4 (p < 0.05). An increase in X4 and a decrease in X3 both increase the Y4, as shown by the interaction equation generated from ANOVA (Eq. 5). The interaction between components X3 and X4 was also proven to be significant. There is no statistically significant relationship between X1, X2, and Y4.
Y4 = + 23742.6 ? 530.806 × A + 76.4722 × B ? 1961.06 × C + 8388.39 × D + 474.25 × AB ? 2435.5 × AC + 224.5 × AD ? 54.75 × BC + 403.583 × BD ? 1105.42 × CD (5)
Figures 2d and 3d indicated that adjusting the injection volume (D) greatly affected the Y4. It was discovered that increasing the injection volume led to a larger Y4.
Effect of independent variables on resolution (Y5)
Response Y5 was the most sensitive to changes in the independent variables among all the others considered in this research work. Resolution is defined as the temporal gap between two adjacent peaks during elution. Responses Y1 and Y2 would show the effect on the response Y5. The impact of the independent variables on the dependent variable Y5 was shown by the quadratic equation (Eq. 6) produced by the ANOVA analysis. The independent variables X1 and X2 exhibited significant reactions in the region of Y5 (p < 0.05). Increases in both X2 and X1 result in sharper separation of peaks.
Y5 = + 14.1589 ? 1.35028 × A + 1.05058 × B + 0.0322778 × C ? 0.193028 × D + 0.28225 × AB ? 0.931833 × AC ? 0.07725 × AD ? 0.169083 × BC ? 0.03225 × BD ? 0.0445833 × CD (6)
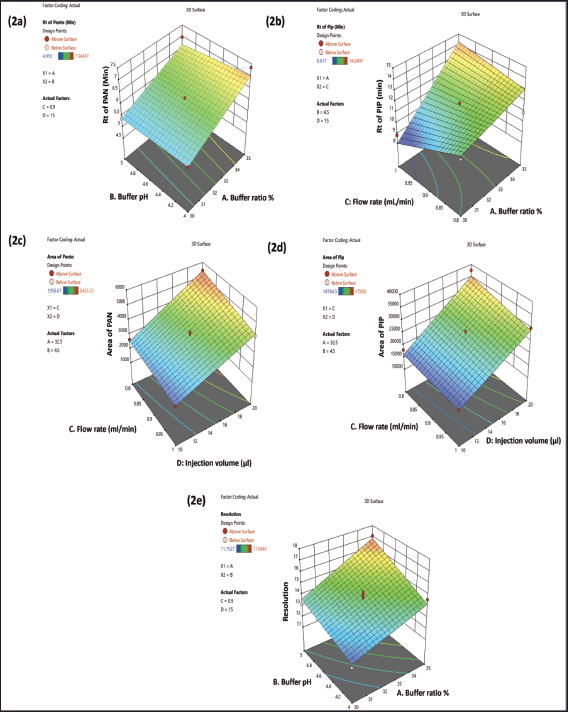 | Figure 2. The 3D surface response plot showing the effect of independent variables: (a) on the retention. [Click here to view] |
Changing the X1 and X2 considerably affected the resolution, as seen in the 3D (Fig. 2e) and the perturbation plot (Fig. 3e). Higher X1 and X2 were shown to improve Y1 (Fig. 2a); Y2 (Fig. 2b); Y3 (Fig. 2c); Y4 (Fig. 2d) and Y5 (Fig. 2e).
Desirability
A desirability plot (Fig. 4) was created using the results of the ANOVA, and the conditions of the independent variables with a desirability of 0.991 were selected as the best-suggested method by the software. As a result, the following parameters have been agreed upon. Phenomenex HyperClone C18 column (120 Å × 250 × 4.6 mm, 5 m particle size), Isocratic elution using a mobile phase consisting of ammonium acetate and methanol (30:70) at a pH of 4.5, the column oven temperature is set at 25°C, the injection volume is 15 μl, and flow rate of 0.9 ml/minute. Under these circumstances, chromatographic runs (n = 6) were performed using a Shimadzu quaternary HPLC system equipped with an autosampler and a PDA detector at 288 nm (PAN) and 341 nm (PIP) wavelengths.
After comparing observed values for all the responses with their anticipated values from the regression model, it was determined that the relative error for all replies was less than 10%. Figure 4 shows the chromatogram produced under the ideal experimental conditions.
Method validation
Parameters including retention time, tailing factor, resolution, and theoretical plates were calculated to evaluate the suitability of the system (refer to Table 4). The peaks of both drugs were clearly defined, as evidenced by their resolution of 14.058 ± 0.076. Table 4 presents the satisfactory results obtained from the assessed system suitability parameters.
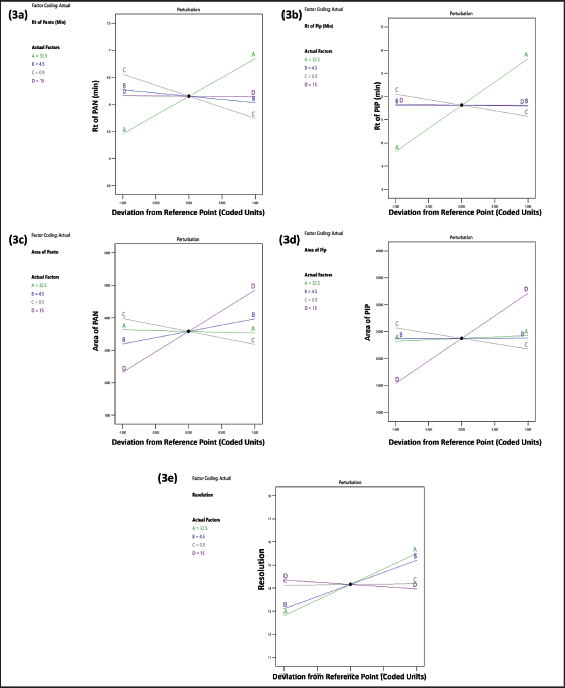 | Figure 3. Perturbation plot depicting the interactions of independent variables. (a) Retention time of PAN; Y1; (b) retention time of PIP; Y2; (c) peak area of PAN (Y3); (d) peak area of PIP (Y4), and (e) resolution (Y5). [Click here to view] |
The drug-loaded formulation (Fig. 5C) and placebo formulation (Fig. 5B) chromatograms revealed that excipients including sodium alginate, chitosan, and EUDRAGIT® L 30 D-55 did not affect the retention time of the drugs. This demonstrated the specificity of the method utilized to simultaneously quantify PAN and PIP from the prepared mucoadhesive formulations.
PAN and PIP were found to be linear in concentration from 0.5 to 20 μg/ml, with R2 values of 0.999 and 0.999, respectively. The developed method was well-suited for the assessment of mucoadhesive formulations. For PAN and PIP, the linear equations corresponding to the calibration curve were Y = 32,744x – 683.21 and Y = 130,540x – 957.44, respectively.
The accuracy of both drugs was determined simultaneously through the measurement of percentage recoveries at three distinct concentrations (80%, 100%, and 120%). Both PAN and PIP exhibited recovery rates within the acceptable range of 90%–110%. This demonstrates that the concurrently analyzed method is suitable for the precise estimation of both substances. The accuracy of the method was assessed for both intra-day and inter-day fluctuations in PAN and PIP. The relative standard deviation (%RSD) for both intra-day and inter-day method precision was estimated to be below 2.0%. It LOD and LOQ for PAN were found to be 65 and 90 ng/ml, whereas for PIP they were 25 and 41 ng/ml, respectively (Table 4). The LOD (Eq. 7) and LOQ (Eq. 8) were calculated using the following formulas, where σ refers to the SD of the response, and s refers to the slope, which is obtained from the calibration plot.
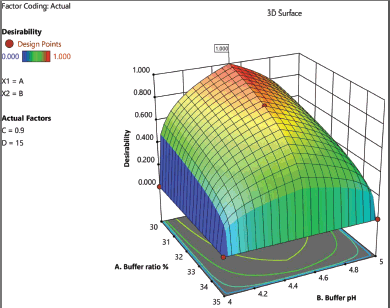 | Figure 4. The 3D surface response desirability plot for the optimized analytical method. [Click here to view] |
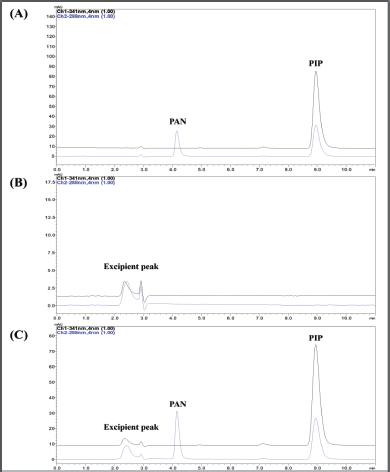 | Figure 5. Chromatogram obtained at optimized conditions. (A) Chromatogram of PAN sodium and PIP. (B) Chromatogram of blank formulation. (C) Chromatogram of formulation containing PAN and PIP. [Click here to view] |
The impact of modifying the buffer pH, column temperature, flow rate, injection volume, and maximum absorbance on the experiment was thoroughly examined. Notably, the retention time (TR), peak area, tailing factor, and theoretical plates exhibited no significant variations in response to these minor adjustments. This underscores the robustness of the current analytical approach, ensuring its suitability for simultaneous testing of both medications. (Robustness data are provided as a supplementary Table S2).
The stability of 1 μg/ml stock solutions of PAN and PIP in triplicate at bench top (room temperature) was evaluated for up to 24 hours [31]. We also evaluated the stability of the autosampler at 15°C for a period of 24 hours. The percentage shift from the baseline concentration was computed. Notably, the drug recovery from the stability solutions remained within the acceptable range of 100%–105% even after 24 hours, with a RSD of under 2% (Table 4).
Forced degradation study results
A forced degradation study was conducted to assess the resistance of PAN and PIP to the formulation development environment. As a result, a comprehensive analysis of degradation was conducted. The degradation corresponding to different stress conditions is illustrated in Figure 6. The degradation process was carried out on over 87% of the PAN and 25% of the PIP under severe acidic conditions such as 1 M HCl. In contrast, degradation of PAN exceeded 80% and that of PIP was 27% under less acidic conditions such as 0.1 M HCl. PAN exhibited signs of degradation when exposed to alkaline conditions. However, the degradation of PAN and PIP at alkaline conditions was 75.71% and 16.15% at 0.1 M NaOH. The degradation of PAN and PIP on 1 M NaOH was 84.13% and 16.97%, respectively. Degradation was more than 97% for PAN and more than 30% for PIP the oxidation condition with H2O2. Degradation was less than 10% for both drugs at forced temperature and sunlight (UV) conditions.
Results of DEE of mucoadhesive formulation using the validated method
Formulation parameters, such as DEE, play a crucial role in various drug delivery systems, including liposomes, nanoparticles, microspheres, and other carriers like mucoadhesive beads. DEE gauges the effectiveness of a formulation in safeguarding the medication within its carrier. Entrapment efficiency, expressed as a percentage, measures the portion of the active ingredient in the formulation successfully incorporated into the carrier. DEE holds importance due to its direct impact on the effectiveness and productivity of the distribution network. Entrapment efficiency is influenced by various crucial formulation factors, including the polymer concentration, drug-to-polymer ratio, polymer solubility in the organic phase, dispersion-to-continuous phase ratio, drug-polymer interactions, and the drug’s solubility in the continuous phase. The PAN and PIP concentrations within the mucoadhesive formulation were determined through the established HPLC method and the % DEE was calculated using Equation (1). In preliminary experiments, lower drug entrapment levels were observed. This issue was resolved by optimizing the polymer-to-drug ratio to maximize entrapment. Ultimately, the final formulation exhibited an entrapment efficiency of 80%–85% for PAN and 60%–67% for PIP.
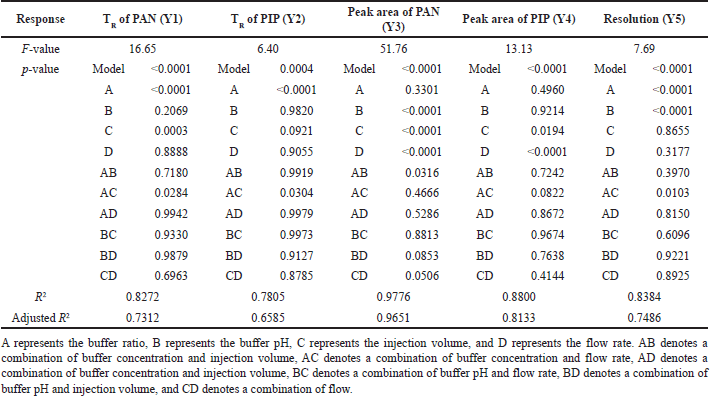 | Table 3. ANOVA results of Box-Benhken design. [Click here to view] |
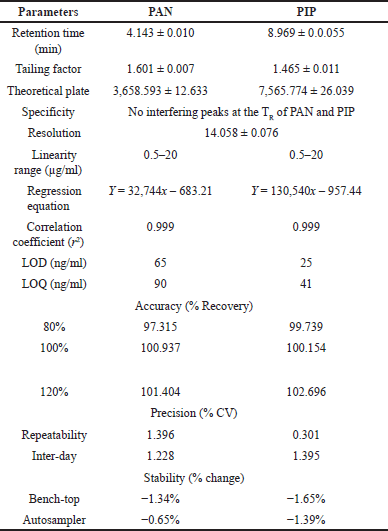 | Table 4. Validation data of the optimized analytical method. [Click here to view] |
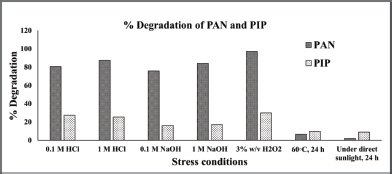 | Figure 6. Column chart representation of forced degradation study results of PAN sodium and PIP showing the % degradation under each condition. [Click here to view] |
Greenness of analytical procedure
The environmental friendliness of the suggested analytical technique was assessed by analyzing 12 Green Analytical Procedure Index (GAPI) factors related to the sample, the reagents and compounds, and the equipment. Collection, storage, transportation, processing, extraction volume, solvent or reagent used, and supplementary reagents are all examples of independent variables. Chemicals and reagents came with their own set of risks, including the quantity of solvent/reagent needed and potential dangers to human health and safety. The energy, occupational risk, garbage, and garbage treatment were considered [32]. Using the GAPI software, we created an illustration (Fig. 7) that conveys the method’s friendliness to the environment. The ability to be used for both quantitative and qualitative objectives is represented by a circle in the center of a pictogram. The color red indicates a critical threat to the environment, whereas yellow and green indicate less of a threat and more greenness, respectively. As a whole, the approach was environmentally friendly, scoring six green, six yellow, and three red.
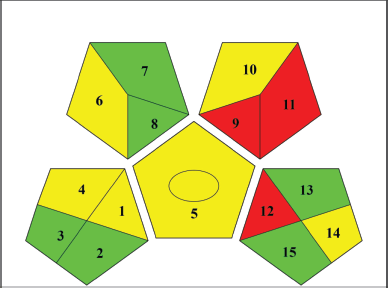 | Figure 7. GAPI pictogram of proposed HPLC method for the estimation of PANand PIP from the GRDDS mucoadhesive formulation. The color red represents a high danger to the environment, while yellow and green symbolize lower danger and better greenness. Eight parameters relating to the sample (collection, preservation, transport, storage, types of processing method, scale of extraction, solvent/reagent used and additional reagent, and so on), three parameters relating to reagents and compounds (amount to solvent/reagent, health hazard, and safety hazard) and four parameters relating to instrumentation (energy, occupational hazard, waste, and waste treatment). [Click here to view] |
CONCLUSION
An effective RP-HPLC method was developed to simultaneously estimate PAN and PIP. A three-level Box-Behnken response surface configuration was implemented to optimize the analytical procedure. The linearity, sensitivity, accuracy, precision, and robustness were all verified in compliance with the ICH standards of the optimized analytical method. In addition, investigations into stress-induced degradation confirmed the sensitivity of the validated method to degradation products such as PAN and PIP. The method that had been validated was employed to quantify PAN and PIP using chitosan-based sodium alginate mucoadhesive particles. The components of the formulation exhibited no interaction with the retention periods of PAN and PIP. This method could be employed for the successful formulation development and analysis of these drugs.
LIST OF ABBREVIATIONS
PAN: Pantoprazole sodium; PIP: Piperine; H. pylori: Helicobacter pylori; GRDDS: Gastroretentive drug delivery system; ANOVA: Analysis of variance; BBD: Box-Behnken design; DoE: Design of experiments; OFAT: One factor at a time; HPLC: High performance liquid chromatography; ICH: International Conference on Harmonization; GAPI: Green Analytical Procedure Index.
ACKNOWLEDGEMENT
The authors are thankful to the Indian Council of Medical Research (ICMR), India, for the funding provided under the ICMR-SRF fellowship program. The authors are also grateful to Manipal Academy of Higher Education, Manipal, Karnataka, for providing the facilities. The authors are thankful for Biorender.com, a figure-making tool.
AUTHOR CONTRIBUTIONS
All authors made substantial contributions to conception and design, acquisition of data, or analysis and interpretation of data; took part in drafting the article or revising it critically for important intellectual content; agreed to submit to the current journal; gave final approval of the version to be published; and agree to be accountable for all aspects of the work. All the authors are eligible to be an author as per the International Committee of Medical Journal Editors (ICMJE) requirements/guidelines.
FINANCIAL SUPPORT
The work is funded by the Indian Council of Medical Research (ICMR). File no. 3/2/2/16/2022-NCD-III.
CONFLICTS OF INTEREST
The authors report no financial or any other conflicts of interest in this work.
ETHICAL APPROVALS
This study does not involve experiments on animals or human subjects.
DATA AVAILABILITY
The authors confirm that the data supporting the findings of this study are available within the article and its supplementary materials.
USE OF ARTIFICIAL INTELLIGENCE (AI)-ASSISTED TECHNOLOGY
The authors declares that they have not used artificial intelligence (AI)-tools for writing and editing of the manuscript, and no images were manipulated using AI.
PUBLISHER’S NOTE
All claims expressed in this article are solely those of the authors and do not necessarily represent those of the publisher, the editors and the reviewers. This journal remains neutral with regard to jurisdictional claims in published institutional affiliation.
REFERENCES
1. Chmiela M, Kupcinskas J. Review: pathogenesis of helicobacter pylori infection. Helicobacter. 2019;24(S1):1–5.
2. Ahn HJ, Lee DS. Helicobacter pylori in gastric carcinogenesis. World J Gastrointest Oncol. 2015 Dec 15;7(12):455–65.
3. Gupta A, Shetty S, Mutalik S, Chandrashekar HR, Nandakumar K, Mathew EM, et al. Treatment of H. pylori infection and gastric ulcer: need for novel pharmaceutical formulation. Heliyon. 2023 Oct 1;9(10):e20406.
4. Ullah G, Nawaz A, Latif MS, Shah KU, Ahmad S, Javed F, et al. Clarithromycin and pantoprazole gastro-retentive floating bilayer tablet for the treatment of Helicobacter Pylori: formulation and characterization. Gels. 2023 Jan;9(1):43.
5. Damanhuri NS, Kumolosasi E, Omar MS, Razak AFA, Mansor AH. The influence of P-glycoprotein expression in the standard treatment of Helicobacter pylori infection in Sprague Dawley rats. Daru. 2021 Jun 1 [cited 2023 May 23];29(1):13–22. Available from: https://doi.org/10.1007/s40199-020-00377-2
6. Lomovskaya O, Bostian KA. Practical applications and feasibility of efflux pump inhibitors in the clinic—A vision for applied use. Biochem Pharmacol [Internet]. 2006 Mar 30 [cited 2023 May 23];71(7):910–8. Available from: https://www.sciencedirect.com/science/article/pii/S0006295205008154
7. Tharmalingam N, Kim SH, Park M, Woo HJ, Kim HW, Yang JY, et al. Inhibitory effect of piperine on Helicobacter pylori growth and adhesion to gastric adenocarcinoma cells. Infectious Agents Cancer. 2014;9(1):1–15.
8. Mohamed D, ELbalkiny HT. Application of solidified floating organic droplet dispersive liquid–liquid microextraction for determination of veterinary antibiotic residues in milk samples with greenness assessment. Microchem J. 2023 Oct 1;193:109153.
9. Chiriac U, Rau H, Frey OR, Röhr AC, Klein S, Meyer AL, et al. Validation and application of an HPLC-UV method for routine therapeutic drug monitoring of dalbavancin. Antibiotics. 2022 May;11(5):541.
10. Benito-Peña E, Partal-Rodera AI, León-González ME, Moreno-Bondi MC. Evaluation of mixed mode solid phase extraction cartridges for the preconcentration of beta-lactam antibiotics in wastewater using liquid chromatography with UV-DAD detection. Anal Chim Acta. 2006 Jan 25;556(2):415–22.
11. Zimmer J, Röhr AC, Kluge S, Faller J, Frey OR, Wichmann D, et al. Validation and application of an HPLC-UV method for routine therapeutic drug monitoring of cefiderocol. Antibiotics. 2021 Mar;10(3):242.
12. Mutalik SP, Mullick P, Pandey A, Kulkarni SS, Mutalik S. Box–Behnken design aided optimization and validation of developed reverse phase HPLC analytical method for simultaneous quantification of dolutegravir sodium and lamivudine co-loaded in nano-liposomes. J Sep Sci. 2021 Aug;44(15):2917–31.
13. Naik S, Mullick P, Mutalik SP, Hegde AR, Lewis SA, Bhat K, et al. Full factorial design for development and validation of a stability-indicating RP-HPLC method for the estimation of timolol maleate in surfactant-based elastic nano-vesicular systems. J Chromatogr Sci. 2022 Jul 12;60(6):584–94.
14. Chaudhari BB, Devadiga BH, Matcha S, Lewis LE, Mallayasamy S, Moorkoth S. Validated HPLC method for ceftriaxone from dried blood spots for pharmacokinetic studies and therapeutic drug monitoring in neonatal population. Bioanalysis. 2023 Apr;15(8):449–63.
15. Ganorkar SB, Shirkhedkar AA. Design of experiments in liquid chromatography (HPLC) analysis of pharmaceuticals: analytics, applications, implications and future prospects. Rev Anal Chem. 2017 Sep 1 [cited 2023 Jul 9];36(3):20160025. Available from: https://www.degruyter.com/document/doi/10.1515/revac-2016-0025/html?lang=en; https://doi.org/10.1515/revac-2016-0025
16. Hamid MHM, Elsaman T. A stability-indicating RP-HPLC-UV method for determination and chemical hydrolysis study of a novel naproxen prodrug. J Chem. 2017 Oct 25;2017:e5285671.
17. Gupta A, Navti PD, Mutalik S, Saha M, Moorkoth S. DoE guided development of an HPLC method for evaluation of amoxicillin and metronidazole co-loaded mucoadhesive GRDDS formulation for H. pylori eradication. Chromatographia. 2023 Oct 28;86:729–42. [cited 2023 Oct 29]. Available from: https://doi.org/10.1007/s10337-023-04290-z
18. Zaman B, Hassan W, Khan A, Mushtaq A, Ali N, Bilal M, et al. Forced degradation studies and development and validation of HPLC-UV method for the analysis of velpatasvir copovidone solid dispersion. Antibiotics (Basel). 2022 Jul 5;11(7):897.
19. ?uromska-Witek B, ?mudzki P, Szlósarczyk M, Ma?lanka A, Hubicka U. Development and validation of stability-indicating HPLC methods for the estimation of lomefloxacin and balofloxacin oxidation process under ACVA, H2O2, or KMnO4 treatment. Kinetic evaluation and identification of degradation products by mass spectrometry. Molecules. 2020 Nov 11;25(22):5251.
20. Goyal PK, Jaimini M. Development and validation of stability indicating Rp-Hplc method for quantitative estimation of metoprolol succinate and azelnidipine from synthetic mixture. J Pharm Negat Results. 2023 Feb 6;772–9.
21. Emanuelli J, Eva Scherman Schapoval E. Stability-indicating HPLC method for estimation of omarigliptin in tablets – Oxidative and photolytic kinetics and degradation products formed under oxidative conditions. Microchem J. 2020 Sep 1;157:105084.
22. Peraman R, Lalitha KV, Raja NM, Routhu HB. Identification of degradation products and a stability-indicating RP-HPLC method for the determination of flupirtine maleate in pharmaceutical dosage forms. Sci Pharm. 2014;82(2):281–93.
23. Gadzi?ski P, Froelich A, Jadach B, Wojty?ko M, Tatarek A, Bia?ek A, et al. Ionotropic gelation and chemical crosslinking as methods for fabrication of modified-release gellan gum-based drug delivery systems. Pharmaceutics. 2023 Jan;15(1):108.
24. Noreen S, Hasan S, Ghumman SA, Anwar S, Gondal HY, Batool F, et al. Formulation, statistical optimization, and In Vivo pharmacodynamics of cydonia oblonga mucilage/alginate mucoadhesive microspheres for the delivery of metformin HCl. ACS Omega. 2023 Feb 14;8(6):5925–38.
25. Hoizey G, Lamiable D, Frances C, Trenque T, Kaltenbach M, Denis J, et al. simultaneous determination of amoxicillin and clavulanic acid in human plasma by HPLC with UV detection. J Pharm Biomed Anal. 2002 Oct 15;30(3):661–6.
26. Batrawi N, Wahdan S, Al-Rimawi F. A validated stability-indicating HPLC method for simultaneous determination of amoxicillin and enrofloxacin combination in an injectable suspension. Sci Pharm. 2017;85(1):6.
27. Bellur Atici E, Yazar Y, A?ta? Ç, Ridvano?lu N, Karl??a B. Development and validation of stability indicating HPLC methods for related substances and assay analyses of amoxicillin and potassium clavulanate mixtures. J Pharm Biomed Anal. 2017 Mar 20;136:1–9.
28. Dorn C, Kratzer A, Schießer S, Kees F, Wrigge H, Simon P. Determination of total or free cefazolin and metronidazole in human plasma or interstitial fluid by HPLC-UV for pharmacokinetic studies in man. J Chromatogr B Analyt Technol Biomed Life Sci. 2019 Jun 15;1118–1119:51–4.
29. Maher HM, Youssef RM, Khalil RH, El-Bahr SM. Simultaneous multiresidue determination of metronidazole and spiramycin in fish muscle using high performance liquid chromatography with UV detection. J Chromatogr B Analyt Technol Biomed Life Sci. 2008 Dec 15;876(2):175–81.
30. Wang Y, Zhang P, Jiang N, Gong X, Meng L, Wang D, et al. Simultaneous quantification of metronidazole, tinidazole, ornidazole and morinidazole in human saliva. J Chromatogr B. 2012 Jun 15;899:27–30.
31. Yang DZ, An YQ, Jiang XL, Tang DQ, Gao YY, Zhao HT, et al. Development of a novel method combining HPLC fingerprint and multi-ingredients quantitative analysis for quality evaluation of traditional Chinese medicine preparation. Talanta. 2011 Aug 15;85(2):885–90.
32. P?otka-Wasylka J. A new tool for the evaluation of the analytical procedure: green analytical procedure index. Talanta. 2018 May 1;181:204–9.
33. Gupta A, Akhtar J, Rastogi KC, Badruddeen, Khan MI, Ahmad M. Stability indicating HPLC method for In-vitro determination of pantoprazole sodium and its degradation products in simulated gastric and intestinal fluids. Curr Pharm Anal. 2023 Dec 1;19(10):767–75.
34. Sanam S, Halder S, Rahman SMA. Simultaneous pharmacokinetic evaluation of pantoprazole and vitamin B complex for assessing drug–drug interactions in healthy bangladeshi adults by a newly developed and validated HPLC method. Separations. 2023 Mar;10(3):170.
35. Todorovi? N, ?anji Pani? J, Zaviši? M, Krtolica J, Ratajac R, Petrovi? J, et al. Compounding of liquid and solid dose adjustable formulations with pantoprazole: comparison of stability, applicability and suitability. Pharmaceutics. 2023 Mar;15(3):717.
36. Panda SS, Panigrahi S, Mohanty S, Bera RKVV, Mekap SK. Liquid chromatographic methods for simultaneous quantification of fixed-dose combinations of pantoprazole with itopride and ondansetron: application to method greenness assessment. Sep Sci Plus. 2023;6(5):2300007.
37. Lin J, Liu Y, Zhang J, Lu Z, Guo J, Huang Y, et al. Development and application of a supercritical fluid chromatography-tandem mass spectrometry method for the simultaneous determination of pantoprazole enantiomers in rat plasma. J Pharm Biomed Anal Open. 2023 Dec 1;2:100016.
38. Setyaningsih D, Santoso YA, Hartini YS, Murti YB, Hinrichs WLJ, Patramurti C. Isocratic high-performance liquid chromatography (HPLC) for simultaneous quantification of curcumin and piperine in a microparticle formulation containing Curcuma longa and Piper nigrum. Heliyon. 2021 Mar;7(3):e06541.
39. Gupta I, Adin SN, Aqil M, Mujeeb M, Sultana Y. Quality by design-based development and validation of an HPLC method for simultaneous estimation of pregabalin and piperine in dual drug-loaded liposomes. Biomed Chromatogr. 2023 Jan;37(1):e5510.
40. Kurangi B, Jalalpure S, Jagwani S. A validated stability-indicating HPLC method for simultaneous estimation of resveratrol and piperine in cubosome and human plasma. J Chromatogr B Analyt Technol Biomed Life Sci. 2019 Aug 1;1122–1123:39–48.
41. Kamal YT, Mohammed Musthaba S, Singh M, Parveen R, Ahmad S, Baboota S, et al. Development and validation of HPLC method for simultaneous estimation of piperine and guggulsterones in compound Unani formulation (tablets) and a nanoreservoir system. Biomed Chromatogr. 2012;26(10):1183–90.
42. Sethi P, Dua VK, Mohanty S, Mishra SK, Jain R, Edwards G. Development and validation of a reversed phase HPLC method for simultaneous determination of curcumin and piperine in human plasma for application in clinical pharmacological studies. J Liq Chromatogr Relat Technol. 2009 Nov 18;32(20):2961–74.