INTRODUCTION
Epilepsy is a neurological disorder with more than 5 million new cases yearly and affects more than 50 million worldwide, where 80% of people with epilepsy are in low and middle-income countries (WHO, 2019). It is estimated that 1.5 million people have epilepsy, with a 0.5%–0.6% prevalence in the Indonesian population. To control seizures, epilepsy patients are treated with anticonvulsant drugs. In recent years, many new anticonvulsants have been developed and considered the new generation anticonvulsants. Nevertheless, the older generation of anticonvulsants is still widely used and has not shown inferiority compared to the new generation of anticonvulsants (Lee, 2014). One of the older generations of anticonvulsant drugs still widely used is phenytoin (PHT) (Shorvon et al., 2016).
PHT is one of the most widely used anticonvulsant drugs to treat generalized seizures, focal seizures, and status epilepticus. However, PHT has a narrow therapeutic index range of 10–20 μg/ml, so it is very important to achieve a balanced plasma concentration to avoid dose-related side effects (DrugBank, 2022; Gupta and Tripp, 2022). It was reported that the enzyme system can become saturated with PHT, whereas increasing the dose of PHT can lead to decreased elimination. A small modification in the dose of PHT can cause significant changes in its plasma concentration so that therapeutic drug monitoring (TDM) is needed to measure drug concentration in the biological matrix after administration to optimize the pharmacological response of drug therapy and valuable for monitoring patient adherence to drug regimens (Dasgupta, 2008). Measuring drug concentrations in biological matrices requires appropriate and validated bioanalytical methods (Food and Drug Administration, 2018).
Liquid chromatography with tandem mass spectrometry (LC-MS/MS) is one of the instruments used in bioanalytical methods validation which provides many advantages over the high-performance liquid chromatography (HPLC) method using other detectors such as a simple sample handling process, high specificity, and short analysis time (Villanelli et al., 2015). However, LC-MS/MS instruments require expensive maintenance costs and are not necessarily available in various laboratories in Indonesia. Therefore, HPLC with an ultraviolet (UV) detector is another alternative that can be used to determine anticonvulsant drug levels routinely besides LC-MS/MS (Baldelli et al., 2015).
In several recent studies, the measurement of anticonvulsant drug levels has used large amounts of plasma (Villanelli et al., 2015). The development of methods and monitoring of plasma PHT drug levels have been carried out previously (Dural et al., 2021). However, plasma collection using the venipuncture technique is more invasive for patients and has weaknesses, such as large sample volume, proper storage conditions (freezer), and requiring a phlebotomist for sampling. This can make the patient uncomfortable, especially if sampling is done at several points. Therefore, a sampling technique is needed to reduce the number of collection volumes and is easier to use by applying the microsampling technique as part of green chemistry (Harahap et al., 2020).
Microsampling techniques that have been developed, such as dried blood spot (DBS) and volumetric absorptive microsampling (VAMS), have been widely used in clinical studies, one of which is TDM. However, DBS has several disadvantages compared to VAMS, such as the effect of hematocrit (HCT) in blood samples that can influence the spread of the blood sample on DBS paper. VAMS is a modern alternative made to cover the disadvantage of DBS equipped with a porous hydrophilic tip that can absorb a fixed volume of sample, thereby allowing the collection of precise amounts of sample volume without being affected by HCT (Harahap et al., 2020). Based on this, it is necessary to develop a PHT bioanalysis method in VAMS using HPLC with a UV-Vis detector, and its application in monitoring PHT levels in the blood of epilepsy patients in Dr. Cipto Mangunkusumo National Central General Hospital is expected to develop the ability to obtain and use valid analytical methods for monitoring of PHT therapy routinely.
MATERIALS AND METHODS
Materials
The standard used is PHT sodium and the internal standard is carbamazepine, obtained from the Indonesian Food and Drug Authority. The chemical reagents used included ethanol, acetonitrile HPLC grade, methanol HPLC grade obtained from Merck, and distilled water obtained from Ikapharmindo. The blood was obtained from the Indonesian Red Cross and the sampling tool used was VAMS Mitra® Clamshell 30 μl obtained from Neoteryx.
Instrumentation
HPLC LC-20AD type equipped with a pump, a UV-Vis detector, SIL-20A autosampler (Shimadzu), and the autosampler vial (Waters). Sample analysis was performed using a C18 analytical column (Zorbax Eclipse Plus, 250 × 4.6 mm, 5 μm; Agilent) and processed with data processing software (Asset Optimization Consultant). Samples were prepared using a sample cup (OneMed), pipetted using a micropipette (Soccorex), sonicated using a sonicator (Branson), vortexed using a vortex tool (Thermo Scientific), centrifuged using a microcentrifuge (Spectrafuge 16M), and evaporated using an evaporator (TurboVap LV).
Procedure
Chromatography system
The analysis was performed using a C18 column (250 × 4.6 mm, 5μm; Zorbax Eclipse Plus) with a column oven temperature set at 40°C. The mobile phase used was distilled water: acetonitrile: methanol (48:12:40) with a flow rate of 1.0 ml/minute and an injection volume of 30 μl. The detector used is UV-Vis, with a wavelength of 205 nm (Harahap et al., 2022).
Optimization of PHT in VAMS sample preparation
Samples were taken using VAMS as much as 30 μl and dried for 2 hours at room temperature. Then, the VAMS tip was inserted into the sample cup, 30 μl of internal standard (50 μg/ml) was added, and 800 μl of solvent was extracted using sonication and vortex and then centrifuged at 10,000 rpm for 5 minutes. Moreover, 650 μl of the supernatant was taken, transferred to a test tube, and evaporated at 60°C for 30 minutes using nitrogen. The dried residue was then reconstituted using 100 μl of mobile phase, vortexed for 15 seconds, then, sonicated at 30°C for 5 minutes. Before the sample was put into the autosampler vial, the sample was centrifuged for 5 minutes at 10,000 rpm, then injected into the HPLC system as much as 30 μl. Optimized parameters were extraction solvent, sonication time, and vortex time.
Method validation of PHT analysis in VAMS
The method validation carried out in this study referred to the 2018 Food and Drug Administration (FDA) Bioanalytical Method Validation Guidance for Industry. Validated parameters are lower limit of quantification (LLOQ), calibration curve linearity, selectivity, carryover, accuracy and precision, recovery, dilution integrity, and stability.
Blood sampling on epilepsy patients
The samples used in this study were obtained from epilepsy patients at Dr. Cipto Mangunkusumo, who were taken using VAMS with inclusion criteria: epilepsy patients receiving a PHT dosage regimen in monotherapy or combination with other anticonvulsant drugs at a dose of 2 × 100 mg or 3 × 100 mg; those receiving a PHT dosing regimen longer than 2 weeks (stable condition); those aged 18–50 years at the time of blood sampling; those who signed the informed consent form as an indication of the patient’s willingness to participate in this study. Exclusion criteria were patients who had stopped treatment, received a combined dose regimen of PHT with carbamazepine, and had liver and kidney problems.
Analysis of study sample
The analysis was carried out to determine the concentration of PHT levels in the blood of epilepsy patients who were given a single dose of PHT or in combination with other anticonvulsant drugs. From the analysis results, the analytes area and internal standards are compared to obtain the peak area ratio, which will then be entered into the regression equation of the calibration curve made on the same day as the sample analysis day to obtain the measured analyte concentration. The data interpretation of the results of the PHT levels analysis in the subject’s blood was compared with the therapeutic window range for PHT, which was 10–20 μg/ml.
RESULTS AND DISCUSSION
Optimization of PHT in VAMS sample preparation
Before conducting bioanalytical validation, the PHT analyte contained in VAMS must first be extracted through the sample preparation stage, which is a critical and quite difficult part, especially in extracting and withdrawing the analyte from the biological matrix (Vaghela et al., 2016).
The selection of the extraction solvent is essential in increasing the yield of the extracted analyte. In this study, the extraction solvent was optimized using three different solvents, namely, acetonitrile, methanol, and ethanol. Based on the optimization results obtained, the most optimal extraction solvent is methanol because the samples extracted using methanol produced the largest area of PHT compared to using acetonitrile or ethanol.
Optimization of the sonication time was carried out to extract the optimal number of samples and increase the efficiency of working time. The time used for sample sonication was optimized for 15, 30, and 45 minutes. Based on the optimization results obtained, the sonication time between one and the other did not significantly affect the area of the analyte, so the fastest sonication time was chosen, which was 15 minutes.
In addition to sonication, the samples were vortexed to attract analytes and make them homogeneous. In this study, the vortex time was optimized for 1, 2, and 3 minutes. Based on the results of the optimization that has been done, the optimum vortex time is 2 minutes. This is because the area of analyte obtained at 2 minutes of vortex time is greater than 1 minute and not much different from 3 minutes of vortex time.
Method validation of PHT analysis in VAMS
LLOQ and calibration curve
Based on the performed analyses, an LLOQ value of 0.1 μg/ml was obtained with %diff between 10.21% to 18.89% and coefficient variation (CV) of 3.15% (requirements: %diff and %CV not more than ± 20%). The calibration curve with a concentration range of 0.1–30.0 μg/ml obtained a linear result with a correlation coefficient of r ≥ 0.9995. The results of blank, LLOQ, and upper limit of quantification (ULOQ) chromatograms can be seen in Figures 1–3, respectively.
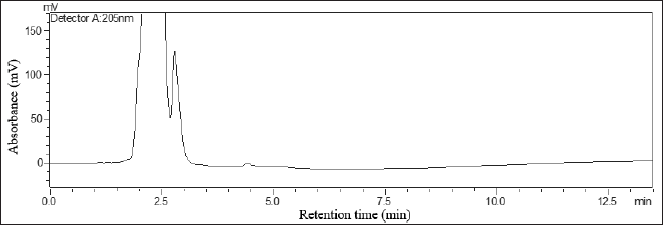 | Figure 1. Chromatogram of the blank. [Click here to view] |
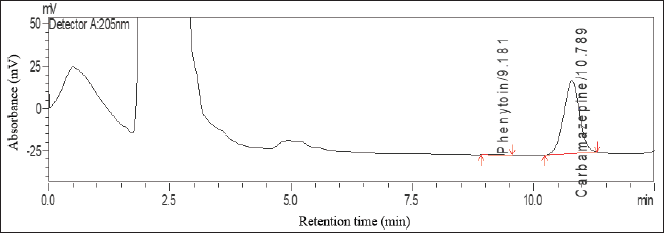 | Figure 2. Chromatogram of LLOQ. [Click here to view] |
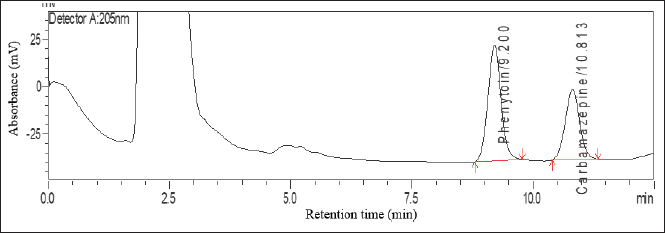 | Figure 3. Chromatogram of ULOQ. [Click here to view] |
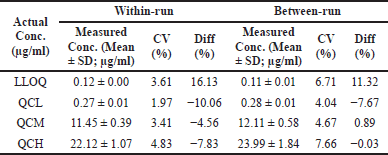 | Table 1. The results of within-run and between-run accuracy and precision. [Click here to view] |
Selectivity
The selectivity test was performed by analyzing the LLOQ concentration (0.1 μg/ml) using six different sources and the blank sample without analyte and internal standard as many as two replicas, respectively. The results obtained from this test, the percentage of interference during the retention time of PHT was in the range of 0.00%–9.72%. In contrast, at the internal standard retention time, no interfering components were detected (requirements: interference is not more than 20% for the retention time of the analyte and not more than 5% for the standard internal retention time).
Carryover
The carryover test was performed by analyzing the highest concentration sample in the calibration curve (ULOQ), followed by injecting a blank sample without an analyte and internal standard to confirm the presence of the analyte and internal standard in the next injection performed. In addition, the LLOQ concentration was analyzed to compare the peak area that appears in the blank sample. The peak areas in the analyte and internal standard retention times were observed and compared with the peak area in the LLOQ concentration. Based on the test results, no peak area was detected at the retention time of the analyte and internal standard (requirement: NMT 20% interference in analyte retention time and NMT 5% in internal standard retention time).
Accuracy and precision
Accuracy and precision have been accomplished by analyzing four different concentrations, specifically the (LLOQ; 0.1 μg/ml), quality control low (QCL; 0.3 μg/ml), quality control medium (QCM; 12.0 μg/ml), and quality control high (QCH; 24.0 μg/ml) in five replicas. In addition, accuracy and precision were carried out during one continuous analysis time (within-run) and in between different processes (between-run) that were performed on three different days (requirement: %diff and %CV values not more than ± 15% for quality control and not more than ± 20% for LLOQ). Accuracy and precision analysis results are shown in Table 1.
Recovery
A recovery test was carried out to determine the samples’ concentration recovered after preparation. The recovery values were obtained by calculating the recovery values of the analytes from the sample with the extracted QCL, QCM, and QCH concentrations and compared with the nonextracted analytes by adding the analytes after extracting blanks using the analyte concentrations. Based on the analysis results, the recovery value obtained is 93.24% to 104.86%. The recovery test does not have certain conditions like other tests, and the recovery test does not have to be 100%, but the results must be consistent and reproducible (Food and Drug Administration, 2018).
Dilution integrity
The dilution integrity test was performed by diluting the sample twice with the concentration of QCH of 48.0 μg/ml to half the time, 24.0 μg/ml, and a quarter of the time, 12.0 μg/ml using methanol (requirements: %diff and %CV values not more than ± 15%). The test results of the dilution integrity test are shown in Table 2.
Stability
The stability test must be done to see how long the sample can be stored before finally being analyzed. Stability tests were performed on analyte stock solution and internal standard and dried blood samples in VAMS using concentrations of QCL and QCH. Stock solutions of PHT and internal standard were stable for 30 hours at room temperature storage and at 2°C–8°C for 31 days. The short-term stability test of VAMS samples was stable for up to 30 hours when stored at room temperature. The long-term stability of VAMS samples was stable for up to 31 days at room temperature under sealed and silica-treated conditions. Postpreparation or autosampler stability showed that the VAMS samples were stable after preparation and stored in the autosampler before being injected for 30 hours. The stability test results are shown in Table 3.
Blood sampling on epilepsy patients
This research obtained permission from the Ethics Committee of the Faculty of Medicine, Universitas Indonesia (No. 418a/UN2.F1/ETIK/PPM.00.02/2022), and Dr. Cipto Mangunkusumo National Central General Hospital, especially the Installation of Innovation and Intellectual Property Management (No. LB.02.03/2.6.1/0912/2022). Sampling was carried out on patients who met the inclusion and exclusion criteria for 3 weeks, and 30 subjects were obtained.
The subject’s blood was taken at 8 hours after administration of PHT which was taken at the fingertips as much as ± 60 μl with the finger prick method using a lancet, and then blood was taken using VAMS with an absorption capacity of ± 30 μl twice until completely absorbed. Furthermore, the blood on the VAMS dried at room temperature for 2 hours before being stored. After drying, VAMS was put into a sealed bag containing silica gel and taken to the Laboratory of Bioavailability and Bioequivalence of the Faculty of Pharmacy, Universitas Indonesia, and then stored at room temperature before being analyzed. The demographic characteristics of the subjects are shown in Table 4.
Analysis of study sample
PHT was found in all blood samples of 30 subjects, with the lowest levels in subjects with 2 × 100 mg PHT dosage regimen found in SN17 with measured levels of 0.81 ± 0.08 μg/ml and the highest levels in SN23 of 11.72 ± 0.20 μg/ml, with an average value of 4.31 ± 3.89 μg/ml, whereas in subjects with a PHT therapy regimen of 3 × 100 mg, the lowest levels found in SN29 of 1.10 ± 0.11 μg/ml, and the highest levels in SN10 of 17.45 ± 0.12 μg/ml, with an average value of 7.46 ± 4.36 μg/ml. Based on this, the average value of PHT levels in subjects with a dose of 2 × 100 mg is lower than 3 × 100 mg.
 | Table 2. Dilution integrity data. [Click here to view] |
Only 9 of 30 subjects (30.0%) met the criteria for the PHT therapeutic range (10–20 μg/ml) after 8 hours of administration, while the PHT levels in the other 21 subjects (70.0%) were below the therapeutic drug range. Two of the nine subjects received a 2 × 100 mg PHT therapy regimen, and seven others received a 3 × 100 mg PHT therapy regimen. Two of the nine subjects received a single-therapy regimen of PHT, two subjects received a combination therapy regimen with valproic acid (PHT, VPA), one subject with clobazam (PHT, CLB), one subject with levetiracetam (PHT, LEV), one subject with VPA and CLB (PHT, VPA, CLB), one subject with topiramate (PHT, TPM), and one subject with CLB and lamotrigine (PHT, CLB, LTG).
Dural et al. (2021) conducted a study monitoring PHT therapy in seven subjects who received 100, 200, and 300 mg PHT doses by analyzing plasma PHT levels using HPLC. Based on the analysis results performed, three subjects with plasma PHT levels were in the drug therapy range (14.30–18.76 μg/ml), three subjects with PHT levels lower than the recommended drug therapy range (1, 12–7.07 μg/ml), and one subject had no detectable plasma PHT levels. Meanwhile, Jagennath et al. (2019) conducted a study on monitoring plasma PHT therapy using the HPLC method and the factors that influence it based on a retrospective study. In total, 50 of 170 subjects in the study received PHT monotherapy, and 16 subjects with a combination of PHT and VPA. The average plasma PHT levels obtained 8.68 ± 7.86 μg/ml in subjects with PHT monotherapy, while the subjects with a combination of PHT and VPA had an average plasma PHT level of 5.92 ± 3.99 μg/ml. This indicates that plasma levels of PHT are lower than the normal PHT therapeutic range, as well as PHT levels measured in the patient’s blood using the VAMS.
The results of PHT levels in the blood obtained vary widely. Many other factors can affect the blood levels of PHT in subjects, especially those related to drug pharmacokinetics. Some drugs, when given together, can affect the pharmacokinetic parameters of other drugs to affect their blood levels. Drug metabolism is one of the important stages that can affect drug concentration which various internal and external factors can influence. Internal factors can be age, gender, body weight, body mass index, genetics, hormones, complications, and pathological conditions that can affect liver and kidney function. In contrast, external factors can come from environmental influences, food, and medicines consumed (dose and patient compliance, induction, and inhibition of enzymes) (Chanruang et al., 2021; Jagannath et al., 2019). Based on this, it is necessary to carry out tests to see the correlation between factors that can affect blood levels of PHT and other things that can be influenced, such as the frequency of seizures and side effects experienced by the subjects.
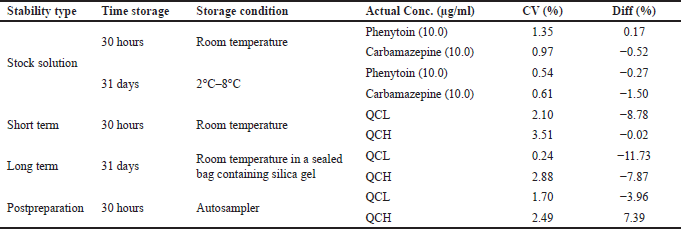 | Table 3. The result of the stability test. [Click here to view] |
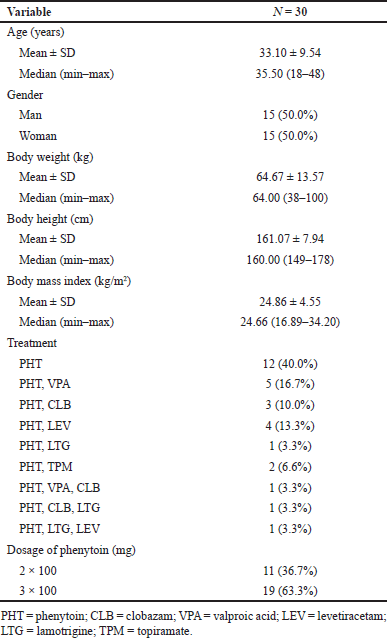 | Table 4. Demographic characteristics of the subject. [Click here to view] |
Genetic differences between subjects can affect the polymorphism of enzymes involved in drug metabolism, so it is necessary to conduct a genotyping study that analyzes the CYP2C9 enzyme, which is a PHT-metabolizing enzyme. Therefore, in the analysis of correlation relationships, it is required to include genotypic studies (analysis of CYP2C9 enzyme polymorphisms) to strengthen the records obtained from the analysis and see the correlation between phenotypic records (analysis of PHT levels in the blood of direct subjects) and the genotypic polymorphisms of drug-metabolizing enzymes so that more accurate conclusions can be drawn (Andrés et al., 2016). In addition, it is necessary to compare the analysis results between the VAMS method and plasma, which is generally widely used in the bioanalysis of drug levels, to strengthen the analysis results obtained.
CONCLUSION
The PHT analysis method in VAMS obtained valid results according to the guidance from the FDA in 2018. The calibration curve with a concentration range of 0.1–30.0 μg/ml was linear with a correlation coefficient r ≥ 0.9995. Based on the monitoring of PHT levels in the blood of 30 subjects, various levels of PHT were obtained. Subjects who received PHT at a dose of 2 × 100 mg obtained PHT levels with a range of 0.81–11.72 μg/ml and 1.10–17.45 μg/ml for a dose of 3 × 100 mg, with 9 of 30 subjects within the therapeutic drug range, indicating that the treatment given was appropriate, while the other 21 subjects had PHT levels below the appropriate therapeutic range, so dose adjustment was necessary.
ACKNOWLEDGMENT
The authors would like to thank the Directorate of Research and Development, Universitas Indonesia, which gave grants for this research, Dr. Cipto Mangunkusumo National Central General Hospital, which provides epilepsy patients, and the Faculty of Pharmacy, Universitas Indonesia, which provides bioavailability and bioequivalence laboratories and facilities to realize this study.
AUTHORS CONTRIBUTION
All authors are responsible for the contributions of this study.
FINANCIAL SUPPORT
This research is funded by the Directorate of Research and Development, Universitas Indonesia, under Hibah PUTI 2022 (Grant No. NKB-1177/UN2.RST/HKP.05.00/2022).
CONFLICTS OF INTEREST
The authors declare no conflicts of interest in this study.
ETHICAL APPROVALS
This research has received ethical approval from the Ethics Committee of the Faculty of Medicine, Universitas Indonesia with No. 418a/UN2.F1/ETIK/PPM.00.02/2022.
DATA AVAILABILITY
All data generated and analyzed are included in this research article.
PUBLISHER’S NOTE
This journal remains neutral with regard to jurisdictional claims in published institutional affiliation.
REFERENCES
Andrés FD, Terán S, Hernández F, Terán E, LLerena A. To genotype or phenotype for personalized medicine? CYP450 drug metabolizing enzyme genotype–phenotype concordance and discordance in the Ecuadorian population. OMICS J Integr Biol, 2016; 20(12):699–710.
Baldelli S, Cattaneo D, Giodini L, Baietto L, Di Perri G, D’Avolio A, Clementi E. Development and validation of a HPLC-UV method for the quantification of antiepileptic drugs in dried plasma spots. Clin Chem Lab Med, 2015; 53(3):435–44.
Chanruang A, Rakngam M, Teekachunhatean S, Daengsueptrakun K, Punyawudho B. Determination of pharmacokinetic parameters and factors influencing the pharmacokinetic parameters of phenytoin in Thai children with epilepsy. Int J Pharm Pharm Sci, 2021; 13(1):47–51.
Dasgupta A. Handbook of drug monitoring methods: therapeutics and drugs of abuse. Humana Press, Totowa, NJ, 2008.
DrugBank. Phenytoin [ONLINE]. 2022. Available via https://go.drugbank.com/salts/DBSALT000139 (Accessed 24 October 2022)
Dural E, Bolay?r A, Çi?dem B. Determination of phenytoin in human plasma by a validated hplc method: application to therapeutic drug monitoring study. Acta Pham Sci, 2021; 59(1):683–704.
Food and Drug Administration. Bioanalytical method validation guidance. U.S. Department of Health and Human Services, Silver Spring, MD, 2018.
Gupta M, Tripp J. Phenytoin. In: StatPearls [ONLINE]. 2022. Available via https://www.ncbi.nlm.nih.gov/books/NBK551520/#_NBK551520_pubdet_ (Accessed 10 February 2022)
Harahap Y, Diptasaadya R, Purwanto D. Volumetric absorptive microsampling as a sampling alternative in clinical trials and therapeutic drug monitoring during the COVID-19 pandemic: a review. Drug Des Devel Ther, 2020; 14:5757–71.
Harahap Y, Rina, Wulan. Validation report of phenytoin levels in human plasma by high performance liquid chromatography (HPLC). Laboratory of Bioavailability and Bioequivalence, Faculty of Pharmacy, University of Indonesia, Depok, Indonesia, 2022.
Jagennath S, Raj G, Mathaiyan J. Factors influencing plasma concentrations of phenytoin, phenobarbitone, carbamazepine and sodium valproate in epileptic patients attending a tertiary care hospital. Int J Pharm Investig, 2019; 9(1):20–4.
Lee S. Old versus new: why do we need new antiepileptic drugs?. J Epilepsy Res, 2014; 4(2):39–44.
Shorvon S, Perucca E, Engel J. The treatment of epilepsy. 4th edition, John Wiley & Sons Inc., Chichester, UK, 2016.
Vaghela A, Patel A, Patel A, Vyas A, Patel N. Sample preparation in bioanalysis: a review. Int J Sci Technol Res, 2016; 5(5):6–10.
Villanelli F, Giocaliere E, Malvagia S, Rosati A, Forni G, Funghini S, Shokry E, Ombrone D, Luisa Della Bona M, Guerrini R, la Marca G. Dried blood spot assay for the quantification of phenytoin using liquid chromatography-mass spectrometry. Clin Chim Acta, 2015; 440:31–5.
WHO. Epilepsy fact sheets [ONLINE]. 2019. Available via https://www.who.int/en/news-room/fact-sheets/detail/epilepsy (Accessed 08 February 2022).