INTRODUCTION
Justicia gendarussa Burm f. is a quickly growing shrub with a pine scent. It is included in the Acanthaceae family (Subramanian et al., 2012). Justicia gendarussa is shaped like a single lanceolate, pinnate, opposite with dark green leans and short stems. The edges of the leaves are flat and tapered. Justicia gendarussa provides several benefits, including anticancer, antibacterial, hepatoprotective antifungal, antioxidant, anthelmintic, and antiangiogenic activity (Kavitha et al., 2014). This plant is used as part of traditional medicine in Indonesia. In the Papua region, it is used as a male contraceptive (Widiyanti et al., 2016). The J. gendarussa plant contains ingredients that can inhibit the function of hyaluronidase in the head of the chromosome during fertilization, so J. gendarussa is used as a male contraceptive (Utami et al., 2013).
The medicinal activity of plants is influenced by their phytochemicals. In general, plants have two types of molecular metabolites, namely, primary and secondary, and these metabolites play a role in pharmacologic activity against various diseases (Vijayakumar et al., 2019). According to Subramanian (2012), the ethanolic extract of the J. gendarussa stem contains glycosides, tannins, and phenolic components. The ethanolic extract of J. gendarussa leaves contains tannins, saponins, flavonoids, steroids, terpenoids, alkaloids, phenols, and glycosides (Nirmalaj and Perinbam, 2015).
Phenolic compounds are classified as primary antioxidants because they can inhibit the propagation stage with free radicals (Shahidi and Ambigaipalan, 2015). Antioxidants play a role in neutralizing free radicals, or reactive and unstable molecules in the body. Free radicals play an important role in physiological conditions and have an impact on various diseases (Phaniendra et al., 2015). They can cause cellular, tissue, and genetic damage. Tests of antioxidant activity can use DPPH methods. Interest in active compounds in plants is increasing, and many studies have been conducted on the subject. Secondary metabolites are divided into three groups based on chemical structure: terpenes, phenolic compounds, and nitrogen (Olivoto et al., 2017). Various secondary metabolites in plants include alkaloids, steroids, tannins, glycosides, essential oils, resins, phenols, and flavonoids. Secondary metabolites are found in various plant parts, such as their leaves, stems, roots, flowers, seeds, fruits, and bark. Appropriate extraction methods are needed to identify and obtain secondary metabolites in plants. This must take into account the factors that affect the extraction, including time, temperature, type of solvent, ratio of material and solvents, and particle size (Chairunnisa et al., 2019).
Response surface methodology (RSM) is a statistical and mathematical method used for optimal analysis under optimal conditions (Prabudi et al., 2018). RSM is used to model and analyze the effects of an independent variable (x factor) on a response to optimize this response (Octaviani et al., 2017). The advantages of RSM include reducing cost, time, and energy in research. In addition, RSM can reduce the number of experimental experiments, calculate complex interactions between independent variables, and analyze, optimize, and improve existing designs (Moradi et al., 2016).
MATERIALS AND METHODS
Plant sample preparation
Justicia gendarussa Burm f. leaves were obtained in January 2022 from the Tropical Biopharmaca Research Center, Institut Pertanian Bogor, Bogot, Indonesia. The leaves were washed thoroughly with water. Then, they were cut into small pieces and dried in an oven for two days and one night at 45°C. The leaves were ground using a desk mill with an 80-mesh sieve to obtain Simplicia.
Experimental design and extraction
The experimental design drew on the procedure used by Uysal et al. (2016), applying some modifications. Design Expert software (version 13.0, Stat-Ease Inc., Minneapolis, MN) was used to design three numerical factors at the three levels used. The design consists of 17 randomized runs with 5 repeats at the center point. To normalize the parameters, each value of the created variables ranges from –1 to +1 (Table 1). The Simplicia in each treatment weighed 2 g and was dissolved in 10 ml ethanol. The samples were homogenized using a sonicator for 30 minutes. They were macerated at different ethanol concentrations (10%, 50%, and 90%), at different temperatures (30°C, 45°C, and 60°C), and for different times (60, 120, and 180 minutes) using an oven. The sample was filtered using filter paper, and the resulting filtrate was a sample extract with a concentration of 0.2 g/ml.
 | Table 1. Symbol, variables, and code level of experimental extraction optimization of J. gendarussa leaf. [Click here to view] |
Total phenolic compound (TPC)
For the determination of the total phenolic level, we referred to Yanuarti et al. (2017) with modifications. A 20 μl sample solution (0.2 g/ml; 10 ml) was mixed with 120 μl 10% Folin–Ciocalteu reagent and incubated for 5 minutes. Then, a 10% solution of Na2CO3 was added to the microplate and incubated for 30 minutes at room temperature. The absorbance was capped at 750 nm; 250 ppm standard stock solution C7H6O5 was prepared by dissolving 0.025 g of C7H6O5 into a 100 ml measuring flask with an ethanol solvent. The standard solution stock was then diluted to concentrations of 50, 75, 100, 150, 200, and 225 ppm. Blanks were made with ethanol solvent in place of the sample in the reaction mixture. The TPC is expressed as milligrams of gallic acid equivalent [mg gallic acid equivalent (GAE)/g DW of sample].
Determination of antioxidant activity using the DPPH radical scavenging method
For testing the antioxidant activity of the DPPH, we drew on Haeria et al. (2018) with modifications. A 100 μl sample was added to 100 μl DPPH 125 μM solution (in ethanol). The mixture in the microplate was then incubated in a dark room for 30 minutes. The absorbance was measured using a nanospectrophotometer at a wavelength of 515 nm. Ethanol was used as a blank. A calibration curve was then created between % inhibition and the standard solution stock of Trolox, diluted to concentrations of 20, 50, 70, 80, 90, and 100 μM. Blanks are made with ethanol solvent instead of the sample in the reaction mixture. The results are expressed as the Trolox equivalents [μmol trolox equivalent (TE)/g DW of sample].
Statistical analysis
Significance was analyzed for each TPC response and antioxidant activity based on a one-way analysis of variance (ANOVA) using Duncan’s advanced test. The fitting model was carried out using ANOVA and determining the final solution of the optimum formula with the desirability value using the program Design Expert 13.0. These values were obtained in the range of 0, namely, the lowest level of confidence, to 1, complete confidence (Derringer and Suich, 1980). A second-order polynomial equation was used to predict the response of TPC and antioxidant activity, as follows:
where Y is the response of TPC or antioxidant activity (DPPH); X1 is the ethanol concentration (%); X2 is the extraction temperature (°C); X3 is the extraction time (minute); ei is the error term; β0 is the intercept; βi, βii, βij are the linear, quadratic, and interactive coefficients, respectively (Bas and Bayoci, 2007).
Model verification
The optimum formula (highest desirability) in relation to the determination of optimizing the extraction of J. gendarussa leaves was identified using method verification by conducting TPC testing and antioxidant activity. Next, it was analyzed by calculating the percent residual standard error (% RSE) using the following formula (Equation 2):
RESULTS AND DISCUSSION
RSM analysis
The RSM, in the Box–Behnken design, is used to determine the optimization point for the extraction conditions for TPC and antioxidant activity of J. gendarussa leaves. The average value of the total phenolic concentration and DPPH radical inhibitory activity is presented in Table 2. The two response variables showed a significant difference (p < 0.05) based on the test results using one-way ANOVA with Duncan’s further test.
Fitting the model
Model selection can be a qualification for optimizing the evaluated variables. Drawing on data processing obtained from Design Expert 13.0, the equation for TPC (Y1) and DPPH antioxidant activity (Y2) was obtained. The optimization of phenolic content and antioxidant activity was performed using independent variables, including ethanol, temperature, and extraction time. Optimization has an important role to play in the efficiency and probability of industrial processes (Uysal et al., 2016). The experimental design used in this study was the RSM, used to see the effect of more than one independent variable. According to Azahar et al. (2010), the need to maximize or minimize various independent variables to evaluate the influence of several factors and the interaction of one or more variables at the same time can be met by the RSM method.
The optimization of the TPC of J. gendarussa leaf extract using the RSM method is described using the quadratic model equation (Table 3), with a coefficient of determination (R2) obtained from the TPC quadratic equation of 0.9497, where values of the coefficient of determination of more than 0.80 or at more than 70% are preferable; this parameter describes the suitability of the regression model (Rasera et al., 2019). In addition, the adjusted R2 value of TPC was 0.8272. The quadratic TPC model was significant, p < 0.05. A nonsignificant lack of fit (0.8248 > 0.05) was expected, as this value indicates the adequacy of the installed model. For nonsignificant values or where the F statistic value is greater than the significance level, the installed model is considered to adequately explain the data in the experimental area. Conversely, if the F statistic of lack of fit is smaller than the significance level, then most of the residual errors are caused by the mismatch. The Adeq precision (AP) value of the TPC response model of 11.3541 is an adequate signal for the quadratic model. To confirm that the projected model could be used to navigate a design-defined space, AP values greater than 4 are preferred. The relationship between the TPC response for a certain level of each factor can be expressed through the following polynomial equation (Eq. 3):
YTPC = 13.91876 + 0.026808A–0.275228B–0.003916C + 0.000816AB–0.000160AC + 0.000598BC–0.001077A2 + 0.001655B2–0.000034C2, (3)
where Y is a response and A, B, and C are the coded variables for ethanol concentrations, extraction temperature, and extraction time, respectively.
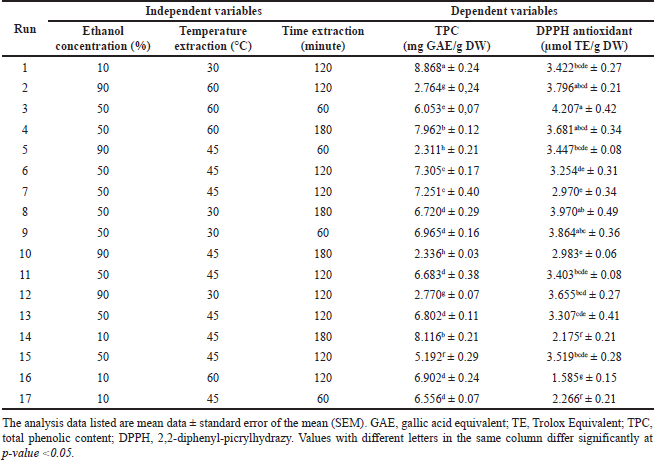 | Table 2. Box–Behnken experimental design with three independent variables and experimental data level of TPC and DPPH antioxidant activity. [Click here to view] |
For the installation of the model on the antioxidant activity of J. gendarussa leaf extract, which has a significant quadratic model (Table 4) (p < 0.05), the coefficient value R2 is 0.9244, with adjusted R2 being 0.8272, where the statistical results obtained by the ANOVA illustrate that the fitted model is reliable. The nonsignificant lack of fit value (0.1424 > 0.05) was also as expected. This model equation could maximize the yield of phenolic compounds with the antioxidant pharmacological activity of J. gendarussa leaf extract based on experiments from the RSM design used. In addition, the AP value was 10.4715; this value indicates an adequate signal for the model because it exceeds 4. Thus, the RSM model built to predict TPC and DPPH radical activity has a reasonable fit. The relationship of the DPPH activity responsible for a certain level of each factor can be expressed through the following polynomial equation (Eq. 4):
YDPPH = 8.19588 + 0.024860A–0.241141B–0.000281C + 0.000824AB–0.000039AC–0.000176BC–0.000434A2 + 0.002304B2 + 0.000034C2, (4)
where Y is a response and A, B, and C are the coded variables for ethanol concentrations, extraction temperature, and extraction time, respectively.
Optimization of procedure
Effect of ethanol concentration, temperature, and time extraction on TPC
As shown in Table 2, the TPC yield of J. gendarussa leaves ranged from 2,311 to 8,868 mg GAE/g DW. The design of the 17-factor combinations in the J. gendarussa leaf extract sample for TPC resulted in the optimization point presented shown in Figure 1. The highest TPC yield was obtained at 8,868 mg GAE/g DW; this result was found at the optimum condition at ethanol concentrations of 10% and 30°C (Fig. 1a), 10% ethanol concentration at 120 minutes extraction time (Fig. 1b), and 30°C at 120 minutes extraction time (Fig. 1c). These results indicate that the optimum conditions for extracting J. gendarussa leaves are 10% ethanol concentration, 30°C, and an extraction time of 120 minutes. Variations in ethanol concentration, temperature, and extraction time significantly affected the phenolic content of J. gendarussa leaf extract. The effects of each parameter used are illustrated in a three-dimensional visualization, shown in Figure 1 (panels a–c). Different colors in the visualization indicate different TPC values. Greater TPC values are shown in red, green, and yellow, with values from higher to lower. The code equation is a predictive code for the response results of each factor, which is useful for identifying the relative impact of each factor by comparing its coefficients. Increased TPC is shown with a positive sign and a decrease with a negative sign (Eq. 5). The equation code for TPC provides a relatively high effect for extraction time (C), ethanol concentration and temperature (AB), and temperature and extraction time (BC). In addition, the square of temperature (B2) shows a relatively high effect with a decrease in ethanol concentration (A), extraction time (C), and extraction time squared (C2). These terms can illustrate the way in which the interactive nature of each factor affects the increase in TPC.
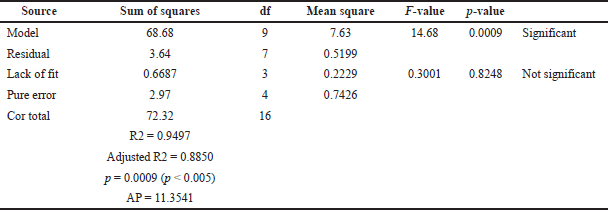 | Table 3. ANOVA for the TPC extraction of J. gendarussa fitted quadratic polynomial model. [Click here to view] |
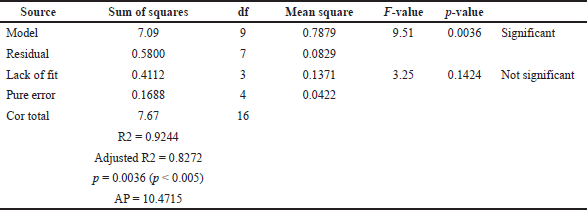 | Table 4. ANOVA for the DPPH antioxidant of J. gendarussa fitted quadratic polynomial model. [Click here to view] |
TPC = 6.68–2.53A–0.2052B + 0.4061C + 0.4898AB–0.3836AC + 0.5385BC–1.72A2 + 0.3723B2–0.1237C2. (5)
The solvent employed in extraction can affect the TPC (Ezez and Tefera, 2021). Overall, the TPC in the tested J. gendarussa leaf extract was strongly influenced by the ethanol solvent used (Fig. 1). This is due to the level of polarity, such that where ethanol has a high polarity but one that is not higher than water. Ethanol with a concentration of 10% is a very polar solvent, so it maximizes the content of polar compounds in the sample, as indicated by the high TPC content in these conditions. Polyphenol groups, such as phenolics, are often soluble in organic solvents that are less polar than water. However, their solubility depends on the polar nature of the polyphenol content itself, such that the selection of the type and concentration of the solvent for extraction is very important (Haminiuk et al., 2014). The compound 6,8-di-C-α-L-arabinopyranosylapigenin, referred to as Geadarusin A, is the main component of J. gendarussa and belongs to the polyphenol group. This compound is widely extracted using polar solvents (Ratih et al., 2019). The ideal extraction temperature is affected by the concentration of the solvent (Cacace and Mazza, 2003). In this study, the solvent concentration obtained at 10% was the lowest concentration available, with an extraction temperature of 30°C. Cacace and Mazza (2003), who studied blackcurrant extraction, found that its optimal results were shown at low temperatures and low ethanol concentrations. The temperature in the extraction process affects the solubility and stability of the components of phenolic compounds, and an optimum temperature produces the maximum TPC. In this case, the optimum temperature is 30°C. When the temperature exceeds the optimum limit, a decrease is seen in TPC levels (Ju and Howard, 2003). According to Lien et al. (2007), the acquisition of TPC from soybeans showed an extraction time of 120–240 minutes. The optimum extraction time for J. gendarussa leaf extract was 120 minutes.
Antioxidant activity using the DPPH method
Justicia gendarussa leaf extract showed optimum antioxidant activity using the RSM, namely, 4.20794 μmol TE/g DW; this result was indicated by the extraction conditions at 50% ethanol concentration at 60°C (Fig. 2a), 50% ethanol concentration at extraction time of 60 minutes (Fig. 2b), and at 60°C, with an extraction time of 60 minutes (Fig. 2c). This condition means, in determining antioxidant activity using the DPPH method on J. gendarussa leaves, optimum conditions were obtained at 60°C, 50% ethanol concentration, and 60 minutes of extraction time. The resulting code equation is presented in Equation 2. This presents a predictive code for the response results of each factor, which is useful for identifying the relative impact of the factors by comparing their coefficients. Based on Equation 6, DPPH can increase relative to the ethanol concentration (A), ethanol concentration and temperature (AB), and the square of temperature (B2). In contrast, there was a decrease in temperature (B), extraction time (C), ethanol concentration and extraction time (AC), temperature and concentration time (BC), the square of the ethanol concentration (A2), and the square of the extraction time (C2). These terms illustrate how the interactive nature of each factor increases the antioxidant activity of DPPH.
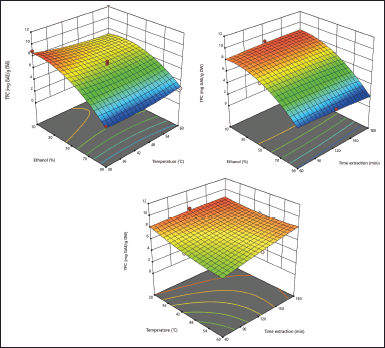 | Figure 1. Response surface plots showing the interaction effect of ethanol concentration (%) with temperature (°C) (a), ethanol concentration (%) with extraction time (minute) (b), and temperature (°C) with extraction time (minute) (c) on the response of TPC (mg GAE/g DW). [Click here to view] |
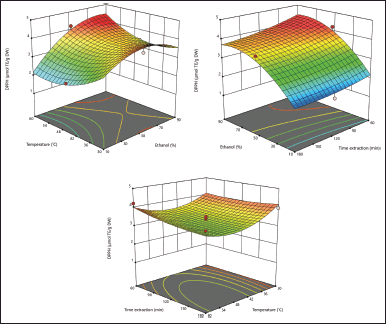 | Figure 2. Response surface plots showing the interaction effect of ethanol concentration (%) with temperature (°C) (a), ethanol concentration (%) with extraction time (minute) (b), and temperature (°C) with extraction time (minute) (c) on the response of 2,2-diphenyl-picrylhydrazyl radical scavenging antioxidant activity (μmol TE/g DW). [Click here to view] |
 | Table 5. Verification of predicted and experimental values using conditions optimized for maximum TPC and DPPH antioxidant activity. [Click here to view] |
DPPH = 3.29 + 0.5543A–0.2054B–0.1220C + 0.4943AB–0.0935AC–0.1582BC–0.6945A2 + 0.5184B2–0.1216C2. (6)
The DPPH method used in testing the antioxidant activity showed significantly different results (p < 0.05) across test treatments. These were influenced by solvent, temperature, and extraction time. Antioxidant compounds are usually derived from polyphenol group compounds. The solubility of polyphenolic compounds is mostly polar, and it is often preferred in organic solvents compared to those using only water. Hence, the choice of extraction solvent is very important. Kuber (2021) also used ethanol to extract J. gendarussa with the highest DPPH antioxidant activity. The solubility, structure, and polarity of antioxidant compounds are closely related to the antioxidant activity of these compounds. It is well known that plant extracts that have polyphenolic components have antioxidant properties due to their ability to absorb free radicals and act as hydrogen atoms or electron donors. The strength of the reaction depends on its ability to donate hydrogen from antioxidants (Bondet et al., 1997).
Optimization procedure and verification
The TPC response and DPPH antioxidant activity showed an optimum point, with a desirability value of 0.918, as presented in Table 5. This desirability value is a parameter that is used to see the level of confidence in determining the optimization point based on the RSM from the Design Expert 13.0 program. The results obtained show that the resulting confidence level is 91.8%; therefore, we can determine the validity level of the procedure used. To maximize the acquisition of TPC with the antioxidant activity from J. gendarussa leaves, the extraction process can use a formulation that has an ethanol concentration of 30%, an extraction temperature of 30°C, and an extraction time of 180 minutes. Under the conditions of the formula, the levels of TPC and DPPH antioxidant activity were 8.29 mg GAE/g DW and 4.010 μmol TE/g DW, respectively. The verification of the formula of the method carried out is presented in Table 5, and it is analyzed on the basis of the RSE, namely, the standard deviation of the residuals. This value is used as an evaluation parameter for the level of accuracy of the model produced by comparing the predicted value and the actual value (verification) so that smaller values indicate better prediction. The %RSE TPC result was 4.465%, and the antioxidant activity of DPPH 7.082% showed a very good predictive value, meaning that the selected model was very good in determining the optimization of J. gendarussa leaf extraction.
CONCLUSION
This is the first study to optimize J. gendarussa leaves using RSM with the three variable factors of ethanol concentration, temperature, and extraction time. The design of the RSM method effectively optimized the acquisition of TPC and DPPH antioxidant activity with a desirability value of 0.918, namely, by using the formula of 30% ethanol concentration, extraction temperature of 30°C, and extraction time of 180 minutes, through which the maximum TPC content and DPPH antioxidant activity were obtained, namely, 8.29 mg GAE/g DW and 4.010 μmol TE/g DW. A comparison between the predicted value and method verification produced a very valid response of the % RSE value of 4.465% (TPC) and 7.08 2% (DPPH antioxidant activity). We conclude that the RSM is a suitable approach for increasing the production of TPC and antioxidants from J. gendarussa for medical and other applications.
ACKNOWLEDGEMENTS
The authors greatly acknowledge the financial assistance provided by the Ministry of Education, Culture, Research, and Technology of Indonesia (15892/IT3.D10/PT.01.02/P/T/2023).
AUTHOR CONTRIBUTIONS
All authors made substantial contributions to the conception and design, acquisition of data, or analysis and interpretation of data; took part in drafting the article or revising it critically for important intellectual content; agreed to submit to the current journal; gave final approval of the version to be published; and agree to be accountable for all aspects of the work. All the authors are eligible to be an author as per the international committee of medical journal editors (ICMJE) requirements/guidelines.
CONFLICTS OF INTEREST
The authors report no financial or any other conflicts of interest in this work.
ETHICAL APPROVALS
This study does not involve experiments on animals or human subjects.
DATA AVAILABILITY
All data generated and analyzed are included in this research article.
PUBLISHER’S NOTE
This journal remains neutral with regard to jurisdictional claims in published institutional affiliation.
REFERENCES
Azahar NF, Siti SAG, Uswatun HZ, Paiman B, Mohd Izuan EH. Optimization of the antioxidant activities of mixtures of Melastomataceae leaves species (M. malabathricum Linn Smith, M. decemfidum, and M. hirta) using a Simplex Centroid Design and their anti-collagenase and elastase properties. Appl Sci, 2020; 10:7002.
Bas D, Boayci IH. Modeling and optimization I: Usability of response surface methodology. J food eng, 2007; 78(3):836–45.
Bondet V, Brand-Williams W, Berset C. Kinetics and mechanisms of antioxidant activity using the DPPH free radical method. LWT-Food Sci Technol, 1997; 30(6):609–15.
Cacace JE, Mazza G. Optimization of extraction of anthocyanins from black currants with aqueous ethanol. J. Food Sci, 2003; 68:240–8.
Chairunnisa S, Wartini NM, Suhendra L. Pengaruh suhu dan waktu maserasi terhadap karakteristik ekstrak daun bidara (Ziziphus mauritiana L.) sebagai sumber saponin. J Rekayasa Manaj Agroindustri, 2019; 7(4):551–60.
Derringer G, Suich R. Simultaneous optimization of several response variables. J Qual Technol, 1980; 12:214–9.
Ezez D, Terefa M. Effects of solvents on total phenolic content and antioxidant activity of ginger extracts. J Chem, 2021; 1–5.
Haeria H, Tahar N, Munadiah M. Penentuan kadar flavonoid dan kapasitas antioksidan ekstrak etanol kulit batng kelor (Moringa oleifera L.) dengan metode DPPH, Cuprac, dan FRAP. J Farm, 2018; 6(2):88–97.
Haminiuk CWI, Oviedo MSVP, Mattos GD, Carpes ST, Branco IG. Extraction and quantification of phenolic acids and flavonols from Eugenia pyriformis using different solvents. J Food Sci Technol, 2014; 51(10):2862–6.
Ju ZY, Howard LR. Effects of solvent and temperature on pressurized liquid extraction of anthocyanins and total phenolics from dried red grape skin. J Agric Food Chem, 2003; 51(18):207–13.
Kavitha K, Sridevisangeetha KS, Sujatha K, Umamaheswari S. Phytochemical, and pharmacological profile of Justicia gendarussa Burm f.- review. J Pharm Res, 2014; 8(7):990–7.
Kuber BR. In vitro antioxidant potential, total phenolic and flavonoid contents in Justicia gendarussa leaf extracts. RJPT, 2021; 14:2707.
Lien DTP, Pram PTB, Toan Ha T. Effects of extraction process on phenolic content and antioxidant activity of soybean. Food Nutr Sci, 2015; 13–38.
Moradi M, Fazlzadehdavil M, Pirsaheb M, Mansouri Y, Khosvasri T, Sharafi K. Response surface methodology (RSM) and its application for optimization of ammonium ions removal from aqueous solutions by pumice as a natural and low-cost adsorbent. Arch Environ Prot, 2016; 42(2):33–43.
Nirmalaj S, Perindam K. Studies on phytochemical screening, and in vitro antioxidant activity of ethyl acetate leaf extract of Justicia gendarussa Burm. f. Res J Bot, 2015; 10(1):30–6.
Octaviani MA, Dewi DRS, Asrini LJ. Optimasi faktor yang berpengaruh pada kualitas lilin di UD.X dengan metode response surface. J Ilmiah Widya Tek, 2017; 16(1):29–38.
Phaniendra A, Jestadi DB, Periyasamy L. Free radicals: properties, sources, targets, and their implication in various diseases. Indian J Clin Biochem, 2015; 30(1):11–26.
Olivoto T, Nardino M, Carvalho IR, Follman DN, Szareski VJ, Ferrari M, Pelegrin AJD, Souza VQD. Plant secondary metabolites and it’s dynamical systems of induction in response to environmental factors: a review. Afr J Agric Res, 2017; 12(2):71–84.
Prabudi M, Nurtama B, Purnomo EH. Aplikasi response surface methodology (RSM) dengan historical data pada optimasi proses produksi burger. Mutu Pangan, 2018; 5(2):109–15.
Rasera GB, Hilkner MH, de Alencar SM, de Castro RJS. Biologically active compounds from white and black mustard grains: an optimization study for recovery and identification of phenolic antioxidants. Ind Crops Prod, 2019; 135:294–300.
Ratih GAM, Imawati MF, Nugroho RR, Purwanti DI, Wongso S, Prajogo B, Indrayanto G. Phytochemicals of gandarusa (Justicia J. gendarussa and its preparations. Nat Prod Commun. 2019; 10.
Shahidi F, Ambigaipalan P. Phenolics and polyphenolics in foods, beverages, and spices: antioxidant activity and health effects–a review. J Funct Foods, 2015; 18:820–9.
Subramanian N, Jothimanivannan C, Moorthy K. Antimicrobial activity and preliminary phytochemical screening of Justicia gendarussa (Burm f.) against human pathogens. Asian J Pharm Clin Res, 2012; 5(3):229–33.
Utami SL, Restanto DP, Prajogo BEW. Air gandarusa (Justicia gendarussa Burm. F.) dan gambaran gen hyaluronidase lewat analisis PCR. Indones J Clinical Pathol Med Lab, 2013; 19(2):69–75.
Vijayakumar AS, Jeyaraj M, Selvakumar M, Abirami E. Pharmacological activity of silver nanoparticles, ethanolic extract from Justicia gendarussa (Burm) F plant leaves. RJLBPCS, 2019; 5(2):463–75.
Uysal S, Cvetanovic A, Zengin G, Durovic S, Aktumsek A. Optimization of the extraction process of antioxidants from loquat leaves using response surface methodology. J Food Process Preserv, 2016; 41(5):1–8.
Widiyanti P, Prajogo B, Hikmawati NPE. Cytotoxicity of Justicia gendarussa Burm f. leaf extracts on molt-4 cell. IJTD, 2016; 6(1):24–8.
Yanuarti R, Nurjannah, Anwar E, Hidayat T. Profil fenolik dan aktivitas antioksidan dari ekstrak rumput laut Turbinaria cooides dan Eucheuma cottoni. JPHP, 2017; 20(2):230–7.