INTRODUCTION
Azilsartan medoxomil (AZL) is a new angiotensin-II receptor blocker (ARB) suggested to treat high blood pressure. AZL is a prodrug that is broken down into azilsartan (Drug bank). It is recognized chemically as 2-ethoxy-3-[[4-[2-(5-oxo-4H-1,2,4-oxadiazol 3yl) phenyl] phenyl]methyl] carboxy-4-benzimidazole acid (Pub chem) (Fig. 1A). AZL has been suggested to be more effective compared to other ARBs due to its greater reduction in blood pressure (WHO, 2021).
Cilnidipine (CIL) is a dihydropyridine calcium channel blocker used to treat high blood pressure that works on both N and L-type calcium channels (Rathod et al., 2018). Its official name in chemical terms is 1,4-dihydro-2,6-dimethyl-4-(3-nitrophenyl)-3,5-pyridine carboxylic acid. 3-phenylpropenyl esters of 2E and 2M. Figure 1B illustrates the structure of CIL (Pub chem). It works by inhibiting long-acting Ca+2 channels, which prevent calcium ions from entering tiny blood capillaries. Inhibition of the cascade that causes vasoconstriction ultimately results in vasodilation when the Ca+2 entrance is blocked. It lowers blood pressure by lowering peripheral resistance (Drug bank).
Pharmaceutical quality by design (QbD) is a scientific approach to drug development that promotes comprehension and control of products and processes based on quality science and quality risk management and begins with predetermined goals (Juran, 1992). In the pharmaceutical QbD technique of analytical method development, the applicant identifies characteristics that are crucial to quality from a design point of view and develops them into critical quality attributes (CQAs) of the analytical method and establishes the relationship between the variables and the CQAs (U. S. Food and Drug Administration, 2009; Yu et al., 2014).
Only a few approaches are described in the literature for the estimation of AZL and CIL (Andhalea and Nikalje, 2022; Jani and Patel, 2018a, 2018b; Jena et al., 2021; Solanki et al., 2022). However, several high-performance liquid chromatography (HPLC) and liquid chromatography-mass spectroscopy techniques for estimating AZL and CIL alone or combined with other drugs are reported (Desai and Nikalje, 2021; Deshmukh et al., 2020; Ghante et al., 2019; Kumar and Begum, 2019; Rathod et al., 2018; Ruhina and Mamatha, 2017; Soliman et al., 2019; Surwade and Saudagar, 2015; Vyas et al., 2019). Only the high-performance thin layer chromatography (HPTLC) method was reported for AZL by the QbD approach (Prajapati et al., 2022). There were no reports on the simultaneous estimation of AZL and CIL combined formulation. Therefore, there is a significant need to provide a selective, genuine, and reliable reverse phase-ultra performance liquid chromatography (RP-UPLC) approach for the measurement of AZL and CIL based on the current analytical QbD concept.
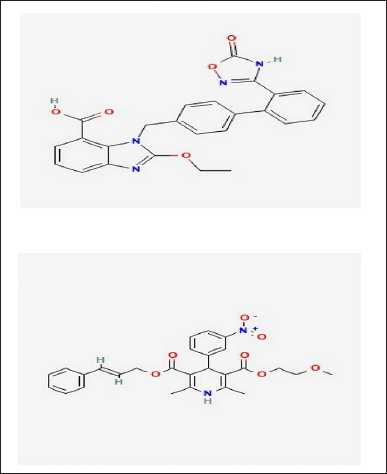 | Figure 1. Structure of AZL and CIL. [Click here to view] |
EXPERIMENTAL STUDIES
Materials and instrumentation
The UPLC system; Agilent 1290 Infinity II LC System (Agilent Infinity lab suppliers) with photodiode array (PDA) detector was used for analysis. Empower 2.0 version software was used. Design expert version 12.0 is used for optimization. AZL and CIL powder (purity 99.54% and 99.89% respectively) were procured from Glenmark, Mumbai, India. All chemicals were of HPLC grade (Merk India Ltd, Mumbai, India) and HPLC water acquired from Milli Q. Tablet Myotan CN labeled to contain 40 mg of AZL and 10 mg of Cilnidipine from Synokem Pharmaceuticals LTD. Waters X-Bridge C18 column (50 × 4.6 mm), (2.5 μm), was used for the chromatographic separation.
Methods
About 1% triethylamine (TEA) adjusted to a pH of 2.5 with ortho phosphoric acid (OPA): acetonitrile (50:50 v/v) was used as a mobile phase, given at a flow rate of 0.5 ml/minute, and detected by a PDA detector at 273 nm. By taking into account the UV spectra of AZL and the UV spectra of CIL, the wavelength was selected at 273 nm. Figure 4 has the UV spectrum overlaid.
Standard solution preparation
Separately, standard stock solutions of AZL and CIL were made, and 5 mg of AZL and CIL were weighed accurately and transferred into a 10 ml volumetric flask (VF) each at a 500 mg/ml concentration. To create AZL and CIL in the concentrations of 40 and 10 μg/ml, respectively, 0.8 and 0.2 ml of each stock solution were placed into a 10 ml VF and adjusted using acetonitrile as the diluent.
Test sample preparation
About 19 mg of the sample was accurately weighed and transferred into a 10 ml clean, dry VF. Diluent was then added, and the sample was sonicated for up to 30 minutes and centrifuged for 30 minutes to solubilize it and make the volume up to the required amount with the same solvent. Then, a 0.45-μ injection filter is used to filter the material. Pipetted 1 ml of the sample solution into a 10 ml VF with diluent until the desired concentration was reached (40 μg/ml AZL and 10 μg/ml Cilnidipine).
Method development and experimental design
To achieve chromatographic separation, a new RP-UPLC procedure was created that uses a mobile phase with a 50:50 mixture of acetonitrile and TEA buffer at pH 2.5. Using central composite design (CCD), study design and statistical analysis of data were carried out with Design-Expert® software (version 12.0.10). Organic solvent percentage in the solvent system (A, percent v/v), and pH were as chosen as the independent factors (B). Covariates or controlled variables included plate count (PC) of peak 1 (R1), resolution (R2), and tailing of peak 2 (R3). Thirteen sets of experiments were built using a two-factor, three-level CCD. Table 1 displays independent and dependent factors together with multiple levels. Analysis of variance (ANOVA) technique evaluation and the goodness of fit test were used to assess statistical measures and estimate the design’s significance. Using the response surface method, optimization of the method’s variables was carried out.
Forced degradation
The stability of the medicine and drug product is revealed by the stress degradation study. It provides details on the stability of compounds under conditions of acidity, base, heat, pH, hydrolysis, and redox (Khan et al., 2018; Sonawane et al., 2016).
Sample stock preparation
Take 19 mg of AZL and CIL sample transferred into a 10 ml VF add 7 ml of diluent sonicated to dissolve and make up to the mark with diluent.
Acid degradation
Add 0.8 ml of sample stock solution into a 10 ml VF, add 1 ml of 1 N HCl heat for 30 minutes at 60°C, then cool and add 1 ml of 1 N NaOH to neutralize the solution and dilute to volume with diluent and mix. This solution is injected every 6 hours up to 24 hours.
Alkali degradation
Add 0.8 ml of sample stock solution into a 10 ml VF, add 1 ml of 1 N NaOH heat for 30 minutes at 60°C, then cool and add 1 ml of 1 N HCl to neutralize the solution and diluted to volume with diluent and mix. This solution is injected every 6 hours up to 24 hours.
Peroxide degradation
Add 0.8 ml of sample stock solution into a 10 ml VF, add 1 ml of 30% hydrogen peroxide solution, and heat the solution at 60°C for 30 minutes. After that, cool and dilute to volume with diluent and mix.
Reduction degradation
Add 0.8 ml of sample stock solution into a 10 ml VF, add 1 ml of 30% sodium bi-sulfate solution, and heat the solution at 60°C for 30 minutes. After that, cool and dilute to volume with diluent and mixed. This solution is injected every 6 hours up to 24 hours.
Hydrolysis degradation
Add 0.8 ml of sample stock solution into a 50 ml VF, add 3 ml of HPLC water, and heat on water bath at 60°C for 30 minutes. After that, dilute to volume with diluent and mix.
This solution is injected every 6 hours up to 24 hours.
Thermal degradation (105°C/72 hours)
Expose 100 mg of the sample to a hot air oven at 105°C for 72 hours. After that, take 19 mg of this sample and transfer it into a 10 ml VF and add 7 ml of diluent sonicate to dissolve and make up.
Further, add 0.8 ml of the above solution into 10 ml VF and dilute the volume with diluent. This solution is injected every 6 hours up to 24 hours.
Photolytic degradation
Expose 100 mg of sample was to a photostability chamber to expose samples of 1.2 million l × hour and 200 W hour/m2 light. After that, take 19 mg of this sample and transfer it into a 10 ml VF and add 7 ml of diluent sonicate to dissolve and make up. Further, add 0.8 ml of the above solution into 10 ml VF and dilute the volume with diluent. This solution is injected every 6 hours up to 24 hours.
RESULTS AND DISCUSSION
Construction techniques by CCD
To determine the impact of different chromatographic conditions on the R1, R2, and R3, three main critical analytical attributes (CAAs) were created. There are a variety of 13 tests performed in the design. The investigation is carried out to support the design of statistical information utilizing the response surface methodology (RSM) with a systematic study of crucial components by evaluating their significant influence on acquiring critical method parameters (Desai and Nikalje, 2021; Jena et al., 2021). Table 1 provides a summary of the design specifications for all identified CAAs and the corresponding replies. The independent variables, namely the mobile phase composition and rate of flow, are also described in depth in Table 2, together with the design factors and the results that were recorded.
Parameters for optimal chromatography
Column: Waters X-Bridge C18, 50 × 4.6 mm, 2.5 μm.
Detector: PDA at 273 nm
Injection volume: 10 μl
Flow rate: 0.5 ml/minute
Run time: 5 minutes
Mobile Phase: 1% TEA buffer at pH 2.5 with OPA and acetonitrile (50:50).
Retention Time: 1.354 and 2.443 minutes respectively (Fig. 2).
Utilizing RSM to improve the chromatographic procedure
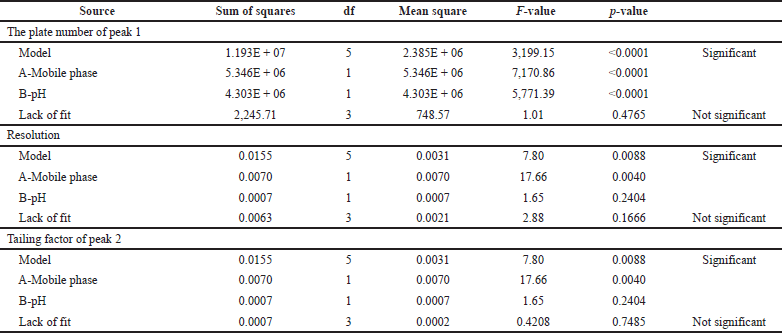
The two most important variables for optimization were decided to be the organic phase’s composition (A) and the mobile phase’s pH (B). Thirteen different experimental tests were all sent through the Design Expert (Tables 1 and 2). Every experiment was conducted at random to reduce the impact of uncontrolled variables that can bring bias into the response (Andhalea and Nikalje, 2022). When comparing the various models, the design expert software chose the quadratic model since it had the largest least squares regression coefficients for each of the three responses (R1, R2, and R3). When the model was put through a lack of fit test, the results revealed a non-significant lack of fit value, which corresponds to a larger p-value than the model’s F-value. The normal residual plot further demonstrated that there were no detectable outliers in the data and that all data were concentrated along the model fit line (Fig. 3A–C). ANOVA, which was used to validate the model, demonstrated its significance and further showed that it was valid. Following is the quadratic equation for all model responses, R1, R2, and R3:
R1 = 552.02157 − 3,927.40242 − 2.42228 + 1,404.30333
R2 = 0.292197 + 2.93964 − 0.015974 − 0.386869
R3 = −0.017841 + 0.420607 − 0.004500 + 0.000261 − 0.035500
 | Table 1. Experimental design matrix for factors and their obtained responses by 22 CCD. [Click here to view] |
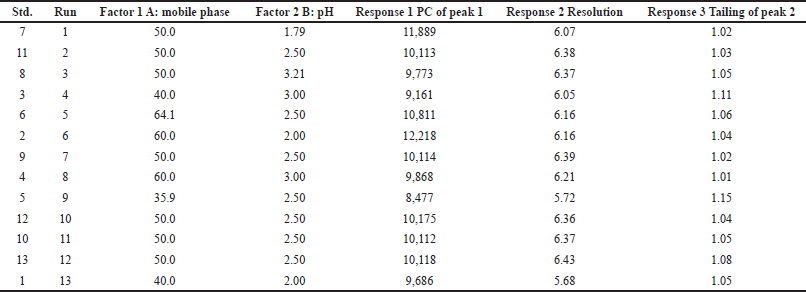 | Table 2. Experimental runs of selecting (22) factors by CCD. [Click here to view] |
Results from an ANOVA for responses R1, R2, and R3 showed that the models were significant because their respective model F-values of 3,199.15, 110.70, and 7.80 were more than zero. The variables A and B are both significant in every case, according to the p-values (p ? 0.05) for the model terms (Table 3). According to Table 4, the anticipated R-squares for all solutions R1 (0.9983), R2 (0.9331), and R3 (0.5595) are reasonable by the adjusted R-squared values of 0.9993, 0.9786, and 0.7391, respectively, which are all lower than 0.2 in each case. Accurate measurements of the signal-to-noise ratio were made. A sufficient signal (ratio >4.0) is indicated by a ratio of 202.4996, 28.2172, and 9.1991. The design space can be explored using these models. The quantitative analysis of AZL and CIL was unaffected by changes in the experimental settings, which demonstrated the analytical method’s robustness. The statistical results for PC peak 1, resolution, and peak 2’s tailing also supported this conclusion. All results fell within the acceptable level, and the experimental results of the proposed method are comparable to the suggested replies (NMT 2.0%). The optimized method is according to the design of the experiment shown in Table 5. These conditions are used for further validation studies.
Method validation
The chromatographic separation was evaluated for linearity, range, accuracy, precision, robustness, specificity, and system appropriateness by (Q2 R1) ICH criteria (ICH, 2005).
Suitability of the system
For the system appropriateness analysis, it was examined how theoretical plates, peak areas, and tailing factors would behave. Results from the six replicates of injections of AZL and CIL at 40 and 10 g/ml were displayed in Table 6. All of the outcomes fall within the acceptable range.
Linearity and range
The six different serial concentrations (10, 20, 30, 40, 50, and 60 μg/ml) were prepared for the standard calibration curve using acetonitrile. With each concentration, three replicate injections were used to test the linearity. The regression formula was Y = 2,425,977.50x + 20,890.89 and Y = 4,543,356.29x + 9,887.82 respectively and the regression coefficient R2 = 0.99986 and R2 = 0.99936 (Fig. 5).
Precision
Repeatability was studied (system precision, method precision, and intermediate precision) within six replicate sets. The %RSD is within the limit. Results are shown in Table 7.
Accuracy
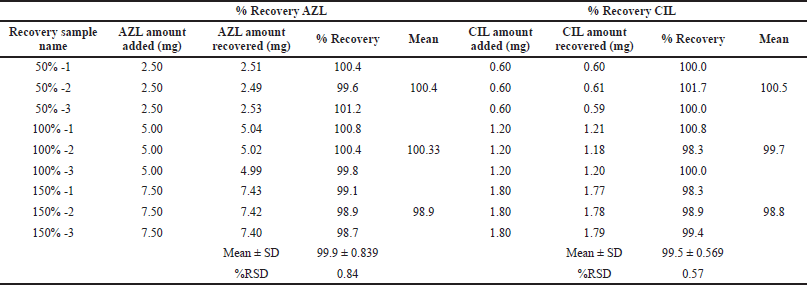
By incorporating a known quantity of the drug into the tablet formulation at three different concentrations—50%, 100%, and 150% with each concentration, three replicate injections were used to conduct the recovery study. At each level, the average percent recovery and percent RSD values were discovered to be within acceptable limits, proving the method’s accuracy. Results are shown in Table 8.
Robustness
It measures how well it can withstand slight changes and shows that it was stable in routine use. For anticipated changes in technique, parameters like the organic phase ratio (45–55), pH (2.4–2.6), and flow rate (0.8–1.2 ml/minute) are listed in Table 9. This demonstrated that the analyzed independent variables did not influence the outcomes.
Limit of detection (LOD) and limit of quantification (LOQ)
The LOD and LOQ for AZL and CIL were determined using the slope technique and were observed to be 1.2 and 4 μg/ml and 0.3 and 1 μg/ml correspondingly.
Specificity
The specificity of the method was assessed to find out any interference in the chromatographic separation of the AZL and CIL with a blank sample and placebo. There is no interference was observed. It is shown in Figure 2.
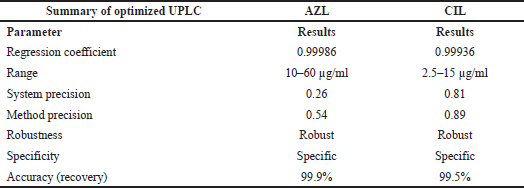
Table 10 shows the summary of all validated parameters. The approach has been validated successfully under optimum conditions, and the validation parameters are also within acceptable bounds.
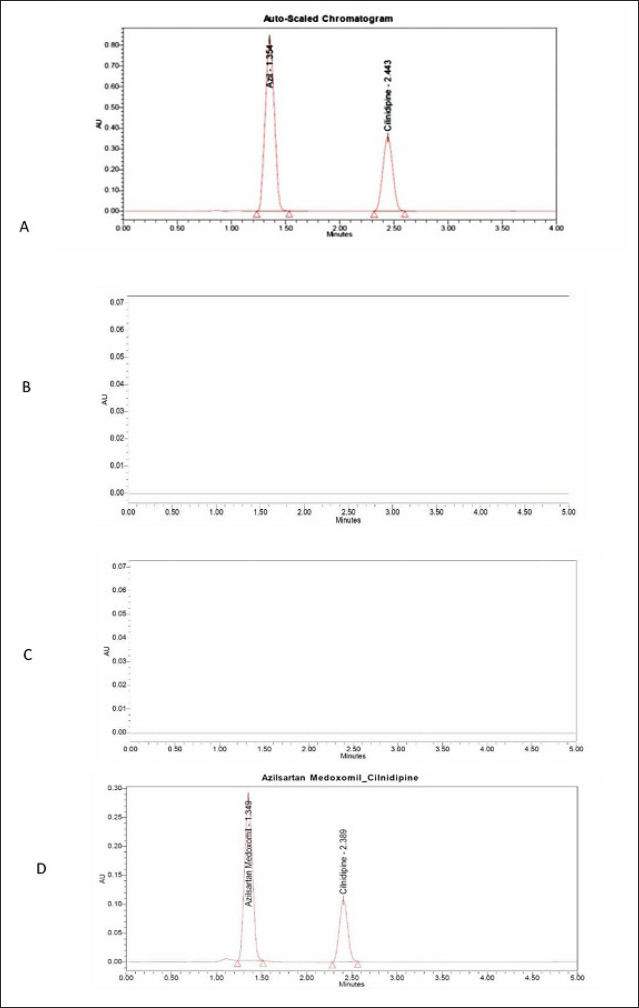 | Figure 2. (A) Standard chromatogram of AZL and CIL, (B) blank chromatogram, (C) placebo, and (D) sample chromatogram. [Click here to view] |
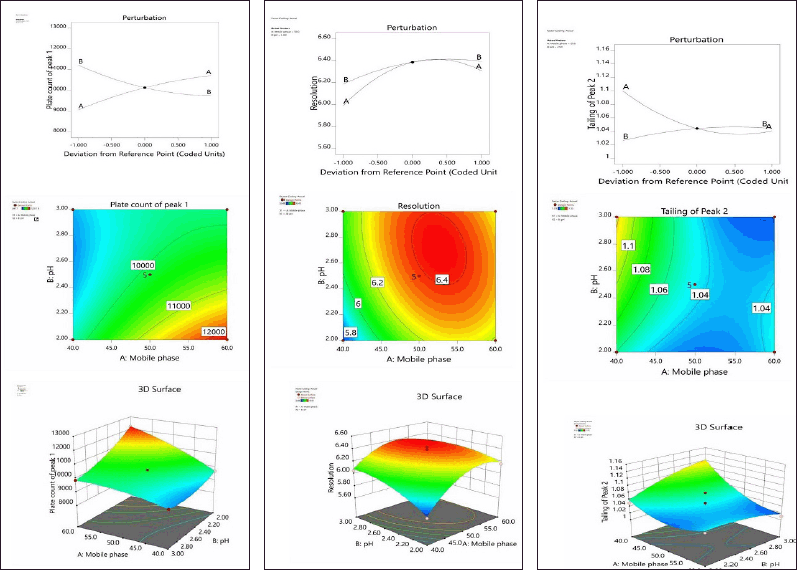 | Figure 3. A) Perturbation, counter plot, and 3D response surfaces effect on R1. (B) Perturbation, counter plot, and 3D response surfaces effect on R2. (D) Perturbation, counter plot, and 3D response surfaces effect on R3. [Click here to view] |
 | Table 3. ANOVA results for PC of peak 1 (R1). [Click here to view] |
 | Table 4. Summary statistics for responses R1, R2, and R3. [Click here to view] |
 | Table 5. The optimized method is according to the design of the experiment. [Click here to view] |
 | Table 6. System suitability. [Click here to view] |
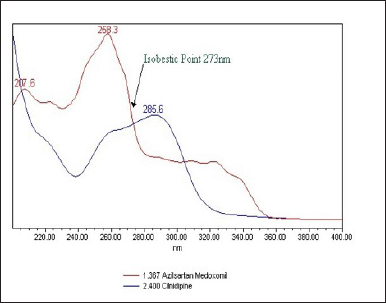 | Figure 4. UV spectra of AZL (40 μg/ml) and CIL (10 μg/ml). [Click here to view] |
AZL and CIL tablet assay
AZL % assay was determined to be 99.9% and CIL % assay to be 99.5% when taken as tablets. It states that there was no interference and a high percentage of recovery in the excipients of the formulation during the drug’s retention time, demonstrating the technique’s suitability for the detection of AZL and CIL in the tablet dosage form.
Forced degradation
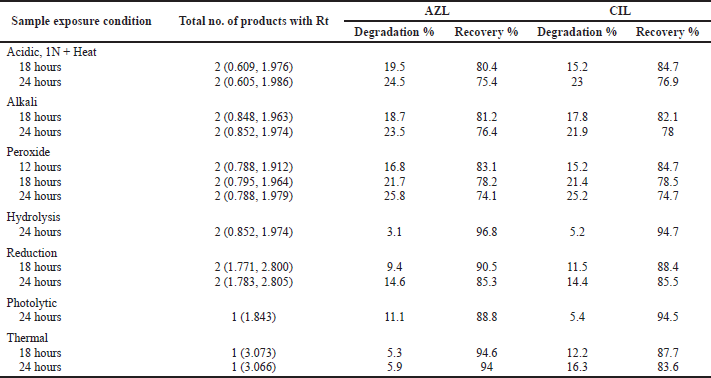
Degradation studies revealed that AZL and CIL degradative peaks were not observed except for peroxide degradation (up to 12 hours), after 18 hours different percentages of degradative peaks were observed under specified conditions (Fig. 6A–M and Table 11). Among all the stress studies, major degradation occurred in peroxide (25.8% and 25.2% for AZL and CIL respectively at 24 hours), and minimum in hydrolysis degradation (3.1% and 5.2% for AZL and CIL respectively at 24 hours). AZL and CIL were exposed to degradation conditions degradation peaks were observed, Hence the formulation does not expose to critical conditions.
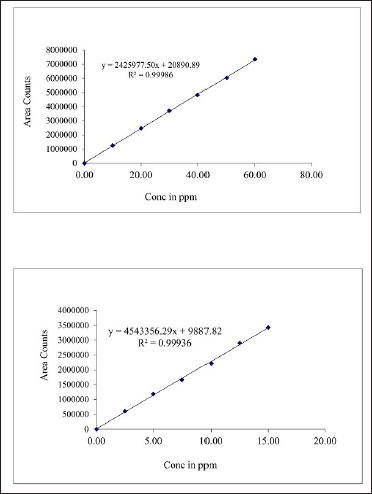 | Figure 5. Linearity of AZL and CIL. [Click here to view] |
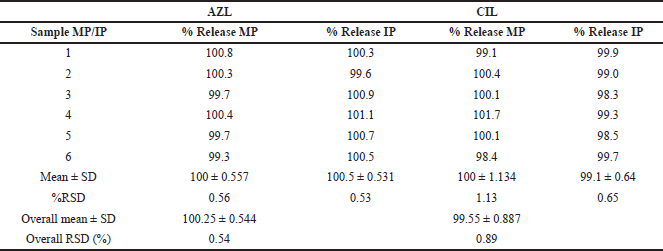 | Table 7. Result of system precision method precision, intermediate precision, and ruggedness. [Click here to view] |
 | Table 8. Result of accuracy (recovery). [Click here to view] |
 | Table 9. Result of robustness of AZL and CIL. [Click here to view] |
 | Table 10. Summary of validation. [Click here to view] |
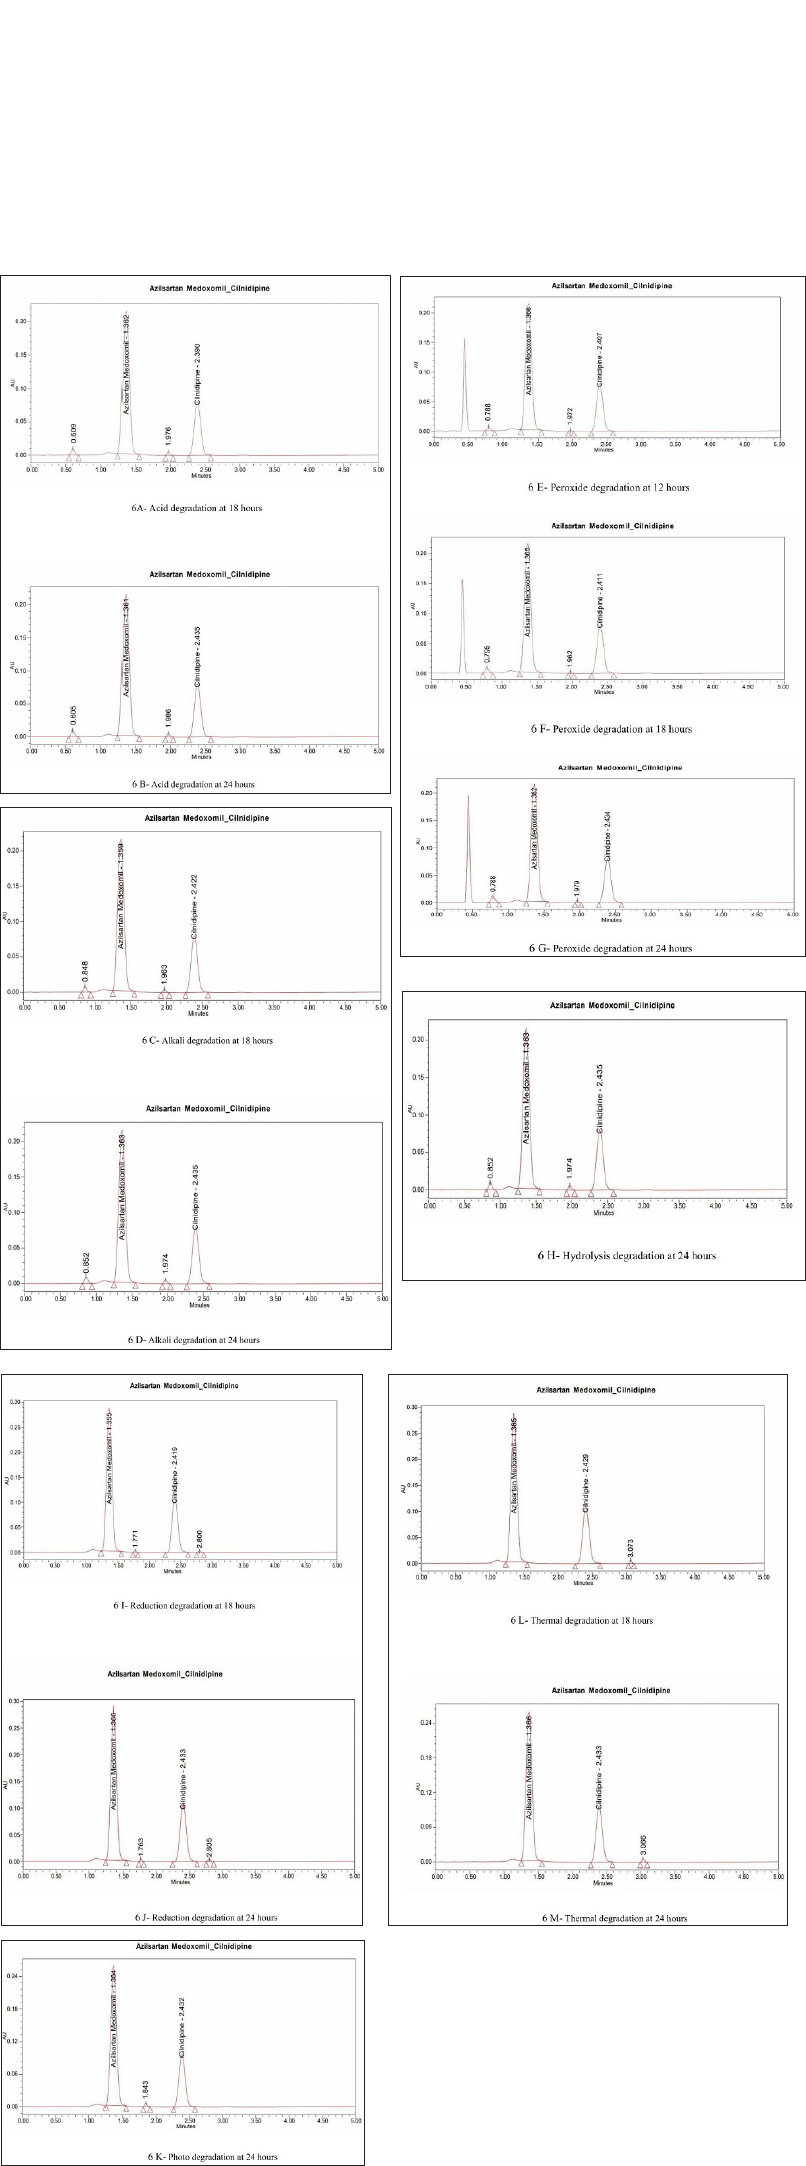 | Figure 6. (A) Acid degradation at 18 hours. (B) Acid degradation at 24 hours. (C) Alkali degradation at 18 hours. (D) Alkali degradation at 24 hours. (E) Peroxide degradation at 12 hours. (F) Peroxide degradation at 18 hours. (G) Peroxide degradation at 24 hours. (H) Hydrolysis degradation at 24 hours. (I) Reduction degradation at 18 hours. (J) Reduction degradation at 24 hours. (K) Photo degradation at 24 hours. (L) Thermal degradation at 18 hours. (M) Thermal degradation at 24 hours. [Click here to view] |
A QbD-based UPLC approach for AZL and CIL has not yet been developed. Some HPLC and UV spectrometric techniques have been published. However, there are other methods for estimating AZL and CIL utilizing different chromatography methods, such as HPTLC with QbD (Prajapati et al., 2022), HPLC (Andhalea and Nikalje, 2022; Solanki et al., 2022), and UV Spectroscopic methods (Jani and Patel, 2018a, 2018b), the present chemometrics-assisted chromatographic approach ensures reliable, accurate, and effective methodology while saving time and reagents.
 | Table 11. Forced degradation. [Click here to view] |
CONCLUSION
For the assessment of AZL and CIL in bulk and pharmaceutical oral pharmaceutical formulations, a simple, precise, accurate, specific, robust, and stable UPLC technique was used by the DoE approach employing a CCD. The method of solvent used in this technique was cost-effective. Values of % RSD were within 2% and the accuracy of the procedure was confirmed by the 99.9% and 99.5% recovery. The outcomes for the UPLC technique were expressed as good. The UPLC technique is more sensitive, and precise than the techniques using spectroscopy. This approach is suitable for routine analysis of AZL with CIL in pharmaceutical dosage forms and bulk drugs.
AUTHOR CONTRIBUTIONS
All authors made substantial contributions to conception and design, acquisition of data, or analysis and interpretation of data; took part in drafting the article or revising it critically for important intellectual content; agreed to submit to the current journal; gave final approval of the version to be published; and agree to be accountable for all aspects of the work. All the authors are eligible to be an author as per the International Committee of Medical Journal editors (ICMJE) requirements/guidelines.
FINANCIAL SUPPORT
There is no funding to report.
CONFLICTS OF INTEREST
The authors report no financial or any other conflicts of interest in this work.
ETHICAL APPROVALS
This study does not involve experiments on animals or human subjects.
DATA AVAILABILITY
All data generated and analyzed are included in this research article.
PUBLISHER’S NOTE
This journal remains neutral with regard to jurisdictional claims in published institutional affiliation.
REFERENCES
Andhalea SM, Nikalje APG. Simultaneous estimation of azilsartan and cilnidipine in bulk by RP-HPLC and assessment of its applicability in marketed tablet dosage form. Int J App Pharm, 2022; 14(1):116–23.
Desai MM, Nikalje AAG. Quality-by-design based development and validation of stability indicating method by UPLC method for impurities of simvastatin from drug and pharmaceutical dosage form. IJPS, 2021; 83(1):110–9.
Deshmukh S, Vanjari S, Patil R. Application of design of experiment based innovative approach in method development and validation of RP-HPLC for estimation of azilsartan in bulk and pharmaceutical tablet dosage form. Indian J Pharm Educ Res, 2020; 54(3):657–66.
Ghante M, Akhade N, Gota P, Nikam A, Jagtap S, Nikam V. Development and validation of high-performance thin-layer chromatography method for simultaneous estimation of nebivolol hydrochloride and cilnidipine. Asian J Pharm Clin Res, 2019; 12(4):347–50.
ICH. ICH Harmonized Tripartide Guideline: validation of analytical procedure: text and methodology Q2 (R1). ICH, Silver Spring, MD, p 17, 2005.
Jani R, Patel S. Development and validation of spectrophotometric method for simultaneous estimation of azilsartan kamedoxomil and cilnidipine in synthetic mixture. World J Pharm Res, 2018a; 7(8):948–58.
Jani R, Patel S. Simultaneous spectrophotometric determination of azilsartan kamedoxomil and cilnidipine in the mixture. Int J Res Pharm Pharm Sci, 2018b; 3(2):86–90.
Jena BR, Panda SP, Kulandaivelu U, Alavala RR, Rao GSNK, Swain S, Ghose D, Pattnaik G, Pradhan DP. Analytical QbD-based systematic development of a novel RP-UHPLC method for quantification of albuterol sulfate in its metered dose inhaler formulations. J Res Pharm, 2021; 25(5):689–701.
Juran JM. Juran on quality by design: the new steps for planning quality into goods and services. The Free Press, New York, NY, 1992.
Kumar H, Begum A. Determination of azilsartan medoximil and chlorthalidone in tablets exposed to forced degradation by using RP-HPLC. Biomed Res, 2019; 30 (5):775–85.
Khan N, Ameeduzzafar, Ali A, Ahmad FJ. A novel validated stability-indicating HPTLC method to quantitate forskolin as a bulk drug and in a nanosuspension. Indian J Pharm Sci, 2018; 80(5):820–6.
Prajapati P, Tailor P, Shahi A, Acharya A, Shah S. Application of Taguchi OA and Box–Behnken design for the implementation of DoE-based AQbD approach to HPTLC method for simultaneous estimation of azilsartan and cilnidipine. J Chromatogr Sci, 2022; 60(5):bmac045.
Rathod R, Patil A, Shirkhedkar A. Novel NP, and RP-HPTLC in praxis for simultaneous estimation of chlorthalidone and cilnidipine in bulk and pharmaceutical formulation. J Anal Chem Lett, 2018; 8(6):862–71.
Ruhina T, Mamatha T. A novel RP HPLC method for development and validation of cilnidipine in bulk and pharmaceutical dosage form. Asian Pharm Tech, 2017; 5(14):72–81.
Solanki RV, Patel RB, Patel RK, Patel BM. Development and validation of fast and robust stability indicating RP-HPLC method for simultaneous estimation of azilsartan medoxomil and cilnidipine in pharmaceutical dosage form. Int J Pharm Investig, 2022; 12(3):293–8.
Soliman MM, Darwish MK, Abdel-Razeq SA. Determination of amlodipine besylate and azilsartan medoxomil by UHPLC, HPTLC, and spectrophotometric techniques. Int Res J Pure Appl Chem, 2019; 19(3):1–13.
Sonawane S, Jadhav S, Rahade P, Chhajed S, Kshirsagar S. Development and validation of a stability-indicating method for estimation of chlorthalidone in bulk and tablets with the use of experimental design in forced degradation experiments. Scientifica (Cairo), 2016; 2016:9.
Surwade K, Saudagar R. UV Spectrophotometric method for the estimation of azilsartan medoxomil in bulk and pharmaceutical formulations. World J Pharm Res, 2015; 4(1):1667–72.
U. S. Food and Drug Administration. Guidance for industry: Q8 (2) pharmaceutical development. U. S. Food and Drug Administration, 2009.
Vyas R, Dediya P, Shah S, Shah D. Development and validation of HPTLC method for estimation of azilsartan medoxomil. Pharma Sci Monit, 2019; 10(1):108–17.
WHO. Guideline for the pharmacological treatment of hypertension in adults. WHO, Geneva, Switzerland, 2021.
Yu LX, Amidon G, Khan MA. Understanding pharmaceutical quality by design. AAPS Journal, 2014; 16(4):771–83.
https://go.drugbank.com/drugs/DB08822 (Accessed 21 December 2012).
https://go.drugbank.com/drugs/DB09232 (Accessed 23 October 2015).
https://pubchem.ncbi.nlm.nih.gov/compound/Azilsartan
https://pubchem.ncbi.nlm.nih.gov/compound/Cilnidipine (Accessed March 2005).