
INTRODUCTION
In the recent years, there has been an increased surge towards the quality-by-design (QbD) approach in the pharmaceutical industry as a systematic way to achieve quality standards during the product life cycle. QbD uses a quality risk management approach to emphasize the product and process understanding. This approach is in contrast to the classic trial and error methodology, which is purely based upon an expert’s opinion wherein only one factor/variable was modified while keeping the others constant (one factor/variable at a time approach) (Sahu et al., 2018). The QbD principles applied to analytical procedures, also known as Analytical QbD (AQbD), aim to produce data with acceptable quality. Application of Design of experiments (DOE) methodology and risk analysis can help to study the variables affecting a method’s uncertainty, to avoid forthcoming failures and hence strategically build a quality method. Box Behnken Design (BBD), Central Composite Design (CCD) and a 3-level complete factorial design are few examples of designs applied to optimize the factors (Carini et al., 2013). The advantage of BBD over CCD and other designs is that It does not operate at extreme levels (that is maximum/lowest level of all parameters at the same time) where there is a potential that practical issues outweigh statistical issues (Mullick et al., 2021; Mutalik et al., 2021).
Rivastigmine (RST) is an US Food and Drug Administration (FDA)-approved acetyl- and butyryl-cholinesterase inhibitor used in treating mild to moderate Alzheimer’s disease (AD) by increasing synaptic acetylcholine (ACh) levels (Eskander et al., 2005; Lane et al., 2015). AD is a progressive neurological dysfunction caused due to neuronal deterioration which is characterized by dementia has been primarily affecting wide strata of the population worldwide. The early AD pathogenesis begins with reduced production of ACh neurotransmitter, presynaptic loss of limbic and neocortical cholinergic innervations which further progresses leading to the severity of the cognitive decline. This led to proposing the cholinergic hypothesis and invention of cholinesterase inhibitor drugs (Hampel et al., 2018, 2019).
Several analytical techniques were reported for the determination of RST in biological fluids. Spectrophotometric methods were developed for RST estimation in biological matrices using HPLC-UV and HPLC-fluorimetry (Amini et al., 2010; Arumugam et al., 2011b; Karthik et al., 2008); however these HPLC methods were based on liquid–liquid extraction, which were tedious and expensive for routine bio-analysis. Several liquid chromatographic methods using HPLC - Mass spectrometry (MS) were reported for RST analysis in human and rat plasma and urine, which were sensitive and selective with very low quantification levels (Arumugam et al., 2011a; Bhatt et al., 2007; Enz et al., 2004; Frankfort et al., 2006; Pommier and Frigola, 2003). However, such techniques need sophisticated equipment, trained personnel and are not easily affordable in all laboratories. Additionally, most of these MS detections of RST involved liquid–liquid extraction techniques. MS detection of RST in human plasma was reported using the solid phase extraction technique, which is expensive and involves time-consuming processing (Bhatt et al., 2007). Another MS detection of RST in human plasma extracted using protein precipitation used gradient technique for separation of analytes, which requires dwell time to adjust the column conditions and post-gradient column re-equilibration, which results in longer run time (Frankfort et al., 2006). Molecularly imprinted polymers-voltametric sensors have been fabricated for RST measurement in biological samples within a range of 2–1,000 μmol/l (Arvand et al., 2013); Novel miniaturized polyvinyl chloride membrane sensors in all-solid-state graphite and platinum wire supports to aid in electrochemical evaluation of RST in plasma and brain samples (El-Kosasy et al., 2005). However, these methods suffer either from low sensitivity or low drug recovery due to extraction procedures.
In the current work, we assessed the validity of the analytical procedure by applying the AQbD approach in the method development for the quantification of RST in rat plasma and brain matrices. The method optimization was done by applying Box Behnken DOE and validated by US FDA guidelines. The validated method application was studied by conducting nasal pharmacokinetics (PKs) of RST in healthy male Sprague Dawley rats.
MATERIALS AND METHODS
Experimental
Instrumentation
The HPLC system (LC-2010CHT, Serial No. C21255111757—LP, Shimadzu Corp., Kyoto, Japan) used was equipped with quaternary low-pressure gradient pumps to deliver four solvents, SPD-M-20A photodiode array- UV detector, degasser unit, autoinjector, and column oven. Hyperclone 5 μm Base Deactivated Silica (BDS) C8 130 Å Liquid Chromatography (LC) column (Dimensions: 250 × 4.6 mm) was used as the stationary phase. The chromatographic data were acquired and integrated using LC solutions, 5.57 version software. Measurement and pH adjustments of buffer solution were done with help of pH meter (Model Eutech pH 510, Thermofisher Scientific, Bengaluru, India) using a glass electrode (Van London Co., Houston, TX). The aqueous buffer was filtered through 0.22 µ filter membrane using glass vacuum filtration assembly (Millipore, Billerica, MA) and degassed using a bath sonicator (Equitron; Medica Instruments Mfg. Co., Mumbai, India). The complete sample preparations during analysis were done using well calibrated micropipettes (Eppendorf India Ltd, Chennai, India). Vortex mixer, high-speed cooling centrifuge (Model 6000, Kubota Laboratory Centrifuges) were used for sample preparation and −20°C and −80°C freezers were used for storage.
Materials and reagents
RST (base form) and Risperidone (RIS) (used as an internal standard) were provided as gift samples from Zydus Cadila, Ahmedabad, India. Potassium dihydrogen orthophosphate (KH2PO4) (purity ≥99%) was obtained from Sigma Aldrich (Bangalore, India). LC grade of acetonitrile (ACN) was obtained from Merck Ltd (Mumbai, India) and methanol (MeOH) was purchased from Finar Ltd (Ahmedabad, India). Milli-Q water was obtained from a Millipore Direct-Q® 3 water purification system (Millipore Corp.) present in our laboratory.
Design of experiment
Risk assessment
The quality risk assessment approach was adopted before analytical method optimization to identify, analyze, and predict the potential risks of various chromatographic parameters on the method efficiency. With prior knowledge, a risk estimation matrix was set, as shown in Table 1, thus reducing the number of method parameters to be studied in the experimental phase. Risk assessment further helped in performing DOE using the high-risk method parameters [Critical Method Parameters (CMP)] and studying their impact on the Critical Analytical Attributes (CAA) (Bandopadhyay et al., 2020).
Factor optimization
In this study, BBD, with three CMP (factors) was used to accomplish optimization of the HPLC method. The three factors viz. organic phase (A), flow rate (B), and wavelength (C) are considered, each at three levels including low (−1), medium (0), and high levels (+1). BBD was selected over CCD as it required fewer runs to study three factors. BBD was employed to evaluate main effects, interactions between factors, and quadratic terms of independent factors on dependent responses constructed using Design Expert software (Version 9.0.1, Stat-Ease Inc., Minneapolis, MN) through the polynomial equation and further to optimize the factors statistically. The design matrix included 17 experimental runs of which n = 5 were replicates of center point to estimate any experimental uncertainty. Table 2 depicts the 17 combinations of factors in a randomized order as per BBD and the measure responses. Table 3 depicts the factors selected and their values corresponding to each level.
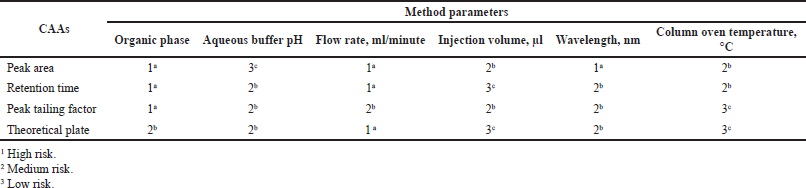 | Table 1. Risk assessment matrix for RST HPLC method. [Click here to view] |
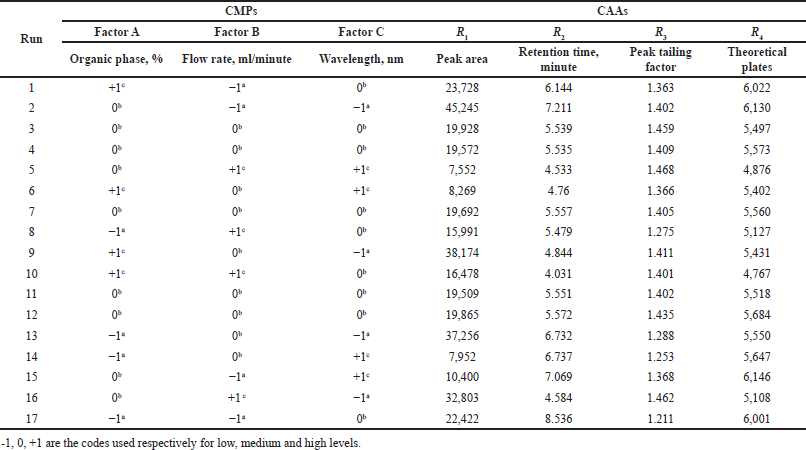 | Table 2. Experimental data for the BBD. [Click here to view] |
Statistical analysis of data
The model significance was evaluated statistically using the F test and lack of fit test (at p ≤ 0.05). The significance of regression coefficients was determined by the F test. The best fit for the model equation was determined by R2 as well as adjusted R2 values. The factor interactions coefficients which were statistically insignificant were disregarded as model terms (Dalvi et al., 2018).
Diagnostic plots
Diagnostic plots including predicted versus actual and residual plots evaluated the model’s predictive ability. The desirability function aided in the evaluation of the best condition for all the responses. The combination of factors that gave the high desirability value was considered as the optimum chromatographic method parameter.
Procedures
Plasma and brain tissue sample processing
All the animal experimental protocols were approved by Institutional Animal Ethics Committee, Kasturba Medical College, Manipal (Approval No. IAEC/KMC/36/2019). Capillary tubes were used for blood withdrawal using the retro-orbital puncture technique from Sprague Dawley rats (250–300 g; male). The blood was taken in centrifuge tubes which contained 10% disodium Ethylenediamine tetraacetic acid (EDTA) solution as an anticoagulant (i.e., 20 μl anticoagulant required for 200 μl blood). The collected blood was placed in a cooling centrifuge at 4°C for 10 minutes at 10,000 rpm after which plasma was separated carefully and stored at −20°C. For a collection of the brain, rats were anesthetized and exsanguinated by first incising the abdominal artery and then infusing 0.9% w/v NaCl solution (saline) into the heart, to completely withdraw blood from brain tissue. The whole brain was collected carefully and stored at −20°C till further use.
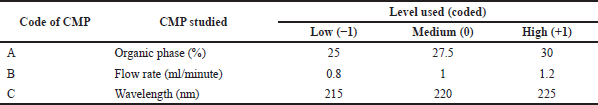 | Table 3. CMPs and their levels used in BBD. [Click here to view] |
Preparation of stock solutions
The stock solutions of 1,000 µg/ml RST and internal standard RIS were prepared in MeOH separately. RST aqueous working stock solution was made by diluting accurate quantities of stock solution.
Preparation of calibration control (CC) and quality control (QC) samples
Aqueous dilutions of RST were made by taking the required quantities of working stock and diluting with diluent to get the required concentration of CC standards and QC standards viz. Low-quality control (LQC), Middle-quality control (MQC), and High-quality control (HQC).
Sample extraction method
The protein precipitation technique was used to extract RST from plasma and brain homogenate containing RIS as an internal standard using chilled MeOH. The brain homogenate was prepared with 1:1.5 ratio of brain tissue to phosphate buffer saline (PBS) (pH 7.4) under cold conditions to get a less viscous and fine tissue homogenate. Extraction procedures for blank plasma/brain samples and calibration standards spiked into plasma/brain samples were identical. The plasma/brain calibration standards were prepared as follows: The rat plasma/brain homogenate (190 µl) was placed in pre-labeled microcentrifuge tubes, and 10 µl of respective spiking stock solutions containing RST was added to the respective tube and vortexed for 10 seconds. This was followed by the addition of the precipitating solvent which consisted of internal standard (RIS 10 µg/ml) prepared in chilled MeOH. The ratio of the matrix containing RST to precipitating solvent was 1:3. Further, the plasma/brain sample containing only precipitating solvent (chilled MeOH with RIS) was vortexed for 2 minutes and used as a Standard 0. The blank plasma/brain sample was prepared by addition of only chilled MeOH (without RIS). All the above samples were centrifuged for 10 minutes at a speed of 10,000 RPM using cooling centrifuge. After centrifugation, the supernatant was transferred to a clean insert vial appropriately labelled and HPLC analysis was performed (Hegde et al., 2021).
Bioanalytical method validation
The FDA guidance to industry (2001) criteria for bio-analytical technique validation was used to validate the method for the measurement of RST.
System suitability
Six injections of aqueous solution corresponding to the MQC concentration of RST were combined with the RIS working stock solution to determine the system’s compatibility. The % CV of the area ratio and the retention time of RST and RIS were computed.
Selectivity
To evaluate any interference from constituents in the rat plasma/brain (matrix effect), screening was done using six plasma/brain matrix lots from different rats. For the specificity, the matrix lots were extracted using precipitating solvent, with and without an internal standard. Any interference from the blank matrix was evaluated by comparing it to the LQC samples (75 ng/ml).
Linearity and sensitivity
The linearity of the method was evaluated using calibration standard range of 75–3,000 ng/ml for plasma and brain matrices. LQC was determined by injecting six samples of the lowest acceptable concentration of the linearity range and % CV and % nominal concentration were calculated.
Accuracy and precision
The RST precision and accuracy were assessed by processing and evaluating quality control standards in both plasma and brain samples, each with six repetitions (LQC, MQC, HQC). Inter-day and intraday batches were used to test precision.
Recovery
The average peak areas of three plasma/brain extracted LQC (75 ng/ml), MQC (750 ng/ml), and HQC (2,500 ng/ml) samples were compared to the aqueous samples of the same concentrations of LQC, MQC, and HQC by replacing plasma/brain matrices with water to assess RST recovery.
Stability studies
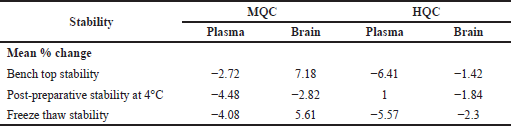
RST stock solution stability was determined by storing it at room temperature for 6 hours, to account for the sample preparation time, i.e., the entire time taken for sample work-up and evaluation (Kadian et al., 2016). The stability of stock solutions was assessed by comparing freshly processed samples to stable samples at the MQC level. The stability of RST in rat plasma and brain was determined utilizing two different concentration levels (MQC and HQC). The validation included bench top, post-preparative, and freeze and thawing analytes. All stability samples were compared to freshly produced RST samples at the same concentration level. Stability was calculated as the mean percentage change in the stability samples.
PKs study
Male Sprague Dawley rats were used in the study with body weight ranging between 250 and 300 g (n = 4). All study animals had been placed in cages and made accustomed to institutional animal house maintained at temperature of 22°C ± 1°C; relative humidity of 55% ± 10%; 12 hours light/dark cycle. Water and food were given as and when required. The dose of RST intended for nasal PK study was solubilized just before the commencement of the study. The dosing was done using a 20 µl micropipette in rats. RST at a dose of 1.5 mg/kg, at a dose volume of 50 µl; 25 µ l was administered through each nostril. The technique used for blood collection was through retro-orbital vein puncture and the blood was collected in pre-labelled, disodium EDTA anticoagulant containing centrifuge tubes. Blood (approximately 200 μl) was withdrawn at 0, 5, 15, 30, 45, 60, 120, and 240 minutes following nasal administration of RST. For brain PKs, after nasal dosing, brain samples were collected at different time points, which was decided based on plasma concentration versus time profile of RST. At 15, 30, 45, 60, 120, and 240 minutes after dosing and blood sampling, four animals were sacrificed by cervical necrosis method at each time point and the brain was removed, washed with saline, weighed, and stored in −20°C until analysis. Further, the developed and validated method was used to analyse all the PK samples. Plasma concentration and brain concentration versus time profile were plotted to analyze the samples. Different compartment models were used to determine the best fit and to finalize the compartment model which was observed with nasal PKs data of RST. PK parameters like t1/2, AUC, tmax, Cmax were computed with help of non- compartmental analysis in PK Solutions software.
RESULTS AND DISCUSSION
Design of experiment
Risk assessment
The risk assessment study included the chromatographic method parameters such as organic phase, aqueous buffer pH, flow rate, wavelength, injection volume, column oven temperature; which would primarily be responsible for any critical variability in the analytical attributes viz. drug peak area, retention time, peak tailing and theoretical plates. The method parameters/factors which showed high-risk impact on CAA included organic phase, wavelength, and flow rate, which were subjected to evaluation by DOE, while CAA included peak area, retention time, peak tailing factor, and theoretical plates were selected as responses.
Factor optimization
Table 3 delineates the independent factors along with the level used. In Table 2, the data for the responses were analyzed and fitted in several mathematical models.
The mathematical models were expressed as follows:
The quadratic model followed the equation:
Ri =b0 +b1A+b2B+b3C+b4AB+b5AC+b6BC+b7A2 +b8B2 +b9C2
and, Linear model followed the equation:
Ri =b0 +b1A+B2B+b3C
where b0 is the intercept, Ri is the response, bi’s (i = 1, 2, 3...n) are coefficients of individual linear, quadratic, and cubic effects along with their interactions. Factors A, B, and C are the CMP in the design.
Statistical data analysis
Statistical evaluation for all the responses using BBD was tabulated in Table 4. For every response, the model showing a high F value was selected and validated with help of analysis of variance. Quadratic model was found to be appropriate and significant for the following responses: peak area (R1) with a F value of 2,589.01 (p < 0.0001); retention time (R2) with a F value of 6,488.79 (p < 0.0001) and peak tailing factor (R3) with F value of 20.42 (p < 0.0003). However, it was observed that for theoretical plate number (R4), linear model was found to be appropriate and significant with a F value of 95.33 (p < 0.0001). Adjusted R2 (R2adj) value represents the goodness of fit of the model. High values define a better correlation between software predicted values and actual values. The R2adj value for the responses R1, R2, R3 and R4 were 0.9993, 0.9997, 0.9161, and 0.9465, respectively. The p value determines the significance of each coefficient and the terms with p value less than 0.05 were added to the model equation. The model equation for responses in terms of coded factors is as follows:
Drug peak area
(R1) = +19,713.20 + 378.50*A − 3,621.38*B − 14,913.13*C + 2,398.50*BC − 572.85*A2 + 514.40*B2 +3,772.40*C2
Retention time
(R2) = +5.55 − 0.96*A − 1.29*B − 0.034*C + 0.24*AB +0.023*BC +0.21*A2 + 0.29*B2
Peak tailing factor
(R3) = +1.42+0.064*A +0.033*B − 0.10*A2
Theoretical plate number
(R4) = +5531.71 − 87.87*A − 552.62*B − 18.50*C
Diagnostic plots
Diagnostic plots such as predicted versus actual plots represent the model’s appropriateness by depicting the correlation between software predicted values and actual values. As seen in Figure 1, the data points in the plot for all the responses lie close to straight line, thus indicating a good agreement between software predicted values and actual values. Figures 2 and 3 depict the 2D contour plots and perturbation plots respectively which are a graphical representation of the regression equation. The individual effects and interaction effects of the independent factors on the responses can be visualized easily with these plots. In Figure 3, as shown in perturbation plots, the following responses were observed for the independent factors. Peak area significantly decreased with an increase in the wavelength (Factor C) from −1 (215 nm) to +1 (225 nm), indicating a negative effect; whereas no significant changes in Retention time, tailing factor and theoretical plate number were observed with increase in wavelength. However, increase in organic phase ratio (Factor A) from −1 (25%) to +1 (30%) and increase in flow rate (Factor B) from −1 (0.8 ml/minute) to +1 (1.2 ml/minute) showed a substantial negative effect on Retention time. A significant negative effect was also seen in the theoretical plate number where the plate number decreased by increasing the flow rate from −1 (0.8 ml/minute) to +1 (1.2 ml/minute). A slight increase in peak tailing factor was observed as the flow rate increased whereas a mixed response was observed with the effect of the organic phase on peak tailing factor. There was an initial significant increase in peak tailing factor as organic phase was increased, after reaching the mid value, there was a slow decrease in the peak tailing factor. As seen in perturbation plots, the effect of flow rate and organic phase was observed in 2 D contour plots in Figure 2. The desirability values usually range between 0 and 1 for optimized solutions, indicating the strength of the method. If values are closer to 0, then the predicted method is deemed to be weak and if values are closer to 1, then the method is deemed to be strong. An optimized solution, indicated by the desirability value of 0.996 was observed with the following chromatographic conditions: Mobile phase consisting of pH 4.5 phosphate buffer and ACN as organic phase in the ratio of 72.5 and 27.5, flow rate of 0.8 ml/minute, column temperature of 40°C and detection at 215 nm. For the check point analysis, the predicted values of the factors and responses obtained from the software are compared with the actual experimental values (n = 3) and the % error was tabulated in Table 5, which was found to be within ±15%.
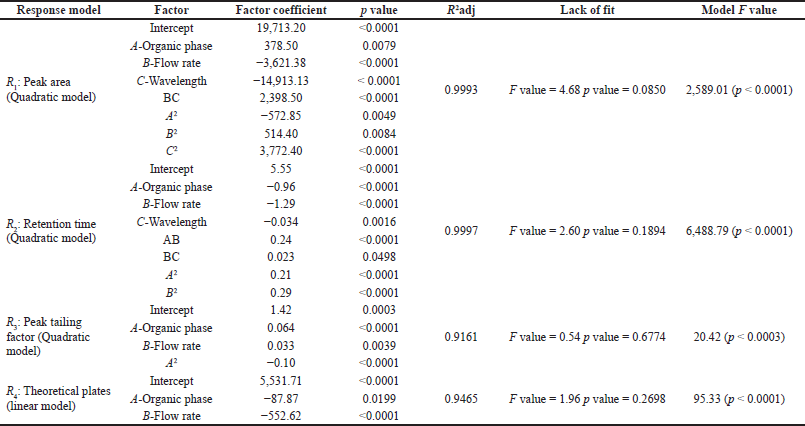 | Table 4. Statistical analysis for BBD. [Click here to view] |
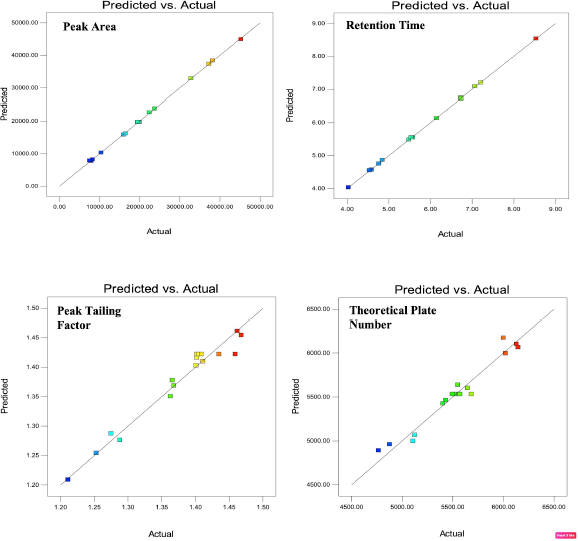 | Figure 1. Predicted versus actual plots indicating the model’s appropriateness for the responses R1, R2, R3, and R4. [Click here to view] |
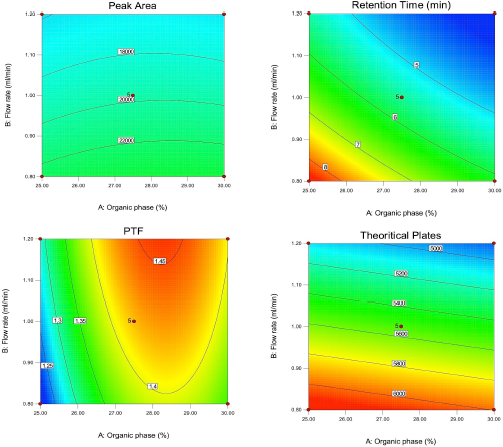 | Figure 2. 2D contour plots depicting effect of organic phase (Factors A), flow rate (Factor B), wavelength (Factor C) for the responses R1, R2, R3 and R4. [Click here to view] |
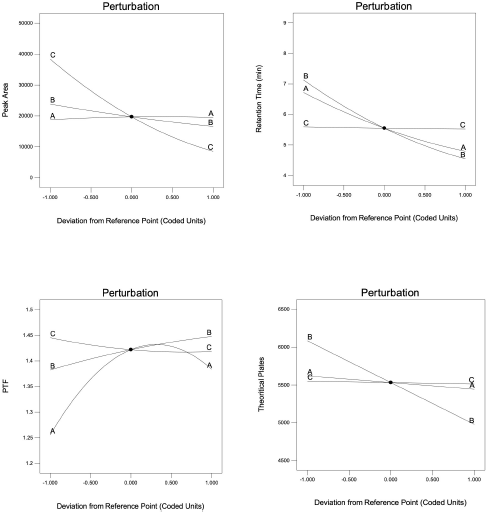 | Figure 3. Perturbation plots depicting effect of organic phase (Factors A), flow rate (Factor B), wavelength (Factor C) for the responses R1, R2, R3, and R4. [Click here to view] |
Sample extraction technique
Previous reports suggest the use of protein precipitation technique for RST extraction from brain matrices using ACM:MeOH mixture (Mullangi et al., 2011), whereas there are very few reports suggesting the RST extraction from plasma using protein precipitation technique (Bhatt et al., 2007). Further, few studies have used HPLC with UV detection for RST estimation in biological matrices, which is commonly available and economical (Amini et al., 2010). In the above-mentioned published article (Mullangi et al., 2011), the protein precipitation technique was used for the extraction of the drug in the brain matrix; whereas liquid–liquid extraction technique was used to extract the drug from the plasma. In the present study, the protein precipitation technique was for the drug extraction technique from the plasma and brain matrices. Additionally, with the protein precipitation technique, the recovery in both matrices was good and both drugs were quantified using the HPLC-UV method. Although HPLC with fluorescence detection is more sensitive than HPLC-UV technique, the objective of this work was to optimize the chromatographic conditions using HPLC-UV, which is more commonly available and economical, to detect the drug in the plasma and brain matrices using a simple extraction technique with good recover
In the present work, for the estimation of RST in brain, brain tissue was homogenized using chilled PBS (pH 7.4). The RST samples from the plasma and brain were extracted using the protein precipitation method, which is a faster and less expensive approach in comparison to liquid-liquid extraction and solid-phase extraction. For RST extraction, solvents such as ice cold ACN and MeOH were used individually and in combinations to precipitate the protein. Since ACN was present in mobile phase, initial trials were taken using ACN as precipitating agent alone and in combination with MeOH, but the presence of ACN resulted in broad drug and internal standard peaks along with matrix interference. MeOH gave sharp, well-defined peaks for RST and RIS (internal standard). RIS was desired as an internal standard as it showed good recovery after being extracted from the biology matrices and also gave a good peak shape at a desirable retention time and did not interfere with the retention time of RST. RIS could also be sufficiently quantified at the wavelength of 215 nm. To efficiently recover RST from the biological matrices, ice cold MeOH was used at 1:3 ratio, 1 part of plasma/brain homogenate was added with 3 parts of ice cold MeOH containing RIS (internal standard).
The chromatographic conditions for the Bioanalysis of RST were as follows: Stationary phase: Hyperclone 5 μm BDS C8 130 Å LC column (Dimensions: 250 × 4.6 mm); Mobile phase: pH 4.5 phosphate buffer and ACN as organic phase in the ratio of 72.5 and 27.5; Column temperature: 40°C; Flow rate: 0.8 ml/minute; Injection volume: 40 μl; UV wavelength: 215 nm; Internal standard: RIS; Precipitating solvent: Chilled MeOH.
Bioanalytical method validation
System suitability
The developed techniques satisfied the system appropriateness requirements by having a % CV of 2.4% for the area ratio and 0.21% for the analyte retention time.
Selectivity
The protein precipitation method was demonstrated to be effective and reliable for quantifying RST in plasma and brain matrices. In both matrices, there were no interfering peaks during the retention periods of RST or RIS. Figures 4 and 5 depict chromatogram overlays of diluent, blank matrix, matrix spiked with only internal standard, LQC, and HQC samples, and PK study samples for both plasma and brain. The peak shape was good under the optimized chromatographic conditions at retention times of 7.2 ± 0.09 and 13.2 ± 0.1 minutes for RST and RIS (internal standard), respectively, in plasma and 7.15 ± 0.1 and 13.17 ± 0.1 minutes for RST and RIS, respectively in the brain.
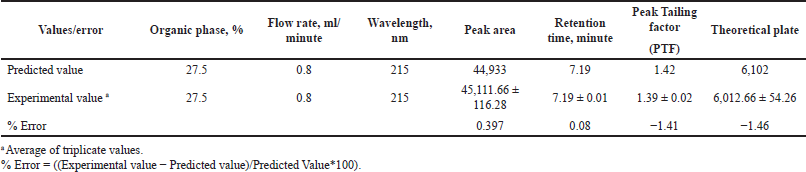 | Table 5. Check point analysis of optimized batch. [Click here to view] |
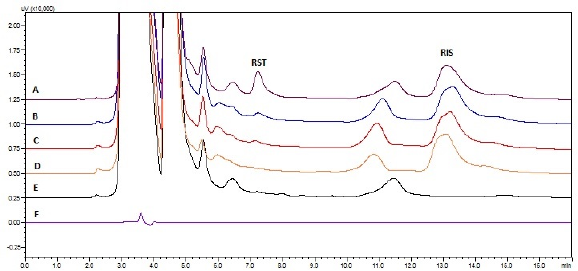 | Figure 4. Chromatograms of diluent and plasma samples eluted (A) plasma spiked with HQC; (B) PK sample; (C) plasma spiked with LQC; (D) plasma spiked with only internal standard; (E) blank plasma; (F) diluent. [Click here to view] |
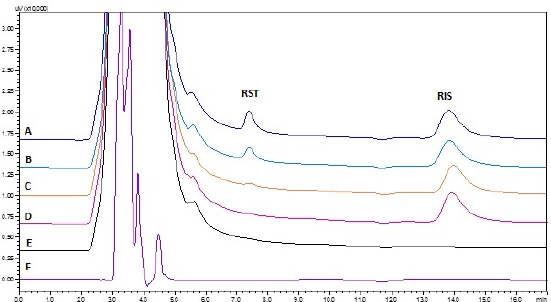 | Figure 5. Chromatograms of diluent and brain samples eluted: (A) brain spiked with HQC; (B) PK sample; (C) brain spiked with LQC; (D) brain spiked with only internal standard; (E) blank brain; (F) diluent. [Click here to view] |
Linearity
The standard calibration curves were created using the peak area ratios of RST/RIS as the vertical axis and the RST concentration (ng/ml) as the horizontal axis. The slope, intercept, and R2 values were calculated using linear regression analysis for plasma and brain. In plasma, the slope was 0.00007, intercept was 0.0011 and R2 was 0.9971. In the brain, the slope was 0.00005, the intercept was 0.0025 and R2 was 0.9973. Calibration curves for RST concentrations of 75–3,000 ng/ml in plasma and brain were linear, accurate, and exact. The concentration of RST at each calibration level was determined by back calculation using the calibration curves. The findings fulfilled the R2 > 0.98 acceptance criterion.
Accuracy and precision
The inter-day and intraday precision and accuracy for RST at each concentration level in both matrices are represented in Tables 6 and 7. RST QC samples, such as LQC, MQC, and HQC samples, were determined to be within the acceptable standards of 85%–115% for plasma samples and 80%–120% for brain samples.
Recovery
Absolute recovery of RST was observed in all QC samples. The mean recovery for RST from the rat plasma and brain at LQC, MQC, and HQC concentrations were found to be in the range of 90%–101% in comparison to the aqueous samples of the same concentrations. % CV for LQC levels of RST in plasma and brain were found to be 3.36% and 2.03%, respectively.
Stability studies
The stability studies of RST included stock solution stability and stability in plasma and brain matrix. After 6 hours at room temperature, the RST stock solution was determined to be stable with a mean percentage change of 0.29 compared to freshly prepared MQC. RST was shown to be stable in both plasma and brain samples after 3 freeze-thaw cycles. When processed samples were kept in auto-sampler at 4°C and on bench-top for 24 hours, RST was found to be stable in both matrices under all the stability conditions and all the results were within the 15% tolerance limit. All the above data were represented as Mean percentage change in comparison to freshly prepared samples and tabulated in Table 8.
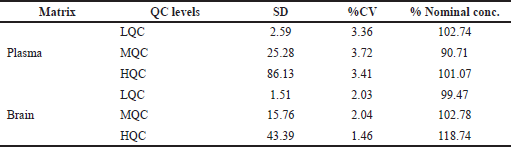 | Table 6. Intraday accuracy and precision of RST in plasma and brain. [Click here to view] |
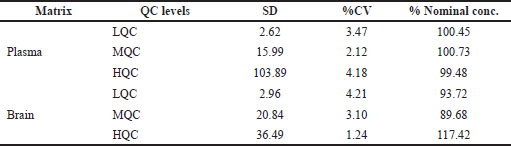 | Table 7. Inter-day accuracy and precision of RST in plasma and brain. [Click here to view] |
 | Table 8. Stability analysis of RST in plasma and brain. [Click here to view] |
 | Table 9. PK parameters for intranasal route for RST. [Click here to view] |
PKs study
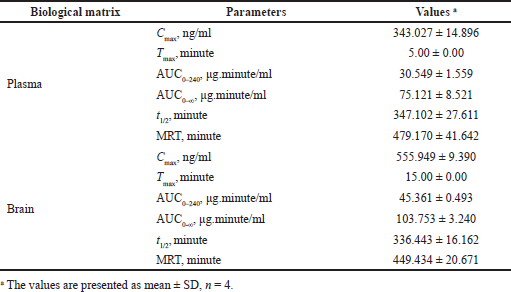
The validated method aided in PK estimation of RST in plasma and brain samples at defined time intervals and in determining the PK parameters for RST following nasal administration. The PK parameters are tabulated in Table 9. The mean plasma concentration of RST (n = 4) versus time profile is shown in Figure 6A and mean brain concentration of RST brain is shown in Figure 6B. Nasal administration of RST in rats resulted in a peak concentration of (Cmax) of 343.027 ± 14.896 ng/ml in plasma and 555.949 ± 9.390 ng/ml in brain and exhibited Tmax at 5 minutes in plasma and 15 minutes in brain. The plasma AUC(0–240) was observed to be 30.549 ± 1.559 μg.minute/ml while AUC(0–∞) was observed to be 75.121 ± 8.521 μg.minute/ml. The brain plasma AUC(0–240) was observed to be 45.361 ± 0.493 μg.minute/ml while AUC(0–∞) was observed to be 103.753 ± 3.240 μg.minute/ml. RST showed a mean residence time (MRT) of 479.170 ± 41.642 minutes and t1/2 equivalent to 347.102 ± 27.611 minutes in plasma and MRT of 449.434 ± 20.671 minutes and t1/2 equivalent to 336.443 ± 16.162 minutes in the brain. These results were compared with previously reported results for nasal administration of RST (Arumugam et al., 2008; Wavikar et al., 2017). Thus, the chromatographic method demonstrates its appropriateness to estimate RST in rat plasma and brain.
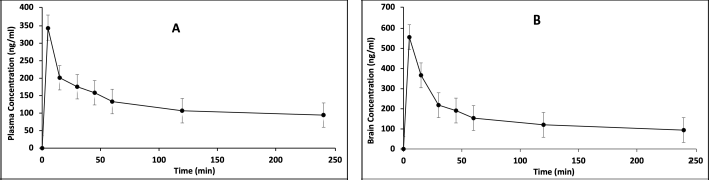 | Figure 6. PKs profiles of RST via intra-nasal route. (A) mean plasma concentration of RST versus time (1.5 mg/kg, n = 4). (B) mean brain concentration of RST versus time (1.5 mg/kg, n = 4). [Click here to view] |
CONCLUSION
This study reports the impact of QbD in the development and routine use of the bioanalytical method over the traditional approach to method development for estimation of RST in rat plasma and brain. This research is of high importance as no validated bioanalytical method has been previously reported for the RST estimation in these biological matrices using a highly affordable HPLC/UV system wherein the drug was extracted by a simple and fast protein precipitation approach. This validated method was found to be selective, linear, accurate, precise, and able to detect RST at the lowest concentration of 75 ng/ml. Nasal PK studies using RST solution were studied as an application of the method which further helped to elucidate the drug’s estimation in the brain. This validated method has been observed seen to be simple, sensitive, cost-effective, and reproducible for routine estimation of RST. This study also emphasizes that the QbD approach could represent novelty for the controlled development of a robust and reliable bioanalytical method for its pre-clinical or clinical applications.
AUTHOR CONTRIBUTIONS
All authors made substantial contributions to conception and design, acquisition of data, or analysis and interpretation of data; took part in drafting the article or revising it critically for important intellectual content; agreed to submit to the current journal; gave final approval of the version to be published; and agree to be accountable for all aspects of the work. All the authors are eligible to be an author as per the international committee of medical journal editors (ICMJE) requirements/guidelines.
FUNDING
There is no funding to report.
CONFLICTS OF INTEREST
The authors report no financial or any other conflicts of interest in this work.
ETHICAL APPROVALS
All the animal experimental protocols were approved by Institutional Animal Ethics Committee, Kasturba Medical College, Manipal (Approval No. IAEC/KMC/36/2019).
DATA AVAILABILITY
All data generated and analyzed are included within this research article.
PUBLISHER’S NOTE
This journal remains neutral with regard to jurisdictional claims in published institutional affiliation.
REFERENCES
Amini H, Ahmadiani A. High-performance liquid chromatographic determination of rivastig-mine in human plasma for application in pharmacokinetic studies. Iran J Pharm Res, 2010; 0(2):115–21.
Arumugam K, Subramanian GS, Mallayasamy SR, Averineni RK, Reddy MS, Udupa N. A study of rivastigmine liposomes for delivery into the brain through intranasal route. Acta Pharm, 2008; 58(3):287–97. CrossRef
Arumugam K, Chamallamudi MR, Gilibili RR, Mullangi R, Ganesan S, Kar SS, Averineni R, Shavi G, Udupa N. Development and validation of a HPLC method for quantification of rivastigmine in rat urine and identification of a novel metabolite in urine by LC-MS/MS. Biomed Chromatogr, 2011a; 25(3):353–61. CrossRef
Arumugam K, Chamallamudi M, Mallayasamy S, Mullangi R, Ganesan S, Jamadar L, Ranjithkumar A, Udupa N. High performance liquid chromatographic fluorescence detection method for the quantification of rivastigmine in rat plasma and brain: application to preclinical pharmacokinetic studies in rats. J Young Pharm, 2011b; 3(4):315–21. CrossRef
Arvand M, Fallahi P. Voltammetric determination of rivastigmine in pharmaceutical and biological samples using molecularly imprinted polymer modified carbon paste electrode. Sens Actuators B Chem, 2013; 188:797–805. CrossRef
Bandopadhyay S, Beg S, Katare OP, Sharma T, Singh B. Integrated analytical quality by design (AQbD) approach for the development and validation of bioanalytical liquid chromatography method for estimation of valsartan. J Chromatogr Sci, 2020; 58(7):606–21. CrossRef
Bhatt J, Subbaiah G, Kambli S, Shah B, Patel M, Saxena A, Baliga A, Nigam S, Parekh H, Yadav G. A high throughput and sensitive liquid chromatography-tandem mass spectrometry (LC-MS/MS) method for the estimation of bisoprolol in human plasma using multiplexing technique. J Chromatogr B Anal Technol Biomed Life Sci, 2007; 852(1–2):374–81. CrossRef
Carini JP, Kaiser S, Ortega GG, Bassani VL. Development, optimisation and validation of a stability-indicating HPLC method of achyrobichalcone quantification using experimental designs. Phytochem Anal, 2013; 24(3):193–200. CrossRef
Dalvi AV, Uppuluri CT, Bommireddy EP, Ravi PR. Design of experiments-based RP—HPLC bioanalytical method development for estimation of Rufinamide in rat plasma and brain and its application in pharmacokinetic study. J Chromatogr B Anal Technol Biomed Life Sci, 2018; 1102–1103:74–82. CrossRef
El-Kosasy AM, Shehata MA, Hassan NY, Fayed AS, El-Zeany BA. Membrane electrodes for the determination of glutathione. Talanta, 2005; 66(3):746–54. CrossRef
Enz A, Chappuis A, Dattler A. A simple, rapid and sensitive method for simultaneous determination of rivastigmine and its major metabolite NAP 226-90 in rat brain and plasma by reversed-phase liquid chromatography coupled to electrospray ionization mass spectrometry. Biomed Chromatogr, 2004; 18(3):160–6. CrossRef
Eskander MF, Nagykery NG, Leung EY, Khelghati B, Geula C. Rivastigmine is a potent inhibitor of acetyl- and butyrylcholinesterase in Alzheimer’s plaques and tangles. Brain Res, 2005; 1060(1–2):144–52. CrossRef
Frankfort SV, Ouwehand M, van Maanen MJ, Rosing H, Tulner LR, Beijnen JH. A simple and sensitive assay for the quantitative analysis of rivastigmine and its metabolite NAP 226-90 in human EDTA plasma using coupled liquid chromatography and tandem mass spectrometry. Rapid Commun Mass Spectrom, 2006; 20(22):3330–6. CrossRef
Hampel H, Mesulam MM, Cuello AC, Farlow MR, Giacobini E, Grossberg GT, Khachaturian AS, Vergallo A, Cavedo E, Snyder PJ, Khachaturian ZS. The cholinergic system in the pathophysiology and treatment of Alzheimer’s disease. Brain, 2018; 141(7):1917–33. CrossRef
Hampel H, Mesulam MM, Cuello AC, Khachaturian AS, Vergallo A, Farlow MR, Snyder PJ, Giacobini E, Khachaturian ZS. Revisiting the cholinergic hypothesis in Alzheimer’s disease: emerging evidence from translational and clinical research. J Prev Alzheimers Dis, 2019; 6(1):2–15. CrossRef
Hegde AR, Padya BS, Soman S, Mutalik S. A simple, precise, and sensitive HPLC method for quantification of letrozole in rat plasma: development, validation, and preclinical pharmacokinetics. J Anal Sci Technol, 2021; 12(1):25. CrossRef
Kadian N, Raju KSR, Rashid M, Malik MY, Taneja I, Wahajuddin M. Comparative assessment of bioanalytical method validation guidelines for pharmaceutical industry. J Pharm Biomed Anal, 2016; 126:83–97. CrossRef
Karthik A, Subramanian GS, Surulivelrajan M, Ranjithkumar A, Kamat SB. Fluorimetric determination of rivastigmine in rat plasma by a reverse phase—high performance liquid chromatographic method. Application to a pharmacokinetic study. Arzneimittelforschung, 2008; 58(5):205–10. CrossRef
Lane RM, Darreh-Shori T. Understanding the beneficial and detrimental effects of donepezil and rivastigmine to improve their therapeutic value. J Alzheimers Dis, 2015; 44(4):1039–62. CrossRef
Mullangi R, Ranjithkumar A, Arumugam K, Mallayasamy SR, Ganesan S, Jamadar L, Udupa N, Chamallamudi MR. High performance liquid chromatographic fluorescence detection method for the quantification of rivastigmine in rat plasma and brain: application to preclinical pharmacokinetic studies in rats. J Young Pharm, 2011; 3(4):315–21. CrossRef
Mullick P, Mutalik SP, Hegde AR, Pandey A, Jagadish PC, Kini SG, Jain S, Mutalik S. Simultaneous estimation of apremilast and betamethasone dipropionate in microsponge-based topical formulation using a stability indicating RP-HPLC method: a quality-by-design approach. J Chromatogr Sci, 2021; 59(10):928–40. CrossRef
Mutalik SP, Mullick P, Pandey A, Kulkarni SS, Mutalik S. Box–Behnken design aided optimization and validation of developed reverse phase HPLC analytical method for simultaneous quantification of dolutegravir sodium and lamivudine co-loaded in nano-liposomes. J Sep Sci, 2021; 44(15):2917–31. CrossRef
Pommier F, Frigola R. Quantitative determination of rivastigmine and its major metabolite in human plasma by liquid chromatography with atmospheric pressure chemical ionization tandem mass spectrometry. J Chromatogr B Analyt Technol Biomed Life Sci, 2003; 784(2):301–13. CrossRef
Sahu PK, Ramisetti NR, Cecchi T, Swain S, Patro CS, Panda J. An overview of experimental designs in HPLC method development and validation. J Pharm Biomed Anal, 2018; 147:590–611. CrossRef
Wavikar P, Pai R, Vavia P. Nose to brain delivery of rivastigmine by in situ gelling cationic nanostructured lipid carriers: enhanced brain distribution and pharmacodynamics. J Pharm Sci, 2017; 106(12):3613–22. CrossRef