
INTRODUCTION
Therapeutic drug monitoring involves qualitative and quantitative analysis of drug and their concentration in biological matrix (such as tissue, whole blood, plasma, serum, urine, and saliva) (Anderson et al., 2004; Kole et al., 2011; Navitha Reddy et al., 2019). The most predominant biological matrix used in therapeutic drug monitoring (TDM) is blood or plasma sample due to distribution of drugs via blood. Due to the extensive demand for the blood samples for TDM, alternative method of sample collection is essential, where studies can be carried out without extensively harvesting blood from patients and the volume blood required doubles when the study has to be performed in plasma sample.
When performing studies regarding drug concentration and distribution, sampling of blood plasma and whole blood is golden standards. Conventional method of sample collection in TDM is venous blood collection. Therefore, requires extraction of lots of blood, followed by centrifugation of the venous blood to separate plasma sample from them (Avataneo et al., 2019). This is not only time consuming but also increases unnecessary visits to phlebotomist.
The first reported case of using filter paper in the year 1963 by a group of researchers in Canada, where neonatal sample was collected by pricking finger and collecting it by blotting it on a filter paper for the detection of phenylketonuria in neonates (Guthrie and Susi, 1963) laying a strong foundation for dry blood spot collection method and its processing. This technique has been extensively studied in the last few decades (Figure. 1).
Dried blood spot (DBS) alleviates the amount of blood collected, therefore, easing the procedure as well as reducing pain due to invasive procedure of venous blood harvesting. Patients suffering from delirium as well as patients suffering from severe case of Trypanophobia could benefit from such simple minimal invasive technique.
DBS/dried plasma spot (DPS) requires patients to prick their finger with a sterile and disinfected lancet and spot the blood on an encircled area in a filter paper. This filter paper is dried at the room temperature. This is follows by packing them in a plastic pouch and is transported to laboratories for its studies. Once it reaches the laboratories, appropriate extraction/pre-validated extraction procedure is performed on the DBS is done to monitor drug concentration (Ates et al., 2020). It is a very convenient way of collection of samples which requires little to no expertise in the field of sample collection. The samples can be provided by patients without assistance.
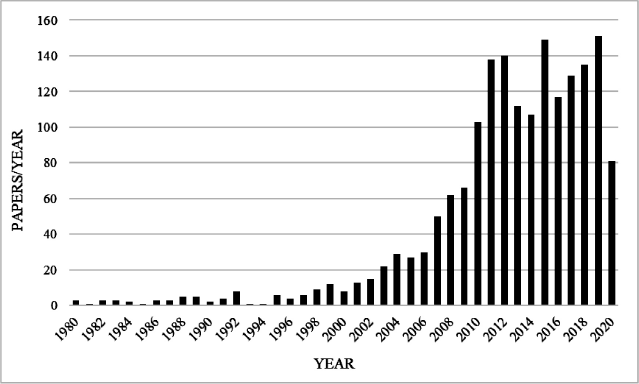 | Figure 1. Number of paper published per year based on DBS/DPS in the last few years. [Click here to view] |
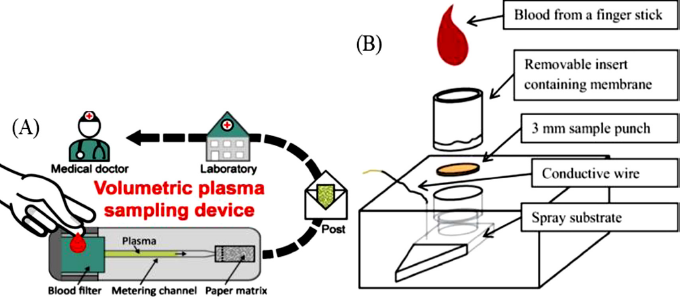 | Figure 2. Plasma filtration methods. (A) Volumetric plasma extraction from whole blood (Hauser et al., 2019). (B) Blood fractionation cartridge with paper spray isonization set up (Bills et al., 2016) [Click here to view] |
Collection of plasma sample, however, involves centrifuging the DBS as soon as it is spotted. To avoid such inconvenience, many researchers have reported method which incorporate an inbuilt plasma filtration setup. One such example is a membrane substrate DPS card is developed and reported by Sturm et al. (2015). Another example is explained by Kim et al. (2013). The filtration-based membrane stacked set up to filter RBCs from the blood spot on the top layer followed by collection of plasma that is produced post filtration in the bottom layer (Kim et al., (2013).
Many other plasma separation microfluidic devices are also developed which are capable of separating required volume of plasma from the blood. One such device is reported by Hauser et al. (2019). This device was capable of having an input volume (40–80 μl), and separate plasma from them with varying hematocrit levels ranging from 39% to 45%. They further tested their device by detecting plasma level of caffeine. Another example of separation of plasma from whole blood was reported by Bills and Manicke (2016). This paper reported the use of fractional separation principle for the separation of plasma from the blood (Figure. 2).
Basic Protocol of DBS/DPS
The most widely used extraction method for the extraction of the drug from the DBS/DPS is by protein precipitation method. This involves cutting out the spot and placing them in a vial. This is followed by addition of either methanol or acetonitrile as a precipitating agent. Pre-treatment/rehydration of the sample is usually not required.
As a part of pre-treatment, the spot is allowed to incubate in the precipitating agent. Then the sample is vortexed and centrifuged to separated filter paper fibers and possible endogenous substances from the sample. The supernatant is transferred and loaded to liquid chromatography/tandem mass spectrometry (LC-MS/MS) system for its detection. Modification in conventional protein precipitations is also employed to increase the recovery. Some of the modifications used include use of combination of protein precipitation and liquid-liquid extraction (LLE), microwave assisted protein precipitation, and ultrasound assisted protein precipitation to name few.
However, other conventional sample preparation methods such as LLE and solid phase extraction (SPE) are also employed but protein precipitation technique is preferred due to the ease of the method. Alternatively, modern sampling method include Automated Flow-through Spot Elution and On-line SPE, PPT-automated and the use of fully automated DBS-MS 500 system CAMAG.
Key Factors in LC-MS/MS Method Development Using DBS and DPS
Various factors have to be optimized in order to develop a method of detection using DBS/DPS. The factors include hematocrit effect, type of filter paper/DBS card, spot volume, carry over/Matric effect, correlation of DBS/DPS and plasma/Circulating Blood Concentrations of drug under study, storage conditions, and sample preparation.
Type of filter paper
The thickness, density, nature of the filter paper (amount of cellulose content), and processing chemicals (presence of proteinase or other interfering content) can affect the extraction efficiency or the recovery of the drug from the spot (Cho et al., 2019). Some of the filter papers employed include Whatman-Protein Saver cards, Whatman 903, Ahlstrom 226, Whatman FTA drug metabolism pharmacokinetic (DMPK)-A/DMPK-B/DMPK-C, Whatman 31 ET CHR, Whatman 3, and Agilent Bond Elut DMS.
Each filter paper has specific properties. DMPK A and DMPK B have been treated with proteinases and result in denaturation of proteins as soon as blood is in contact with them. They are often used to denature proteins and lyse cells in the blood sample of plasma sample (Wilhelm et al., 2014). They are also used for micro sampling and pharmacokinetic (PK) studies. On the other hand, DMPK C filter paper is not treated with any chemicals hence have pure cellulose. DMPK C cards have been widely used for bioanalysis studies (Luckwell et al., 2014). However, Whatman 903 and Ahlstrom 226 have been widely employed for blood sample collection. Whatman 903 and Ahlstrom 226 have been recommended by US Food and Drug Administration as medical devices which can be used for collection of blood samples.
Due to the different properties of each paper, trials have to be taken to select the best filter paper which causes minimal effect on the recovery of the drug under the study. This ensures reliability as well as providing higher chances of increasing the recovery. Cho et al. (2019) evaluated the extraction efficiencies of trimethylamine N-oxide and eight related compounds in 903, Whatman 903 Proteinsaver card; DMPK-A, Whatman FTA DMPK-A card; DMPK-B, Whatman FTA DMPK-B card; DMPK-C, Whatman FTA DMPK-C card. They concluded that the recovery of trimethylamine N-oxide its related compounds. They reported that Whatman 903 (75.2%–92.3%), DMPK-A (65.6%–85.2%), and DMPK-C (50.3%–70.5%) showing that the difference in the properties of each filter paper greatly influence the recovery of the analyte.
Spot volume
Li et al. (2015) have studied that the spot volume greatly affects the concentration of the extracted drug from the plasma. In his studies, he studied two concentration-lower quality control and higher quality control levels of ritonavir concentration he showed that there was considerable amount of concentration variation seen post extraction in these concentration as he changed the spot volume from −10 to −30 µl (Li et al., 2015) (Figure. 3).
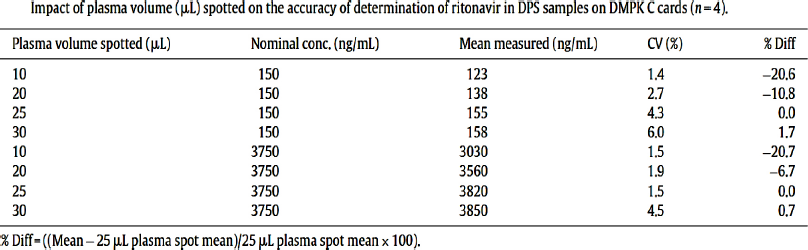 | Figure 3. Impact of plasma volume or spot volume e in drug detection and its recovery (Li et al., 2015). [Click here to view] |
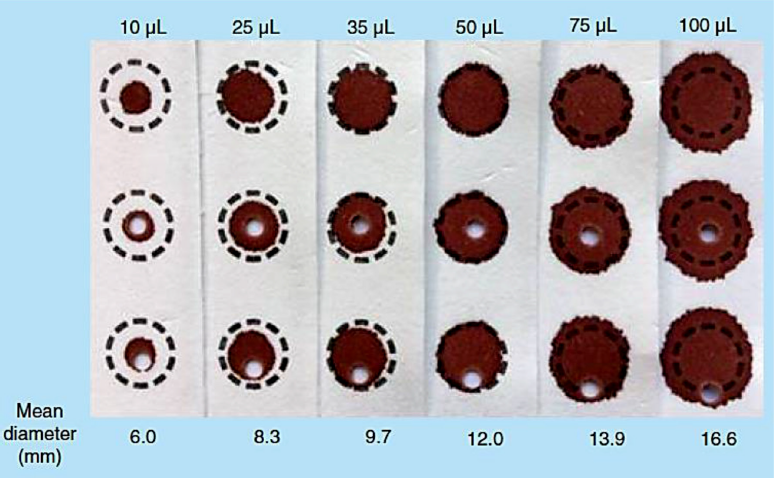
Moat et al. (2020) studied the effect of blood volume on analytical bias in DBSs where he suggested that the higher the volume of blood spotted, greater is the volume of blood collected from the spot and therefore more analyte concentration and vice versa. However, beyond a certain range, in the lower limit if the volume of blood is low, then the chances of negative bias increases. They suggest the used of spot volume in the range of 25–75 µl or a spot diameter of 7–14 mm (Moat et al., 2020).
Correlation of DPS/DBS with plasma/blood concentration level
When performing/developing a DBS assay, it is known that the low volume of blood is require which is usually acquired through picking either finger or heal (in case of neonates). It is important to take into consideration that the prick blood is usually capillary blood which is a mixture of both arterial and venous blood. There may be significant difference in drug distribution in both the system post drug treatment. Therefore, evaluating the difference in these two systems is important to relate the two studies.
The pharmacokinetics and pharmacodynamics (PK/PD) of any drugs are closely related to the bound and unbound concentration of drug present in plasma of the circulating blood; hence, it becomes imperative to understand the fraction of bound, unbound and total plasma. It is reported that the red cell membrane acts as a barrier therefor hindering the free circulation of drug in the circulatory system. The following equation represents the relation of the unbound, bound and total plasma drug concentration at equilibrium considering no drug is degraded.
In the above equation, C represents the total plasma concentration, Cu represents unbound concentration, Cb represents total blood concentration, fu is the unbound fraction, ρ is the erythrocyte to plasma concentration ratio, and H shows the hematocrit levels. Here, we can understand that the total blood concentration is directly proportional to the unbound plasma concentration when the unbound plasma fraction is constant (Londhe and Rajadhyaksha, 2020).
When drugs have low affinity to plasma proteins, the unbound fraction fu is unity. The total drug concentration in the plasma also depends on various factors such as the age of the patient, nature of the disease, condition of the patient, burns or not etc. additionally, it also varies largely between species (Rowland and Emmons, 2010).
Blood to plasma ratio is the ratio defining the concentration of drug in the plasma to the concentration of drug in the plasma and is represented as “R” (Saha et al., 2017). Other the aforementioned physical precondition of the body, another factor that influence the total plasma concentration involves the nature of the drug.
Drugs which are acidic in nature tend to be hydrophilic. These types of drugs include Doxycycline, Valproic acid, Clindamycin, Vincristine, Chlorthalidone, Ibuprofen to name a few. These drugs apart from being acidic in nature exhibit higher affinity to plasma proteins and very little toward the erythrocytes. These drugs show erythrocyte to plasma concentration ratio ρ < 1 approximately in the range of 0.55 to 0.60.
Similarly, drugs which are basic exhibit higher affinity towards erythrocyte and the amount of plasma bound proteins are less. Under such conditions, the total drug concentration is very little affected by the changes in the protein binding as majority of the drug is membrane bound.
Due to such large anomalies existing in a human body under the influence of drugs, consideration of blood to plasma concentration should be analyzed and considered while studying as well as optimizing a suitable DBS/DPS method (Rowland and Emmons., 2010).
Matrix choice
In case, the calibration curve generated during the study was prepared in blood mixed with anti-coagulant, it is necessary to conduct studies in similar matrix. When blood sample is procured from patients, it becomes necessary for the patients to provide blood mixed with anti-coagulant. This is achieved by preconditioning the DBS/DPS card with anti-coagulant. If studies have to be carried out on DBS/DPS directly (in the absence of anti-coagulant) then the calibration curve has to be prepared in blood without anticoagulant. This is not possible as studies on blood without anti-coagulant will instantly start clotting and won’t be possible to proceed further. In such circumstance, we have to consider the role of anticoagulant in the study; however, due to the limited knowledge about the interaction of drugs and anticoagulant, it becomes difficult to select correct anticoagulant and determine its volume (Capiau et al., 2019).
Storage and sample handling
DBS/DPS method involves handling small volume of blood or plasma depending on the type of study. Various factors like humidity, temperature, storage condition/refrigeration condition, and storage device can show significant variation in terms of study results. Optimization of theses parameters help increase the precision and accuracy in these studies (Capiau et al., 2019).
Matrix ageing and storage temperature are major concern when developing DBS/DPS method. Different parameters such as precision and accuracy, recovery, solution stability, drug degradation, and selectivity can vary based on the age of the matrix. Improper handling of samples can lead to oxidative degradation of drug. These are mostly is seen in aged matrix as due to degradation of drug; the recovery and selectivity can vary thereby altering these parameters drastically.
In order to reduce the impact of ageing of matrix in the detection of drugs, optimization of stability parameters such as temperature as well as long-term matrix stability have to be performed to ensure similar recovery every time the protocol is followed. Proper handling of the sample has to be ensured, especially the package and temperature restrictions have to be strictly enforced to receive the matrix which is in good shape and provides good analysis for the study (Londhe and Rajadhyaksha, 2020).
Sample preparation
One of the major roadblocks in the development of a protocol for DBS/DPS is low volume of the sample. Conventionally, sample preparation can be optimized based on the prevalent most preferred techniques such as SPE, LLE, or Protein Precipitation. However, Protein Precipitation is preferred as it is a one step process with minimal loss of sample.
Recently extraction of the sample using automated systems is gaining popularity since 2009, where implementation of robotic arm replaces conventional manual extraction processes (Demirev et al., 2013). This not only reduces manual labor but also reduces sample loss due to improper equipment handling.
Apart from selection of extraction procedure, it is important to understand whether the study will be conducted based on the spot volume or punch diameter. If study is conducted based on spot volume, then the necessary optimization as mentioned above has to be done. If not, then the punch location plays important role in the recovery of the drug from the spot. In a study conducted by Moat et al. (2020), they suggested that smaller volume resulted in spreading of the blood and therefore reducing the concentration of in the sub punch. On the contrary, when larger volume of blood (50–75 µl) is used, then it was observed that larger volume of blood was obtained in the sub punch yielding increased recovery.
Another study performed by Hall et al. (2015) suggested that the DBS diameter shows a logarithmic relationship to the total spot blood volume suggesting that the per punch blood volume increases exponentially as the diameter of the sub punch is increased (Hall et al., 2015; Moat et al., 2020).
A study reported by O’Mara et al. (2011) suggested that the location of sub punch could drastically change the accuracy of the study. Hence suggested replicating the spot location if samples have to be resampled to incur a bias ±15%. They suggested that that certain type of filter paper or with variation in the haematocrit test (HCT) level showed a phenomenon called “volcano effect” where the concentration of the drug in the peripheral is more than that in the center (O’Mara et al., 2011). Another study performed by Moat et al. (2020) also reported a similar volcano effect when they studied relation between sub punch location to recovery (Figure. 4).
Hematocrit effect
It is been known that the increase in the erythrocyte concentration increases the viscosity of the blood. This effect is referred to as “Hematocrit effect.” Due to variation in the viscosity of the blood, hematocrit effect is seen to negatively impact the precision and accuracy as well as spot area. This often leads to production of an unclear sample which can lead to unwarranted matrix effect. HCT values vary with age, precondition of the person such as anemia, severe burn, gender, living conditions, and nutrition quality. De Kesel et al. (2013) suggested that the HCT values are the highest in neonates secondly men followed by women. Lim in his review suggested that the spread of blood on any filter paper is largely influenced by the HCT level of the blood. A paper published by De Kesel et al. (2013) deeply discusses the implications of this parameter in the DBS studies.
 | Figure 4. Punch location studies performed by Moat et al. (2020). [Click here to view] |
The following as some of the impacts are related to HCT levels of blood:
Blood comprising of a higher HCT level seems to spread less, and therefore forms a small spot. Therefore, larger volumes of blood will be extracted from sub punches obtained from higher HCT sample as compared to the lower HCT sample when the diameter of the sub punches are maintained constant. This not only affects the robustness of the method but also reduces the reproducibility of the result. HCT is also an important parameter which is related to the blood to plasma ratio as mentioned above. When the HCT values increases, the blood to plasma ratio decreases considering the plasma concentration to be constant and while ignoring the effect of HCT on the spread of DBS
The HCT effect is greatly ruled by the nature of the drug. Drug which are highly attracted to the erythrocytes show more affinity toward RBCs. Therefore, under such circumstances, the HCT value becomes an influencing parameter. In order to reduce the influence of the varying HCT concentration, volumetric blood spot is required which is difficult to obtain without skillful and trained personnel especially at home without guidance. Selection of the matrix based on the property table as suggested by Rowland and Emmons (2010). Alternatively use of dried plasma could also help in alleviating the problem. However, using non cellulose based substrate or glass paper filters, alginate and chitosan foams are some of the suggested alternatives according to review report presented by Rowland and Emmons (2010) (Figure. 5).
Recent Advances of DBS and DPS
The last few years, lots of development is seen in the aspect of drug detection from DBS/DPS coupled with LC-MS/MS. The predominant method of extraction seen in these papers were protein precipitation. The modification seen with respect to the method of extraction were either evaporation post precipitation followed by reconstitution or Protein Precipitation followed by LLE.
However, use of SPE and automation has also been reported by a few. The validation of these methods has been mostly done in accordance with FDA and industrial guidelines as well as few important criteria such as hematocrit values, spot volume have also been studied as mentioned above. The recent advances in the field of DBS and DPS (combined with LC-MS/MS) in the last four years are shown in the Tables 1 and 2 respectively.
Scope of DBS/DPS
The first report of using DBS for TDM was in 1978 by Albani and Toseland (1978) for the detection of theophylline in gas chromatography. The number of assays with regards to the detection of drugs using DBS/DPS has been increasing since. Prospective groups on whom DBS/DPS is most applicable includes
Neonatal patients/infants and pediatric group
Minimal invasive technique is required when the patient is a neonate or an infant. Since conventional method of drug detection involves extraction of large amounts of blood approximately 2ml of blood per plasma-based assay, it is only convenient to extract samples via DBS/DPS. Due to ease of sample handling the loss of sample due to inefficient handling can be minimized.
Expectant mothers
Pregnant women who have risk of epilepsy, are treated with doses of antiepileptic drugs such as lamotrigine and oxcarbazepine. Close monitoring of such drugs has to be performed as altered serum levels in patients can alter the metabolism of such drugs (Wegner et al., 2010). In order to profile such drugs, spot blood method can be implemented thereby drastically reducing the amount of blood required for its detection.
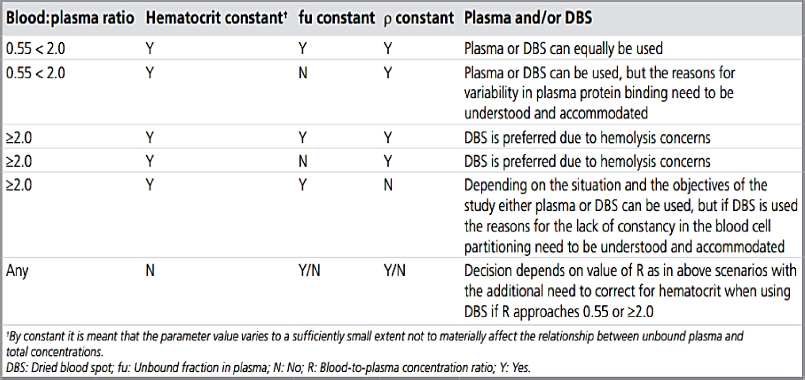 | Figure 5. Guide to decide the matrix- DPS or DBS (Rowland et al., 2010). [Click here to view] |
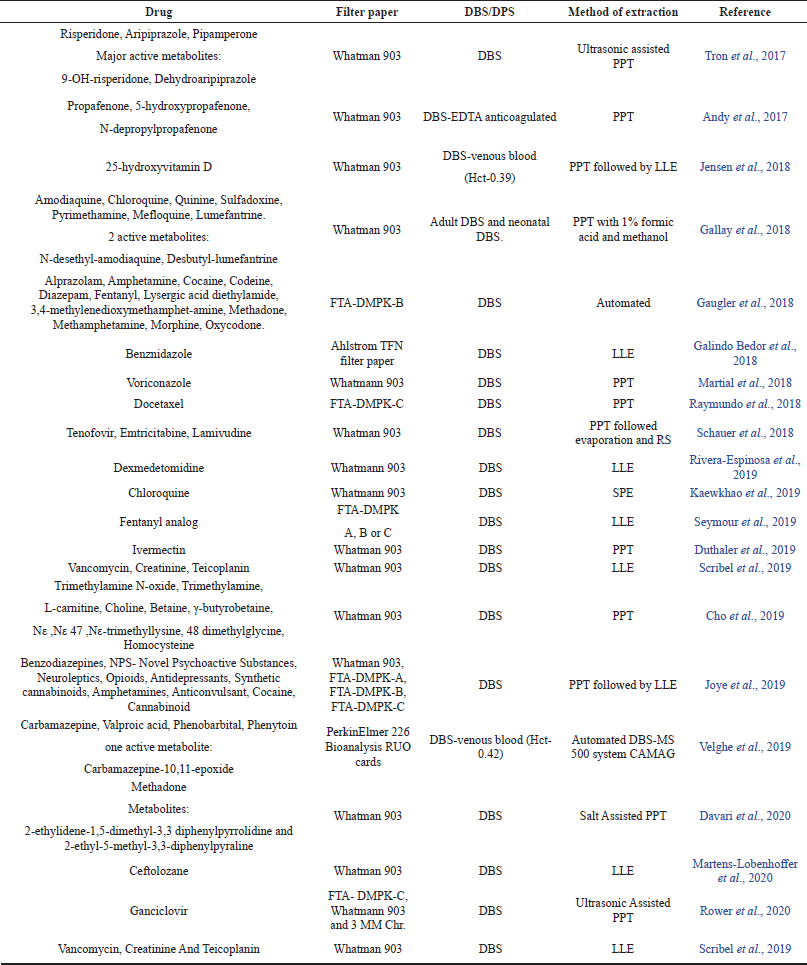 | Table 1. Recent advances in DBS in combination with LC-MS/MS. [Click here to view] |
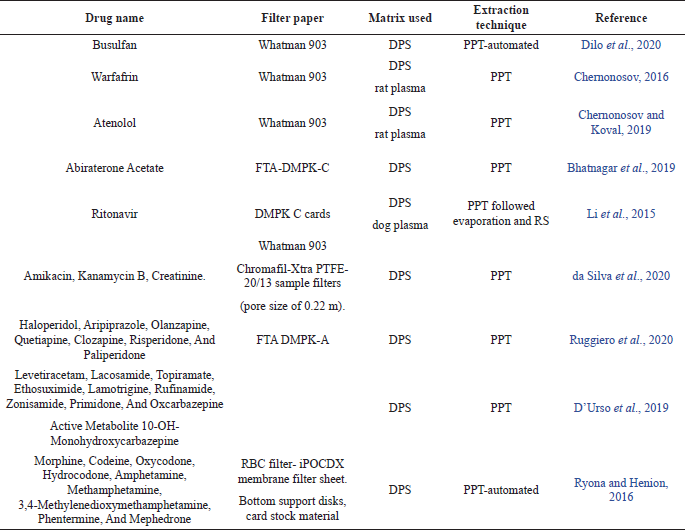 | Table 2. Recent advances in DPS in combination with LC-MS/MS. [Click here to view] |
Elderly people
Certain old age-related problems such as dementia and Alzheimer’s cannot independently access phlebotomist. Therefore, such simple method of blood sample collection could help out the care givers to collect blood samples for drug detection. People suffering from Parkinson’s disease who suffer from hand tremors and are unable to keep hand still in order to collect blood samples, as well as arthritic patient who face great difficulty in moving hand joints, could benefit from DBS/DPS.
Drug influenced anemic patient
Certain drugs cause anemia in patients. It is studied that certain medical condition also cause anemia; one such example is malarial anemia (White, 2018). Therapeutic drug monitoring in such patients is difficult as extracting large amounts of blood from these patients could adversely affect the health of the patients. DBS/DPS could be employed in such cases.
Diabetic patient
Diabetic patients visit healthcare facilities with medical conditions such as increased blood glucose levels, high blood pressure, and alteration in electrolyte level in their blood. DBS/DPS could help researchers to collect minimal amount of blood for TDM of drugs in such patients. This will not only improve their quality of life but also greatly reduce their frequency to health care facilities. One such drug—sitagliptin has been developed focusing on treating diabetes. TDM of such drugs require patient samples where DBS has been employed (Scherf-Clavel and Högger, 2015).
Pros and Cons of DBS/BPS
Pros of DBS/DPS method is
- Unlike any other method, DBS has both advantage and disadvantages (Velghe et al., 2018; Wilhelm et al., 2014). The pros of DBS are:
- Ease of sample collection. This procedure is not and extensively invasive method. Patients are required to prick and spot the blood.
- Non time consuming: Patients are not required to visit sample collection center and spend time in blood collection. This process can be done at home without the assistance of a phlebotomist.
- Ease of transportation: Blood harvested by patient’s samples are stored in vial and has to be cautiously carried to avoid spillage and contamination. Sterility has to be maintained to prevent bacterial and viral contamination. Careful monitoring of temperature has to be done. DBS surpasses all these limitation by allowing the blood to dry and can be stored in plastic pouches with no fear of cross contamination or bacterial contamination,
- Less volume is required. For monitoring of drug through conventional method requires large amounts of blood sample. With the advent of micro-sampling method, it is possible to extract drug.
- Clear sample produced after extraction from DPS. DBS however needs optimization to produce a clean sample.
Cons of DBS/DPS method is
- Sensitive detection technique is requited as the volume of sample extracted is very small.
- New sample/fresh sample is required to study each different parameter. This requires the patient to prepare the DBS/DPS every time new parameter have to be studied.
- During clinicals study of any lead drug candidate, it is required to collect sample in regular intervals. Collection of DBS/DPS under such circumstance will require patients to undergo multiple pricking session which is inconvenient.
- It is important to study the correlation of drug concentration between the venous blood and the capillary blood.
- If any study is performed wrongly or does not seem to match the validation criteria, there will not be any spare sample for repeat of the experiment.
- One of the major concerns regarding the DBS method is the impact of hematocrit values (HCT values) on the spotting size, the homogeneity and as well as will impact the study method.
- Possibility of contamination of the sample during transportation if the pack is damaged during handling.
DISCUSSION
DBS/DPS can prove to be a cost-effective sampling technique which not only encourages patients to reduce their frequency to the hospitals but also efficiently increases the quality of life. A study conducted by Martial et al. (2016, 2018) in Netherlands which is a part of the Dutch Government Funded project evaluated the variance in cost in both conventional as well as self-sampling settings.
They reported that the DBS/DPS significantly lowers the travel costs of the patients and the cost expenditure caused due to loss of productivity due to time spent at hospital, time required to sample, travel cost, and sample sending is less than 95%. They also suggested that the cost for sampling in a conventional sampling setup is significantly lowered approximately 2.5 times when in case of nephrology patients and 1.8 times in case of haemato-oncology patient when performed as dried spots. A graph chart evaluating various costs involved in both conventional sampling and self-sampling set up for nephrology patients (A) and haemato-oncology patient (B) is represented in Figureure 6A and B as explained by data reported by Martial et al. (2016).
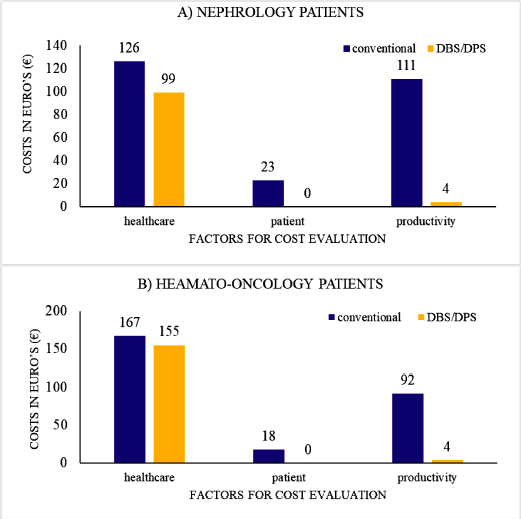 | Figure 6. (A) Cost evaluation of conventional sampling as well as self-sampling as explained by Martial et al. (2016) of nephrology patients. (B) Cost evaluation of conventional sampling as well as self-sampling as explained by Martial et al. (2016) of hemato-oncology patients. [Click here to view] |
CONCLUSION
Since the introduction of DBS/DPS in the 1960s, this sampling method has gained fame for its low volume and non-invasive technique. Several developments have been made using DBS/DPS as a sampling method coupled with other detection devices such as UV has been widely implemented such as for detection of anti-epileptic drugs- evetiracetam, lamotrigine, ethosuximide, felbamate, rufinamide, zonisamide, and monohydroxy-carbamazepine by Baldelli et al. (2015) and detection of a non-nucleoside reverse transcriptase inhibitor - Efavirenz by Hoffman et al. (2013).
The advent in terms of spot drug detection for therapeutic drug monitoring using LC-MS/MS has been gaining popularity owing to its extremely sensitive and selective method of detection. The requirement of small sample volumes and precise detection of the molecules has makes LC-MS/MS detection as a preferred choice when it comes to TDM-Therapeutic Drug Detection.
ACKNOWLEDGMENTS
The authors are thankful to Mr. Ramesh P. Ahir, Manager, and Mr. Shreyas Patel, Deputy Manager, Department of Bioanalytical, Zydus Cadila—Cadila Healthcare Limited, for their guidance and without their support this project would not have been possible.
CONFLICT OF INTEREST
There is no potential conflict of interest with this article.
AUTHOR CONTRIBUTIONS
All authors made substantial contributions to conception and design, acquisition of data, or analysis and interpretation of data; took part in drafting the article or revising it critically for important intellectual content; agreed to submit to the current journal; gave final approval of the version to be published; and agree to be accountable for all aspects of the work. All the authors are eligible to be an author as per the international committee of medical journal editors (ICMJE) requirements/guidelines.
FUNDING
There is no funding to report
ETHICAL APPROVALS
This study does not involve experiments on animals or human subjects.
DATA AVAILABILITY
All data generated and analyzed are included within this research article.
PUBLISHER’S NOTE
This journal remains neutral with regard to jurisdictional claims in published institutional affiliation.
REFERENCES
Albani M Toseland PA. Simple rapid gas-chromatography method for determination of theophylline in dried whole-blood on filter-paper cards. Neuropadiatrie, 1978; 9(1):97–9. CrossRef
Anderson NL, Polanski M, Pieper R, Gatlin T, Tirumalai RS, Conrads TP, Veenstra TD, Adkins JN, Pounds JG, Fagan R, Lobley A. The human plasma proteome: a nonredundant list developed by combination of four separate sources. Mol Cell Proteomics, 2004; 3(4):311–26. CrossRef
Andy A, Kallem RR, Mullangi R, Andy D, Seshagiri Rao JVLN. Highly sensitive UHPLC-MS/MS method for the simultaneous estimation of propafenone and its metabolites 5- hydroxypropafenone and N-depropylpropafenone on human dried blood spots technique and application to a pharmacokinetic study. J Pharm Biomed Anal, 2017; 142:328–36. CrossRef
Ates HC, Roberts JA, Lipman J, Cass AEG, Urban GA, Dincer C. On-site therapeutic drug monitoring. Trends Biotechnol, 2020; doi:10.1016/j.tibtech.2020.03.001 CrossRef
Avataneo V, D'Avolio A, Cusato J, Cantù M, De Nicolò A. LC-MS application for therapeutic drug monitoring in alternative matrices. J Pharm Biomed Anal, 2019; 166:40–51. CrossRef
Baldelli S, Cattaneo D, Giodini L, Baietto L, Di Perri G, D’Avolio A, Clementi E. Development and validation of a HPLC-UV method for the quantification of antiepileptic drugs in dried plasma spots. Clin Chem Lab Med, 2015; 53(3):435–44. CrossRef
Bhatnagar A, McKay MJ, Thaysen-Andersen M, Arasaratnam M, Crumbaker M, Gurney H, Molloy MP. Bioanalytical evaluation of dried plasma spots for monitoring of abiraterone and ?(4)-abiraterone from cancer patients. J Chromatogr B Analyt Technol Biomed Life Sci, 2019; 1126–1127:121741. CrossRef
Bills BJ, Manicke NE. Development of a prototype blood fractionation cartridge for plasma analysis by paper spray mass spectrometry. Clin Mass Spectro, 2016; 2:18–24. CrossRef
Capiau S, Veenhof H, Koster RA, Bergqvist Y, Boettcher M, Halmingh O, Keevil BG, Koch BCP, Linden R, Pistos C, Stolk LM, Touw DJ, Stove CP, Alffenaar JC. Official International Association for Therapeutic Drug Monitoring and Toxicology guideline: development and validation of dried blood spot-based methods for therapeutic drug monitoring. Ther Drug Monit, 2019; 41:409–30. CrossRef
Chernonosov A. Quantification of warfarin in dried rat plasma spots by high-performance liquid chromatography with tandem mass spectrometry. J Pharm, 2016; doi:10.1155/2016/6053295 CrossRef
Chernonosov AA, Koval VV. Extraction procedure optimization of atenolol from dried plasma spots. J Pharm Res Intern, 2019; 31(6):1–8. CrossRef
Cho HD, Kim J, Lee JY, Kim YY, Lee Y, Jo E, Suh JH, Lee J, Cha S, Han SB. A novel dried blood spots analysis combined with on-spot reaction for determination of trimethylamine N-oxide and its related compounds. Talanta, 2019; 210:120639. CrossRef
da Silva ACC, de Lima Feltraco Lizot L, Bastiani MF, Venzon Antunes M, Brucker N, Linden R. Dried plasma spots for therapeutic monitoring of amikacin: validation of an UHPLC-MS/MS assay and pharmacokinetic application. J Pharm Biomed Anal, 2020; doi:10.1016/j.jpba.2020.113201 CrossRef
Davari B, Kotecha N, Clavijo CF, Thomas JJ, Rzasa-Lynn R, Galinkin JL, Christians U, Sempio C. A Sensitive LC-MS/MS Assay for the quantification of methadone and its metabolites in dried blood spots: comparison with plasma. Ther Drug Monit, 2020; 42(1):118–28. CrossRef
De Kesel PM, Sadones N, Capiau S, Lambert WE, Stove CP. Hemato-critical issues in quantitative analysis of dried blood spots: challenges and solutions. Bioanalysis, 2013; 5:2023–41. CrossRef
Demirev PA. Dried blood spots: analysis and applications. Anal Chem, 2013; 85(2):779–89. CrossRef
Dilo A, Daali Y, Desmeules J, Chalandon Y, Uppugunduri CRS, Ansari M. Comparing dried blood spots and plasma concentrations for busulfan therapeutic drug monitoring in children. Ther Drug Monit, 2020; 42(1):111–7. CrossRef
D'Urso A, Cangemi G, Barco S, Striano P, D'Avolio A, de Grazia U. LC-MS/MS based quantification of nine antiepileptic drugs from dried sample spots device. Ther Drug Monit, 2019; 41(3):331–9. CrossRef
Duthaler U, Suenderhauf C, Gaugler S, Vetter B, Krähenbühl S, Hammann F. Development and validation of an LC-MS/MS method for the analysis of ivermectin in plasma, whole blood, and dried blood spots using a fully automatic extraction system. J Pharm Biomed Anal, 2019; 172:18–25. CrossRef
Gallay J, Prod’hom S, Mercier T, Bardinet C, Spaggiari D, Pothin E, Buclin T, Genton B, Decosterd LA. LC–MS/MS method for the simultaneous analysis of 7 antimalarials and two active metabolites in dried blood spots for applications in field trials: analytical and clinical validation. J Pharm Biomed Anal, 2018; 154:263–77. CrossRef
Galindo Bedor DC, Tavares Cavalcanti Bedor NC, Viturino da Silva JW, Damasceno Sousa G, Pereira de Santana D, Garcia-Bournissen F, Altcheh J, Blum B, Alves F, Ribeiro I. Dried blood spot technique-based liquid chromatography-tandem mass spectrometry method as a simple alternative for benznidazole pharmacokinetic assessment. Antimicrob Agents Chemother, 2018; 62(12):e00845–18. CrossRef
Gaugler S, Rykl J, Grill M, Cebolla VL. Fully automated drug screening of dried blood spots using online LC-MS/MS analysis. J Appl Bioanal, 2018; 4:7–15. CrossRef
Guthrie R, Susi A. A simple phenylalanine method for detecting phenylketonuria in large populations of newborn infants. Pediatrics, 1963; 32:338–43. CrossRef
Hauser J, Lenk G, Ullah S, Beck O, Stemme G, Roxhed N. An autonomous microfluidic device for generating volume-defined dried plasma spots. Anal Chem, 2019; 91(11):7125–30. CrossRef
Hoffman JT, Rossi SS, Espina-Quinto R, Letendre S, Capparelli EV. Determination of efavirenz in human dried blood spots by reversed-phase high-performance liquid chromatography with UV detection. Ther Drug Monit, 2013; 35(2):203–8. CrossRef
Jensen BP, Saraf R, Ma J, Berry S, Grant CC, Camargo CA Jr, Sies CW. Quantitation of 25-hydroxyvitamin D in dried blood spots by 2D LC-MS/MS without derivatization and correlation with serum in adult and pediatric studies. Clin Chim Acta, 2018; 481:61–8. CrossRef
Joye T, Sidibé J, Déglon J, Karmime A, Sporkert F, Widmer C, Favrat B, Lescuyer P, Augsburger M, Thomas A. Liquid chromatography—high resolution MS-based assay for broad-spectrum drug screening of dried blood spot as microsampling procedure. Anal Chim Acta, 2019; 1063:110–6. CrossRef
Kaewkhao K, Chotivanich K, Winterberg M, Day NP, Tarning J, Blessborn D. High sensitivity methods to quantify chloroquine and its metabolite in human blood samples using LC–MS/MS. Bioanalysis, 2019; 11(5):333–47. CrossRef
Kim JH, Woenker T, Adamec J, Regnier FE. Simple, miniaturized blood plasma extraction method. Anal Chem, 2013; 85(23):11501–8. CrossRef
Kole PL, Venkatesh G, Kotecha J, Sheshala R. Recent advances in sample preparation techniques for effective bioanalytical methods. Biomed Chromatogr, 2011; 25(1–2):199–217. CrossRef
Li W, Doherty J, Favara S, Breen C, Flarakos J, Tse FL. Evaluation of plasma microsampling for dried plasma spots (DPS) in quantitative LC-MS/MS bioanalysis using ritonavir as a model compound. J Chromatogr B Analyt Technol Biomed Life Sci, 2015; 991:46–52. CrossRef
Londhe V, Rajadhyaksha M. Opportunities and obstacles for microsampling techniques in bioanalysis: special focus on DBS and VAMS. J Pharm Biomed Anal, 2020; doi:10.1016/j.jpba.2020.113102. CrossRef
Luckwell J, Danielsson A, Johnson B, Clegg S, Green M, Pierce A. Applications and chemistry of cellulose papers for dried blood spots. In: Dried blood spots: applications and techniques, 1st edition, Wiley, 2014. CrossRef
Martens-Lobenhoffer J, Hinderhofer M, Tröger U, Bode-Böger S. Stability of ceftolozane in human plasma and dried blood spots: implications for transport and storage. J Pharm Toxicol Methods, 2020; 103:106692. CrossRef
Martial LC, Aarnoutse RE, Schreuder MF, Henriet SS, Brüggemann RJ, Joore MA. Brüggemann, Manuela A. Joore, Cost evaluation of dried blood spot home sampling as compared to conventional sampling for therapeutic drug monitoring in children. PLoS One, 2016; 11(12):e0167433. CrossRef
Martial LC, van den Hombergh E, Tump C, Halmingh O, Burger DM, van Maarseveen EM, Brüggemann RJ, Aarnoutse RE. Manual punch versus automated flow-through sample desorption for dried blood spot LC-MS/MS analysis of voriconazole. J Chromatogr B Analyt Technol Biomed Life Sci, 2018; 1089:16–23. CrossRef
Moat SJ, Dibden C, Tetlow L, Griffith C, Chilcott J, George R, Hamilton L, Wu TH, MacKenzie F, Hall SK. Effect of blood volume on analytical bias in dried blood spots prepared for newborn screening external quality assurance. Bioanalysis, 2020; 2(2):99–109. CrossRef
Navitha Reddy G, Dilip Zagade A, Sengupta P. Current direction and advances in analytical sample extraction techniques for drugs with special emphasis on bioanalysis. Bioanalysis, 2019; doi:10.4155/bio-2018-0144. CrossRef
O'Mara M, Hudson-Curtis B, Olson K, Yueh Y, Dunn J, Spooner N. The effect of hematocrit and punch location on assay bias during quantitative bioanalysis of dried blood spot samples. Bioanalysis, 2011; 3(20):2335–47. CrossRef
Ruggiero C, Ramirez S, Ramazzotti E, Mancini R, Muratori R, Raggi MA, Conti M. Multiplexed therapeutic drug monitoring of antipsychotics in dried plasma spots by LC-MS/MS. J Sep Sci, 2020; 43(8):1440–9. CrossRef
Rowland M, Emmons GT. Use of dried blood spots in drug development: pharmacokinetic considerations. AAPS J, 2010; 12(3):290–3. CrossRef
Raymundo S, Muller VV, Andriguetti NB, Tegner M, Artmann AC, Kluck HM, Franzoi MA, Vilela RMM, Schwartsmann G, Linden R, Antunes MV. Determination of docetaxel in dried blood spots by LC-MS/MS: method development, validation and clinical application. J Pharm Biomed Anal, 2018; 157:84–91. CrossRef
Rivera-Espinosa L, Toledo-López A, Chávez-Pacheco JL, Alemón-Medina R, Gómez-Garduño J, Lugo-Goytia G, García-Álvarez R, Juárez-Olguín H, Torres-Espíndola LM, Pérez-Guillé MG. Determination of blood dexmedetomidine in dried blood spots by LC-MS/MS to screen therapeutic levels in paediatric patients. PLoS One, 2019; 14(1):e0210391. CrossRef
Rower JE, Nielson C, Shi K, Park AH. Validation of an assay for quantifying ganciclovir in dried blood spots. J Pharm Biomed Anal, 2020; 184:113181. CrossRef
Ryona I, Henion J. A book-type dried plasma spot card for automated flow-through elution coupled with on-line SPE-LC-MS/MS bioanalysis of opioids and stimulants in blood. Anal Chem, 2016; 88(22):11229–37. CrossRef
Saha A, Kumar A, Gurule SJ, Khuroo A, Srivastava P. Role of RBC partitioning and whole blood to plasma ratio in bioanalysis: a case study with valacyclovir and acyclovir. Mass Spectrom Purif Tech, 2017; doi:10.4172/2469-9861.1000119 CrossRef
Schauer A. P, Sykes C, Cottrell M. L, Prince H, Kashuba ADM. Validation of an LC-MS/MS assay to simultaneously monitor the intracellular active metabolites of tenofovir, emtricitabine, and lamivudine in dried blood spots. J Pharm Biomed Anal, 2018; 149:40–5. CrossRef
Scherf-Clavel M, Högger P. Analysis of metformin, sitagliptin and creatinine in human dried blood spots. J Chromatogr B Analyt Technol Biomed Life Sci, 2015; 997:218–28. CrossRef
Scribel L, Zavascki AP, Matos D, Silveira F, Peralta T, Gonçalves Landgraf N, Lamb Wink P, Cezimbra da Silva AC, Bordin Andriguetti N, Loss Lisboa L, Venzon Antunes M, Linden R. Vancomycin and creatinine determination in dried blood spots: analytical validation and clinical assessment. J Chromatogr B Analyt Technol Biomed Life Sci, 2019; 1137:121897. CrossRef
Seymour C, Shaner RL, Feyereisen MC, Wharton RE, Kaplan P, Hamelin EI, Johnson RC. Determination of fentanyl analog exposure using dried blood spots with LC-MS-MS. J Anal Toxicol, 2019; 43(4):266–76. CrossRef
Sturm R, Henion J, Abbott R, Wang P. Novel membrane devices and their potential utility in blood sample collection prior to analysis of dried plasma spots. Bioanalysis, 2015; 7(16):1987–2002. CrossRef
Tron C, Kloosterboer SM, van der Nagel BCH, Wijma RA, Dierckx B, Dieleman GC, van Gelder T, Koch BCP. Dried blood spots combined with ultra–high-performance liquid chromatography–mass spectrometry for the quantification of the antipsychotics risperidone, aripiprazole, pipamperone, and their major metabolites. Ther Drug Monit, 2017; 39(4):429–40. CrossRef
Velghe S, Deprez S, Stove CP. Fully automated therapeutic drug monitoring of anti-epileptic drugs making use of dried blood spots. J Chromatogr A, 2019; 1601:95–103. CrossRef
Velghe S, Troyer RD, Stove C. Dried blood spots in therapeutic drug monitoring and toxicology. Expert Opin Drug Metabol Toxic, 2018; 14(1):1–3. CrossRef
Wegner I, Edelbroek P, de Haan GJ, Lindhout D, Sander JW. Drug monitoring of lamotrigine and oxcarbazepine combination during pregnancy. Epilepsia, 2010; 51:2500–2. CrossRef
White NJ. Anaemia and malaria. Malar J, 2018; 17:371. CrossRef
Wilhelm AJ, den Burge JC, Swart EL. Swart EL therapeutic drug monitoring by dried blood spot: progress to date and future directions. Clin Pharmacokinet, 2014; 53:961–973. CrossRef