INTRODUCTION
Type 2 diabetes mellitus (T2DM), a metabolic disorder, is characterized by high blood sugar (Zubair and Ahmad, 2019), which arises due to insulin insufficiency and pancreatic cell destruction (Engelmann et al., 2016; Padilha et al., 2016). T2DM is a complex disease that poses a critical health problem worldwide (Chaudhury et al., 2017; Xie and Du, 2011; Zheng et al., 2018). Impaired insulin secretion due to pancreatic beta-cell destruction and insulin resistance are the main factors in the development and pathogenesis of type 2 diabetes (Pradhan and Ridker, 2002).
The research has been conducted to indicate that inflammation is a pathogenic element in the occurrence of hyperglycemia in T2DM (Sjöholm and Nyström, 2006). The association of inflammation in diabetes is characterized by the presence of an increased level of circulatory cytokines, chemokines, and acute phase proteins (Greevenbroek et al., 2013; Herder et al., 2009; Spranger et al., 2003). Even though the magnitude of these inflammatory markers in different peripheral tissue is unclear, it is known that an increased level of these markers will activate the innate immunity in T2DM due to the overproduction of free fatty acids (Eguchi and Nagai, 2017). Various factors have been associated with an inflammatory process in diabetes which may be common or tissue-specific. The action of these inflammatory mediators that induces insulin resistance in different tissue involves many metabolic signaling pathways like IkB kinase-b and c-jun N-terminal kinase. These pathways are involved in the pathogenesis of diabetes (Shoelson, 2006) and activate nuclear factor-kB, inducing the production of cytokines like tumor necrosis factor-α (TNF-α), interleukin (IL)-6, IL-1β, and acute-phase proteins in tissues like liver and adipose and provoking insulin resistance in these tissues (Arkan et al., 2005). Cytokines such as TNF-α, IL-1β, and IL-6 play an important role in the development of T2DM. Inflammation is mainly induced by the accumulation of fatty acids in islets of the pancreas, leading to the activation of the IL system and the production of these cytokines and chemokines. Thus, it is critical to recognize the function of inflammation in the development and pathogenesis of T2DM to find a way for causative treatment. The advancement in the development of the new drug for many other diseases associated with inflammation provides a unique opportunity in the field of research that led to the expressive and fast performance of clinical trials (Coughlan et al., 2014; Donath, 2014; Dunmore and Brown, 2013; Esser et al., 2014; Tilg and Moschen, 2008). The primary purpose of diabetes treatment is to improve the quality of life and lifespan in comparison with healthy individuals, and the necessity for achieving this goal is to prevent the progression of diabetic complications (Knowler, 2005). Metformin is the first-line medication for T2DM, which controls hyperglycemia by decreasing glucose secretion from the liver and boosting insulin sensitivity (Foretz et al., 2019). Metformin activity is believed to intercede through the enactment of AMPK (Adenosine Monophosphate-activated protein kinase), a key controller of cell vitality homeostasis known to apply both antioxidant and anti-inflammatory impact (Pollack et al., 2016). The lone effect of metformin proved to have good management in control of inflammation, but it is essential to know the pooled effect of metformin on markers of inflammation in type 2 diabetes. Meta-analysis is an important technique for evaluating the comparative efficacy of different treatments. Therefore, an attempt is made to review the effect of metformin on inflammatory markers to examine the primary research and summarize the overall findings objectively. This review provides an updated view of the status of inflammatory markers in metformin-treated alone or with combination in T2DM patients. This study’s approach may validate the future implementation of drugs targeting multiple effects that immensely improve the quality of life in type 2 diabetes patients.
METHODS
We directed this meta-analysis utilizing the preferred reporting items of systematic review and meta-analysis (PRISMA) guidelines.
Search strategy
Eligible studies were searched in electronic databases such as Medline, Scopus, Web of Science, and CINAHL complete from 2000. The search terms “Metformin” AND “Inflammatory markers” OR “Inflammatory biomarkers” OR “Markers of inflammation” AND “Type 2 Diabetes Mellitus” were included to identify relevant studies. The search screening was also done using separate terms instead of inflammatory markers such as “IL-6,” “TNF-α,” and “CRP” to extract more studies. No limitations were made in the study language, and also the references of included studies were checked to prevent missing publications.
Inclusion and exclusion criteria
The inclusion criteria include all the studies that evaluated metformin’s effects on inflammatory markers in T2DM patients. The studies with Metformin and control or placebo or any other treatment or with combination treatment group were evaluated. Full-length publication studies reported with at least one biomarker outcome and published in the English language were included. The result should be reported as mean or median for inflammatory markers at pretreatment and posttreatment in both experimental and control groups. The intervention period of more than 4 weeks was only considered.
Studies were excluded if they had no comparison group, no intervention given, type 1 diabetes, and if experimental models were animals.
Data extraction and quality assessment
Data were extracted by three authors independently, and the findings were compiled. The fourth author reviewed the extracted data. Any disagreement regarding the extracted data was settled by the viewpoint of a fourth author if required. The method of data extraction was done using standard data extraction form, which included the title, name of author, publication year, study design, study duration, country, sample size, details of the intervention, any co-interventions, and outcome measure.
The quality assessment of the included studies was evaluated using the Cochrane collaboration modified tool. This tool is assessed based on randomization and allocation concealment, blinding of the participants and researchers, attrition bias, selective reporting, and other biases.
Outcome measures and data analysis
Metformin and placebo were the key groups studied to determine the precise effectiveness of metformin on inflammatory markers. The effectiveness of metformin was also compared to that of other comparator groups to see if there was a difference. Metformin’s efficacy was also tested in conjunction with other comparators to determine its efficacy both alone and in combination. The outcome measures include C-reactive protein (CRP), high sensitivity C-reactive protein (hs-CRP), TNF-α, IL-6, monocyte chemoattractant protein-1 (MCP-1), adiponectin, and intercellular adhesion molecule (ICAM-1). The pre- and post-treatment changes in the experimental and control/comparator groups were pooled to evaluate each outcome’s effects. The outcome measure was calculated as mean and standard deviation. The random-effect model was used to find the total effect which detects the variation between the studies. I² statistics was used to determine the study heterogeneity. Subgroup analyses were conducted to find the effect of different treatment modalities. The quantitative analysis of the data was done using the software Review Manager 5.2 (https://review-manager.software.informer.com/5.2/).
FINDINGS AND DISCUSSION
A total of 237 articles were obtained after the title and abstract screening from 1,510 articles filtered after duplicate removal. Subsequently, after the full-text screening of articles, 28 studies were found to be eligible for meta-analysis. The detailed procedure of study choice and screening is displayed in Figure 1. The baseline characteristic of included studies is depicted in Table 1.
Study characteristics
The research studies included in the review were published between 2000 and 2020. The study duration ranged from 4 to 52 weeks. Totally 2,975 subjects were involved in this study. The mean age in three studies (Carter et al., 2005; Chakraborty et al., 2011; Zhang et al., 2018) was not reported, in few studies, the average mean age was mentioned (Eriksson et al., 2007; Lund et al., 2008; Ragonesi et al., 2012; Schiapaccassa et al., 2019), and rest all the studies reported mean age in both groups. The eligible criteria for glycated hemoglobin are >6.5 (Eriksson et al., 2007; Hanefeld et al., 2011; Lund et al., 2008; Natali et al., 2004; Ragonesi et al., 2012; Zhang et al., 2018), >7.0 (Abdulkadir, 2012; Chakraborty et al., 2011; Derosa et al., 2008; Erem et al., 2014; Esteghamati et al., 2013; Jager et al., 2005, 2014; Mo et al., 2019; Pradhan and Ridker, 2002; Schiapaccassa et al., 2019; Tousoulis et al., 2011), >7.5 (Derosa et al., 2013) and >8.0 (Chu et al., 2002; Derosa et al., 2012; Li and Shen, 2019). The study population comprised T2DM patients with participants having several other criteria’s including overweight or obesity (Carter et al., 2005; Derosa et al., 2008, 2013; Schiapaccassa et al., 2019), with coronary artery disease (Derosa et al., 2012; Jager et al., 2005; Lund et al., 2008), newly diagnosed type 2 diabetes (Abdulkadir, 2012; Erem et al., 2014; Esteghamati et al., 2013; Li and Shen, 2019; Mo et al., 2019; Tousoulis et al., 2011; Zhang et al., 2018), hypertension (Chu et al., 2002; Jager et al., 2014; Natali et al., 2004; Ragonesi et al., 2012), female participants only(Mo et al., 2019; Schiapaccassa et al., 2019), and elderly patients above the age of 50 (Derosa et al., 2008; Kadoglou et al., 2010).
Study interventions
The different groups of interventions were used in the comparator group in different studies. The intervention groups in one study (Derosa et al., 2013) were assigned to receive metformin (dosage of 2,500 ± 500 mg) for 8 ± 2 months and then were randomly assigned, in addition to the previously determined metformin dose, 100 mg of sitagliptin in the comparator group. In contrast, the metformin group continued the predetermined dosage. The subjects in another study (Jager et al., 2005) were randomly assigned to receive either metformin or placebo in addition to the existing insulin therapy. In some of the studies (Derosa et al., 2008, 2012, 2013; Forst et al., 2012; Kadoglou et al., 2010; Tousoulis, 2019), the comparator group had a combination therapy of another drug along with metformin. In one study (Abdulkadir, 2012), the process and the dosage of interventions were not mentioned.
Risk of bias assessment
Figure 2 shows the Cochrane risk of bias in these randomized clinical trial studies. We assessed the overall quality of 28 studies. Two of the included studies did not state the random sequence generation, and four studies did not mention group allocation concealment. The performance and detection criteria had a high risk of bias for most of the studies, as clarity for blinding of participants in seventeen studies and blinding of outcome assessment in 20 studies is not clear. Twenty-six studies described the clear outcome and reporting data. Four articles were evaluated as high risk due to the poor quality of study design.
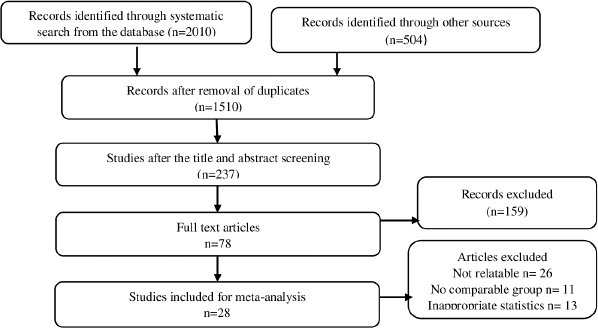 | Figure 1. PRISMA stream chart for study choice. [Click here to view] |
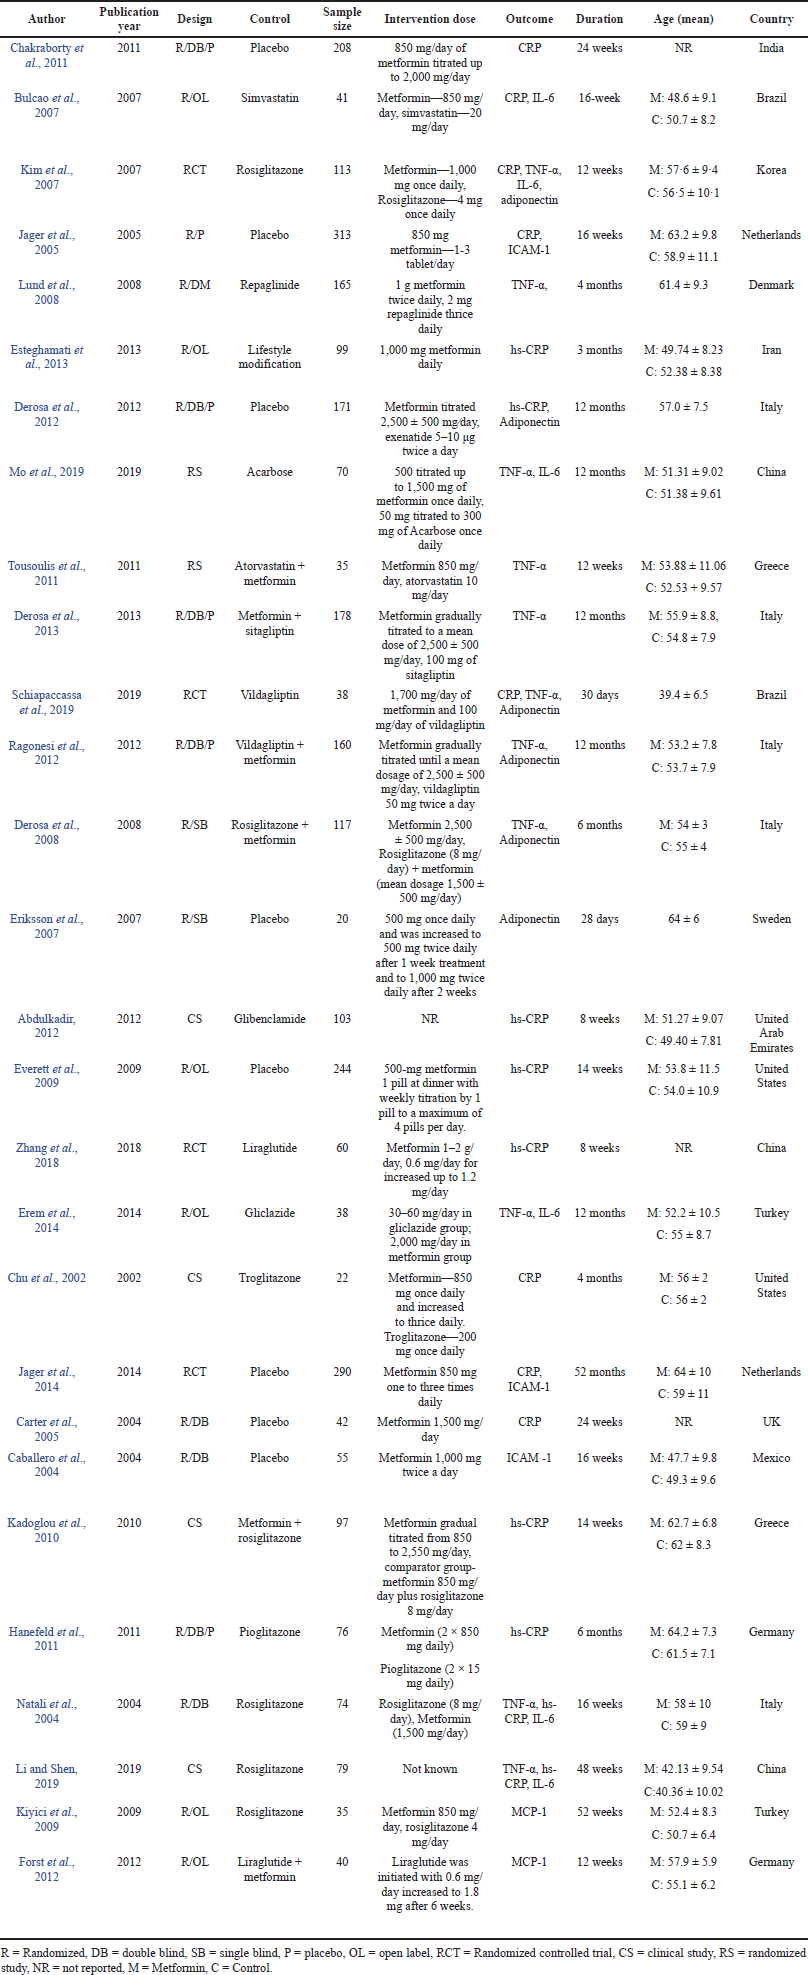 | Table 1. Baseline qualities of eligible studies. [Click here to view] |
Meta-analysis
The meta-analysis of sub-group based on intervention was conducted to determine the disparities in the studies.
C-reactive protein
A total of eight studies were analyzed for CRP as shown in Figure 3. There was no significant effect overall (SMD = −0.20, 95% CI = −0.72 to 0.31, p = 0.44, n = 1,167) but the four studies for the effect of metformin on CRP in metformin and placebo group proved to be significant (SMD = −0.73, 95% CI = −1.43 to −0.04, p = 0.04, n = 953), whereas the other four studies in metformin in comparison to the other comparator group did not show any significance (SMD = 0.40, 95% CI = −0.05 to 0.86, p = 0.08, n = 214).
High sensitivity C-reactive protein
Figure 4 depicts meta-analysis of hs-CRP. Four studies in comparison of metformin with placebo reported significance effect (SMD = −0.31, 95% CI = −0.60 to −0.01, p = 0.04, n = 560), and also hs-CRP showed significant effect (SMD = 0.27, 95% CI = 0.00 to 0.54, p = 0.05, n = 467) in metformin and comparator group in six studies. The overall effect showed to be non-significant (SMD = −0.03, 95% CI = −0.24 to 0.30, p = 0.84, n = 1,027).
Tumor necrosis factor-α
A total of 11 studies were analyzed to study the effect of metformin intervention on TNF-α in Figure 5, and the pooled effect proved to be non-significant (SMD = −0.01, 95% CI = −0.41 to 0.39, p = 0.96, n = 1,045). No significant effect was achieved in metformin and comparator group (SMD = −0.16, 95% CI = −0.55 to 0.22, p = 0.40, n = 590) for eight studies as well as in metformin and combination therapy group (SMD = 0.42, 95% CI = −0.61 to 1.45, p = 0.42, n = 455) for three studies.
Interleukin-6
A significant difference was observed among six studies for IL-6 in metformin and comparator group (SMD = 0.37, 95% CI = 0.17 to 0.57, p = 0.0004, n = 393) as shown in Figure 6 favoring comparator group.
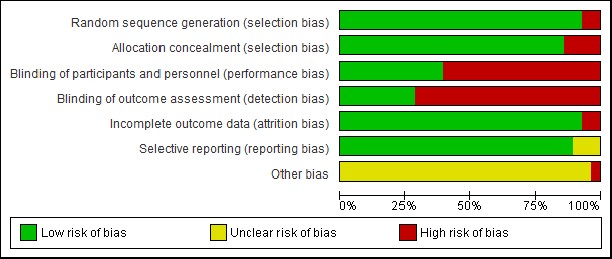 | Figure 2. Quality evaluation of the studies contained in the meta-analysis. Risk of bias graph for the studies (above) and lanes (below). [Click here to view] |
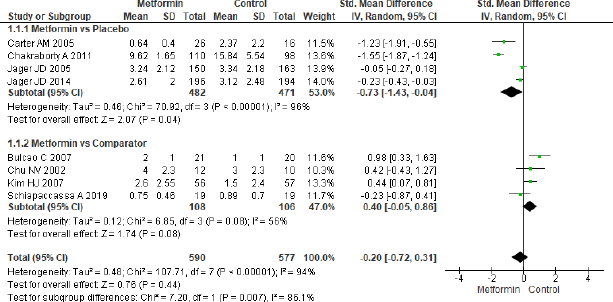 | Figure 3. Forest plots for CRP level in comparison with metformin and control group in T2DM. [Click here to view] |
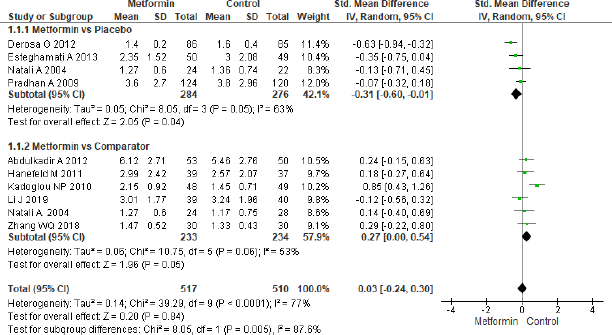 | Figure 4. Forest plots for hs-CRP level in comparison with metformin and control group in T2DM. [Click here to view] |
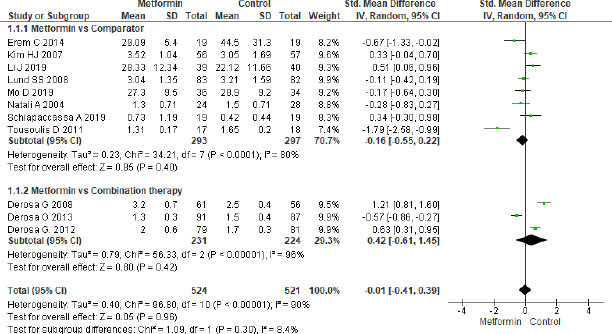 | Figure 5. Forest plots for TNF-α level in metformin and control group. [Click here to view] |
Monocyte chemoattractant protein-1
Only two studies were eligible for meta-analysis of MCP-1 which showed to be non-significant (SMD = −0.44, 95% CI = −0.90 to 0.02, p = 0.06, n = 75) in metformin and combination treatment group as shown in Figure 7.
Intercellular adhesion molecule-1
The forest plot in Figure 8 for three studies in metformin and placebo group did not provide any significant effect (SMD = −0.12, 95% CI = −0.29 to 0.04, p = 0.14, n = 758).
Adiponectin
Six studies were analyzed to assess the effect of metformin treatment on adiponectin as shown in Figure 9 and the overall effect mentioned as statistically significant (SMD = −0.40, 95% CI = −0.56 to −0.24, p < 0.001, n = 622). The beneficial effect was found towards comparator group in three studies (SMD = −0.41, 95% CI = −0.72 to −0.11, p = 0.008, n = 174) that analyzed for metformin and comparator group, the same beneficial effect was found for combination therapy (SMD = −0.40, 95% CI = −0.59 to −0.21, p < 0.001, n = 448) when compared to metformin in another group of three studies.
 | Figure 6. Forest plots for IL-6 level in metformin and comparator group. [Click here to view] |
 | Figure 7. Forest plots for MCP-1 level in metformin versus combination treatment group. [Click here to view] |
 | Figure 8. Forest plots for ICAM-1 level in metformin and control group. [Click here to view] |
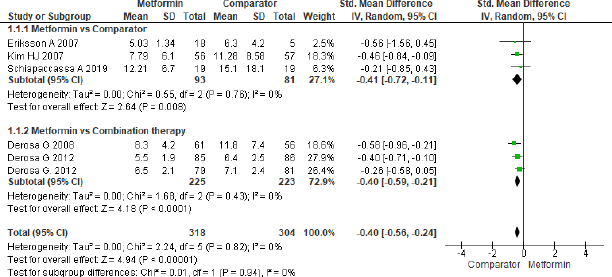 | Figure 9. Forest plots for Adiponectin level in comparison with comparator and metformin group. [Click here to view] |
Publication bias
The publication bias for this meta-analysis was assessed by performing a funnel plot for hs-CRP as a representative index for inflammatory markers. Based on the plots, there was an indication that there had been minimum publication bias in metformin effect on type 2 diabetes for hs-CRP. This was authenticated by performing Egger’s linear regression in EZR (hs-CRP: intercept: 0.18; standard error: 1.41; 95% CI: −1.30, 1.68; t = 2.75, z = −0.26, p = 0.78) (Fig. 10) (https://www.R-project.org/).
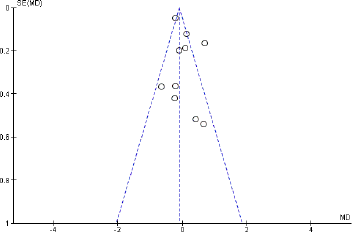 | Figure 10. Funnel plot of included articles in the meta-analysis for hs-CRP. SE: standard error, MD: mean difference. [Click here to view] |
CONCLUSION
The sub-group analysis of CRP and hs-CRP in the metformin and placebo groups showed a favorable effect for metformin. CRP in the metformin and comparator group did not show any significance whereas hs-CRP did. IL-6 and adiponectin in metformin and comparator group mentioned to be favoring comparator group and also the adiponectin levels seem to be improved in combination therapy when compared to metformin alone proving better efficacy in inflammation control. TNF-α, MCP-1, and ICAM-1 showed no improvement in the metformin group. The combination of metformin with other drugs is effective in controlling inflammation in type 2 diabetes. In this way, metformin has an advantage and can be used in tandem with other drugs in treating and management of diabetes. In the compromised studies, the span of the treatment period ranged from 4 weeks to 12 months and the metformin dose from 0.5 to 3.0 g/day. Because of the low number of the included studies, the ideal dose and the length of treatment were hard to determine.
The relation between inflammation, hyperglycemia, and complications of diabetes is well manifested now. Since low-grade inflammation is a predictor in the progression of diabetes and its complications, an increased level of CRP may be the significant risk marker in the pathogenesis of T2DM (Duncan et al., 2003). The evidence says that some metabolic factors such as hyperglycemia and free fatty acid may provoke CRP production by macrophages and endothelial cells (Mugabo et al., 2010), and increased production of CRP may be also due to increased IL-6 and TNF-α production that trigger inflammation in different tissues (Dehghan et al., 2007). Additionally, CRP has a role in impairing nitric oxide production, which leads to endothelial dysfunction (Stehouwer, 1987). IL-6 is associated with T2DM as well as impaired glucose tolerance specifying its role in the development of T2DM (Saxena et al., 2013). IL-6 has its contribution to the pathology and physiology of diabetes by its association with β-cell function and insulin-signaling pathways (Fève and Bastard, 2009), and also IL-6 triggers the CRP production (Pickup, 2004). TNF-α is a cytokine that is mainly delivered by monocytes and macrophages and has an action on insulin resistance in peripheral tissue (Ruan et al., 2002) as well as insulin secretion (Hotamisligil, 1999). Adiponectin inhibits the production and action of TNF- α, which may influence IL-6 and CRP production. Therefore, adiponectin may affect CRP levels in plasma and adipose tissue by modulating the inflammatory cascades. TNF-α development and action are inhibited by adiponectin, which can affect the production of IL-6 and CRP. As a result of inflammatory pathway modulation, adiponectin can also affect CRP levels and other inflammatory markers in plasma and adipose tissue (Schulze et al., 2004).
These inflammatory markers play a direct role in impairing insulin signaling pathways which contribute to insulin resistance in diabetes. However, the anti-inflammatory action of various medications is partial and conflicting, most likely because of deficient normalization of metabolic dysregulation or because diabetes-related aggravation is multifactorial but is not restricted to hyperglycemia. Improved diabetes prevention and treatment modalities could benefit from a greater understanding of the inflammatory basis for diabetes, which could involve innovative targeted therapies in addition to existing pharmacologic and lifestyle strategies. In this meta-analysis, metformin therapy did not show a true effect on inflammatory markers in T2DM patients. It was difficult to assess the positive effect of metformin which may be due to short treatment duration and different comparator groups. Therefore, further randomized, placebo-controlled clinical trials are required to confirm the metformin effect on inflammatory markers in T2DM patients.
Even though this systematic review gains the knowledge of metformin on inflammatory markers; it has few limitations. First, few of the trials had smaller sample sizes and shorter study duration. Second, wellbeing status, lifestyle, and essential oral anti-diabetic treatment were distinctive among the subjects and might be a significant source of heterogeneity. Third, the control group used in the review were not similar drugs which again accounts for heterogeneity. Fourth, though comprehensive information was separated for statistics investigation, studies included in this meta-analysis contained different ethnic populations and countries.
To find a more sustainable effect of metformin on inflammatory markers, future studies ought to build up a uniform assessment technique of inflammatory markers and explore the ideal dose and duration of metformin therapy along with better combination therapy in diabetes. In light of the prevalence of T2DM among Indians and the fact that metformin is the first-line therapy, it is important to control this disease effectively. This can be done by focusing on different mechanisms of metformin treatment, such as inflammatory markers in T2DM. Since inflammation is an additional risk factor in diabetes, the methodology of treatment towards this field will be gainful and accommodating in the management of T2DM.
LIST OF ABBREVIATIONS
hs-CRP, high sensitivity C-reactive protein; IL-6, interleukin-6; ICAM-1, intercellular adhesion molecule; MCP-1, monocyte chemoattractant protein-1; T2DM, type 2 diabetes mellitus; TNF-α, tumor necrosis factor-alpha.
AUTHORS CONTRIBUTION
All authors contributed to this review manuscript equally. Data were extracted and compiled with the aid of Renuka Suvarna, Revathi P. Shenoy, and M. Mukhyaprana Prabhu. Guruprasad Kalthur was able to review the extracted data and any discrepancies in the data extraction were further discussed with all the authors. Basavaraj S. Hadapad and Varashree B. S. collaborated to review the study’s methods, as well as the results and discussion of the manuscript. All the included authors of this study presented an equal contribution in data analysis and complete manuscript review.
CONFLICT OF INTEREST
The authors proclaim no conflict of interest.
FUNDING
This review does not have financial support from any source.
ETHICAL APPROVAL
Not applicable.
REFERENCES
Abdulkadir A. Comparative effects of glibenclamide and metformin on c-reactive protein and oxidant/antioxidant status in patients with type II diabetes mellitus. SQU Med J, 2012; 12:55–61. CrossRef
Arkan MC, Hevener AL, Greten FR, Maeda S, Li ZW, Long JM, Wynshaw-Boris A, Poli G, Olefsky J, Karin M. IKK-β links inflammation to obesity-induced insulin resistance. Nat Med, 2005; 11(2):191–8. CrossRef
Bulcao C, Ribeiro-Filho FF, Sanudo A, Ferreira SG. Effects of simvastatin and metformin on inflammation and insulin resistance in individuals with mild metabolic syndrome. Am J Cardiovasc Drugs, 2007; 7(3):219–24. CrossRef
Caballero AE, Delgado A, Aguilar-Salinas CA, Herrera AN, Castillo JL, Cabrera T, Gomez-Perez FJ, Rull JA. The differential effects of metformin on markers of endothelial activation and inflammation in subjects with impaired glucose tolerance: a placebo-controlled, randomized clinical trial. J Clin Endocrinol Metab, 2004; 89(8):3943–8. CrossRef
Carter AM, Bennett CE, Bostock JA, Grant PJ. Metformin reduces C–reactive protein but not complement factor C3 in overweight patients with type 2 diabetes mellitus. Diabetes Med, 2005; 22(9):1282–4. CrossRef
Chakraborty A, Chowdhury S, Bhattacharyya M. Effect of metformin on oxidative stress, nitrosative stress and inflammatory biomarkers in type 2 diabetes patients. Diabetes Res Clin Pract, 2011; 93(1):56–62. CrossRef
Chaudhury A, Duvoor C, Reddy Dendi VS, Kraleti S, Chada A, Ravilla R, Marco A, Shekhawat NS, Montales MT, Kuriakose K, Sasapu A. Clinical review of antidiabetic drugs: implications for type 2 diabetes mellitus management. Front Endocrinol, 2017; 8:6. CrossRef
Chu NV, Kong AP, Kim DD, Armstrong D, Baxi S, Deutsch R, Caulfield M, Mudaliar SR, Reitz R, Henry RR, Reaven PD. Differential effects of metformin and troglitazone on cardiovascular risk factors in patients with type 2 diabetes. Diabetes Care, 2002; 25(3):542–9. CrossRef
Coughlan KA, Valentine RJ, Ruderman NB, Saha AK. AMPK activation: a therapeutic target for type 2 diabetes? Diabetes Metab Syndr Obes, 2014; 7:241. CrossRef
Dehghan A, Van Hoek M, Sijbrands EJ, Stijnen T, Hofman A, Witteman JC. Risk of type 2 diabetes attributable to C-reactive protein and other risk factors. Diabetes Care, 2007; 30(10):2695–9. CrossRef
Derosa G, Salvadeo SA, D’Angelo A, Fogari E, Ragonesi PD, Ciccarelli L, Piccinni MN, Ferrari I, Gravina A, Maffioli P, Cicero AF. Rosiglitazone therapy improves insulin resistance parameters in overweight and obese diabetic patients intolerant to metformin. Arch Med Res, 2008; 39(4):412–9. CrossRef
Derosa G, Franzetti IG, Querci F, Carbone A, Ciccarelli L, Piccinni MN, Fogari E, Maffioli P. Exenatide plus metformin compared with metformin alone on β-cell function in patients with type 2 diabetes. Diabet Med, 2012; 29(12):1515–23. CrossRef
Derosa G, Carbone A, D’Angelo A, Querci F, Fogari E, Cicero AF, Maffioli P. Variations in inflammatory biomarkers following the addition of sitagliptin in patients with type 2 diabetes not controlled with metformin. Intern Med, 2013; 52(19):2179–87. CrossRef
Donath MY. Targeting inflammation in the treatment of type 2 diabetes: time to start. Nat Rev Drug Discov, 2014; 13(6):465–76. CrossRef
Duncan BB, Schmidt MI, Pankow JS, Ballantyne CM, Couper D, Vigo A, Hoogeveen R, Folsom AR, Heiss G. Low-grade systemic inflammation and the development of type 2 diabetes: the atherosclerosis risk in communities study. Diabetes, 2003; 52(7):1799–805. CrossRef
Dunmore SJ, Brown JE. The role of adipokines in b-cell failure of type 2 diabetes. J Endocrinol, 2013; 216(1):37–45. CrossRef
Eguchi K, Nagai R. Islet inflammation in type 2 diabetes and physiology. J Clin Invest, 2017; 127(1):14–23. CrossRef
Engelmann J, Manuwald U, Rubach C, Kugler J, Birkenfeld AL, Hanefeld M, Rothe U. Determinants of mortality in patients with type 2 diabetes: a review. Rev Endocr Metab Disord, 2016; 17(1):129–37. CrossRef
Erem C?, Ozbas HM, Nuhoglu I, Deger OR, Civan NA, Ersoz HO. Comparison of effects of gliclazide, metformin and pioglitazone monotherapies on glycemic control and cardiovascular risk factors in patients with newly diagnosed uncontrolled type 2 diabetes mellitus. Exp Clin Endocrinol Diabetes, 2014; 122(05):295–302. CrossRef
Eriksson A, Attvall S, Bonnier M, Eriksson JW, Rosander B, Karlsson FA. Short-term effects of metformin in type 2 diabetes. Diabetes Obes Metab, 2007; 9(4):483–9. CrossRef
Esser N, Legrand-Poels S, Piette J, Scheen AJ, Paquot N. Inflammation as a link between obesity, metabolic syndrome and type 2 diabetes. Diabetes Res Clin Pract, 2014; 105(2):141–50. CrossRef
Esteghamati A, Eskandari D, Mirmiranpour H, Noshad S, Mousavizadeh M, Hedayati M, Nakhjavani M. Effects of metformin on markers of oxidative stress and antioxidant reserve in patients with newly diagnosed type 2 diabetes: a randomized clinical trial. Clin Nutr, 2013; 32(2):179–85. CrossRef
Everett BM, Cook NR, Rifai N, Ridker PM. Effects of initiating insulin and metformin on glycemic control and inflammatory biomarkers among patients with type 2 diabetes: the LANCET randomized trial. JAMA, 2009; 302(11):1186–94. CrossRef
Fève B, Bastard JP. The role of interleukins in insulin resistance and type 2 diabetes mellitus. Nat Rev Endocrinol, 2009; 5(6):305–11 CrossRef
Foretz M, Guigas B, Viollet B. Understanding the glucoregulatory mechanisms of metformin in type 2 diabetes mellitus. Nat Rev Endocrinol, 2019; 15(10):569–89. CrossRef
Forst T, Michelson G, Ratter F, Weber MM, Anders S, Mitry M, Wilhelm B, Pfützner A. Addition of liraglutide in patients with type 2 diabetes well controlled on metformin monotherapy improves several markers of vascular function. Diabet Med, 2012; 29(9):1115–8. CrossRef
Greevenbroek MM, Schalkwijk CG, Stehouwer CD. Obesity-associated low-grade inflammation in type 2 diabetes mellitus: causes and consequences. Neth J Med, 2013; 71(4):174–87.
Hanefeld M, Pfützner A, Forst T, Kleine I, Fuchs W. Double-blind, randomized, multicentre, and active comparator controlled investigation of the effect of pioglitazone, metformin, and the combination of both on cardiovascular risk in patients with type 2 diabetes receiving stable basal insulin therapy: the PIOCOMB study. Cardiovasc Diabetol, 2011; 10(1):1–9. CrossRef
Herder C, Brunner EJ, Rathmann W, Strassburger K, Tabák AG, Schloot NC, Witte DR. Elevated levels of the anti-inflammatory interleukin-1 receptor antagonist precede the onset of type 2 diabetes: the Whitehall II study. Diabetes Care, 2009; 32(3):421–3. CrossRef
Hotamisligil GS. The role of TNFα and TNF receptors in obesity and insulin resistance. J Intern Med, 1999; 245(6):621–5. CrossRef
Jager DJ, Kooy A, Lehert PH, Bets D, Wulffele MG, Teerlink T, Scheffer PG, Schalkwijk CG, Donker AJ, Stehouwer CD. Effects of short-term treatment with metformin on markers of endothelial function and inflammatory activity in type 2 diabetes mellitus: a randomized, placebo-controlled trial. J Intern Med, 2005; 257(1):100–9.
Jager DJ, Kooy A, Schalkwijk C, Van Der Kolk J, Lehert P, Bets D, Wulffele MG, Donker AJ, Stehouwer CD. Long-term effects of metformin on endothelial function in type 2 diabetes: a randomized controlled trial. J Intern Med, 2014; 275(1):59–70. CrossRef
Kadoglou NP, Tsanikidis H, Kapelouzou A, Vrabas I, Vitta I, Karayannacos PE, Liapis CD, Sailer N. Effects of rosiglitazone and metformin treatment on apelin, visfatin, and ghrelin levels in patients with type 2 diabetes mellitus. Metabolism, 2010; 59(3):373–9. CrossRef
Kim HJ, Kang ES, Kim DJ, Kim SH, Ahn CW, Cha BS, Nam M, Chung CH, Lee KW, Nam CM, Lee HC. Effects of rosiglitazone and metformin on inflammatory markers and adipokines: decrease in interleukin-18 is an independent factor for the improvement of homeostasis model assessment-beta in type 2 diabetes mellitus. Clin Endocrinol, 2007; 66(2):282–9 CrossRef
Kiyici S, Ersoy C, Kaderli A, Fazlioglu M, Budak F, Duran C, Gul OO, Sigirli D, Baran I, Tuncel E, Erturk E. Effect of rosiglitazone, metformin and medical nutrition treatment on arterial stiffness, serum MMP-9 and MCP-1 levels in drug naive type 2 diabetic patients. Diabetes Res Clin Pract, 2009; 86(1):44–50. CrossRef
Knowler W. Prevention of type 2 diabetes with troglitazone in the Diabetes Prevention Program. Diabetes, 2005; 54(4):1150–6. CrossRef
Li J, Shen X. Effect of rosiglitazone on inflammatory cytokines and oxidative stress after intensive insulin therapy in patients with newly diagnosed type 2 diabetes. Diabetol Metab Syndr, 2019; 11(1):1–9. CrossRef
Lund SS, Tarnow L, Stehouwer CD, Schalkwijk CG, Teerlink T, Gram J, Winther K, Frandsen M, Smidt UM, Pedersen O, Parving HH. Impact of metformin versus repaglinide on non-glycaemic cardiovascular risk markers related to inflammation and endothelial dysfunction in non-obese patients with type 2 diabetes. Eur J Endocrinol, 2008; 158(5):631–42. CrossRef
Mo D, Liu S, Ma H, Tian H, Yu H, Zhang X, Tong N, Liao J, Ren Y. Effects of acarbose and metformin on the inflammatory state in newly diagnosed type 2 diabetes patients: a one-year randomized clinical study. Drug Des Devel Ther, 2019; 13:2769. CrossRef
Mugabo Y, Li L, Renier G. The connection between C-reactive protein (CRP) and diabetic vasculopathy. Focus on preclinical findings. Curr Diabetes Rev, 2010; 6(1):27–34. CrossRef
Natali A, Baldeweg S, Toschi E, Capaldo B, Barbaro D, Gastaldelli A, Yudkin JS, Ferrannini E. Vascular effects of improving metabolic control with metformin or rosiglitazone in type 2 diabetes. Diabetes Care, 2004; 27(6):1349–57. CrossRef
Padilha K, Venturini G, de Farias Pires T, Horimoto AR, Malagrino PA, Gois TC, Kiers B, Oliveira CM, de Oliveira Alvim R, Blatt C, Krieger JE. Serum metabolomics profile of type 2 diabetes mellitus in a Brazilian rural population. Metabolomics, 2016; 12(10):1–1. CrossRef
Pickup JC. Inflammation and activated innate immunity in the pathogenesis of type 2 diabetes. Diabetes Care, 2004; 27(3):813–23. CrossRef
Pollack RM, Donath MY, LeRoith D, Leibowitz G. Anti-inflammatory agents in the treatment of diabetes and its vascular complications. Diabetes Care, 2016; 39:S244–52. CrossRef
Pradhan AD, Ridker PM. Do atherosclerosis and type 2 diabetes share a common inflammatory basis? Eur Heart J, 2002; 23(11):831–4. CrossRef
Ragonesi P. Vildagliptin added to metformin on b -cell function after a euglycemic hyperinsulinemic and hyperglycemic clamp in type 2 diabetes patients. Diabetes Technol Ther, 2012; 14(6):475–84. CrossRef
Ruan H, Miles PD, Ladd CM, Ross K, Golub TR, Olefsky JM, Lodish HF. Profiling gene transcription in vivo reveals adipose tissue as an immediate target of tumor necrosis factor-α: implications for insulin resistance. Diabetes, 2002; 51(11):3176–88. CrossRef
Saxena M, Srivastava N, Banerjee M. Association of IL-6, TNF-α and IL-10 gene polymorphisms with type 2 diabetes mellitus. Mol Biol Rep, 2013; 40(11):6271–9. CrossRef
Schiapaccassa A, Maranhão PA, de Souza MD, Panazzolo DG, Neto JF, Bouskela E, Kraemer-Aguiar LG. 30-days effects of vildagliptin on vascular function, plasma viscosity, inflammation, oxidative stress, and intestinal peptides on drug-naïve women with diabetes and obesity: a randomized head-to-head metformin-controlled study. Diabetol Metab Syndr, 2019; 11(1):1–9. CrossRef
Schulze MB, Rimm EB, Shai I, Rifai N, Hu FB. Relationship between adiponectin and glycemic control, blood lipids, and inflammatory markers in men with type 2 diabetes. Diabetes Care, 2004; 27(7):1680–7. CrossRef
Shoelson S. Inflammation and insulin resistance find the latest version?: review series inflammation and insulin resistance. J Clin Invest, 2006; 116:1793–801. CrossRef
Sjöholm Å, Nyström T. Inflammation and the etiology of type 2 diabetes. Diabetes Metab Res Rev, 2006; 22(1):4–10. CrossRef
Spranger J, Kroke A, Möhlig M, Hoffmann K, Bergmann MM, Ristow M, Boeing H, Pfeiffer AF. Inflammatory cytokines and the risk to develop type 2 diabetes: results of the prospective population-based European Prospective Investigation into Cancer and Nutrition (EPIC)-Potsdam Study. Diabetes, 2003; 52(3):812–7. CrossRef
Stehouwer CD. Dysfunction, and chronic low-grade inflammation in diabetes. Diabetes, 1987; 51:1157–65. CrossRef
Tilg H, Moschen AR. Inflammatory mechanisms in the regulation of insulin resistance. Mol Med, 2008; 14(3):222–31. CrossRef
Tousoulis D, Koniari K, Antoniades C, Papageorgiou N, Miliou A, Noutsou M, Nikolopoulou A, Marinou K, Stefanadi E, Siasos G, Charakida M. Combined effects of atorvastatin and metformin on glucose-induced variations of inflammatory process in patients with diabetes mellitus. Int J Cardiol Cardiovasc, 2011; 149(1):46–9. CrossRef
Tousoulis D. Combined effects of atorvastatin and metformin on glucose-induced variations of inflammatory process in patients with diabetes mellitus. Int J Cardiol Cardiovasc, 2019; 149(1):46–49. CrossRef
Xie W, Du L. Diabetes is an inflammatory disease: evidence from traditional Chinese medicines. Diabetes Obes Metab, 2011; 13(4):289–301. CrossRef
Zhang WQ, Tian Y, Chen XM, Wang LF, Chen CC, Qiu CM. Liraglutide ameliorates beta-cell function, alleviates oxidative stress and inhibits low grade inflammation in young patients with new-onset type 2 diabetes. Diabetol Metab Syndr, 2018; 10(1):1–8. CrossRef
Zheng Y, Ley SH, Hu FB. Global aetiology and epidemiology of type 2 diabetes mellitus and its complications. Nat Rev Endocrinol, 2018; 14(2):88–98. CrossRef
Zubair M, Ahmad J. Role of growth factors and cytokines in diabetic foot ulcer healing: a detailed review. Rev Endocrine Metab Disord, 2019; 20(2):207–17. CrossRef