INTRODUCTION
Herbal medicine consumption was increasing due to its preventive and treatment functions. Claimed as safe, natural, and with minor adverse effects, herbal medicine has become a promising option to cure and maintain health conditions (de Carvalho Lopes and Neto, 2018; Ernst, 2002). However, there are some findings of adulterated herbal medicine purposefully mixed by synthetic drugs in the market. The adulteration of herbal medicine phenomenon is an unacceptable action to accelerate the fast and effective effect (Popescu and Radu, 2015). Analgesic drugs such as metamizole, diclofenac sodium, and prednisone were commonly found in herbal medicine to reduce pain (Sanzini et al., 2011). The improper use of non-steroidal anti-inflammation drugs and steroidal drugs could lead to undesirable adverse effects, in particular tachycardia, gastrointestinal disorder, hypertension, and hyperglycemia (Gan, 2010; Jin et al., 2018; Vijayalakshmi and Anbazhagan, 2011).
Some countries from Asia, Europe, Africa, and America had a report about adulteration herbal medicine with a synthetic drug. Indonesia is one of the countries that have a high number of reports about this unethical incident. Some irresponsible manufactured herbal medicine products such as Jamu intentionally alloyed Jamu and synthetic drugs (Ariffin et al., 2021; Cebi et al., 2017; Ching et al., 2018; Snyman et al., 2005). The most used methods to detect synthetic drugs in herbal medicine are High performance liquid chromatography (HPLC), thin layer chromatography, LC-MS, and gas chromatography-mass spectrometer (Lee et al., 2017; Mustarichie et al., 2017; Popescu and Radu, 2015; Vijayalakshmi and Anbazhagan, 2011). These techniques use separation as basic concept analysis, which requires substantial time, plenty of samples, and the destruction of samples (Cebi et al., 2017).
The studies about vibrational spectroscopic such as mid-infrared (MIR), near-infrared (NIR), and Raman as detecting techniques on adulteration herbal medicines were astonishingly successful. MIR and NIR spectroscopic are distinguished by the range location of each wavenumber. Located wavenumber at 4,000–650 cm−1 is the MIR location and at 14,400–4,000 is the NIR location. Since MIR, NIR, and Raman are included in green analytical chemistry, it means that there is reducing solvent usage and no destruction of the sample (Rohman et al., 2019). Previous studies report that vibrational spectroscopy could become a technique to control herbal medicine. The wavelength range in the MIR area exhibited the difference spectra between slimming herbal supplement and sibutramine HCl, combined with Partial Least Square Regression (PLSR); the method demonstrated a promising result in the validated test (Lu et al., 2007; Rooney et al., 2015).
Multivariate analysis, named Principal Component Analysis (PCA), Principal Component Regression (PCR), PLSR, and Discriminant Analysis (DA), could support vibrational spectroscopy data to analyze, detect, and identify synthetic drugs in herbal medicine. The benefits of multivariate analysis on processing vibrational spectroscopy data are simplicity of data interpretation and visualization, easiness of the understanding of the relationship between variables, and giving more information that is simultaneously analyzed (Irnawati et al., 2019; Rohaeti et al., 2015; Rohman et al., 2019).
This study aims for an effective, efficient, and reliable method to analyze adulterated synthetic drugs (metamizole, diclofenac sodium, and prednisone) in a herbal product by developing an analysis technique for identifying and quantifying synthetic drugs in herbal products comprehensively. The structure molecules of synthetic drugs used are shown in Figure 1. These synthetic drugs were chosen as a sample because of the National Agency of Drug and Food Control declaration about the drugs commonly found in herbal products, and metamizole, diclofenac sodium, and prednisone were listed (Sanzini et al., 2011). The samples were intentionally composed of three synthetic analgesic drugs. The combination between Fourier transform infrared-attenuated total reflection (FTIR-ATR) and chemometrics analysis, including PCA, PCR, PLSR, and DA, could classify and quantify unadulterated herbal products and synthetic drugs using calibration and validation tests.
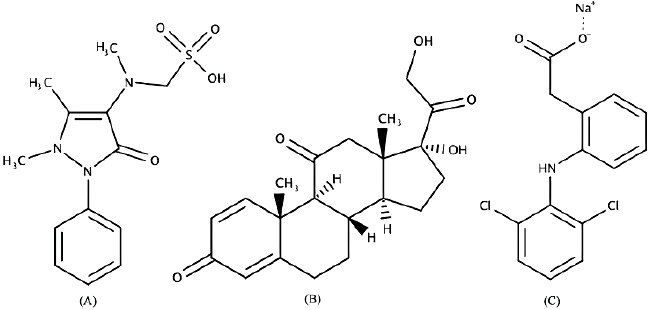 | Figure 1. Molecule structures of metamizole (A), prednisone (B), and diclofenac sodium (C). [Click here to view] |
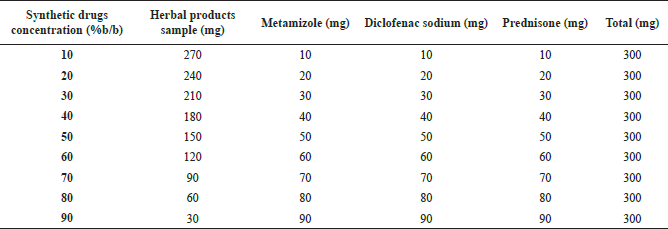 | Table 1. The design of quaternary mixture concentrations. [Click here to view] |
MATERIALS AND METHODS
Sample preparation
Metamizole, diclofenac sodium, and prednisone were granted by PT Phapros, Tbk. Three types of analgesic herbal products (Jamu Pegel Linu, Jamu Encok, and Jamu Sakit Pinggang) were purchased from one of the Indonesian traditional herbal industries. Acetone p.a. 1.0014.2500 as catalog number was obtained from Merck. The quaternary mixture was prepared by combining three synthetic drugs and each herbal product with a range of 0%–100% (wt/wt). The design of various concentrations is shown in Table 1.
FTIR-ATR spectroscopy analysis
The diamond crystal on Nicolet iS10 Spectrophotometer coupled with a detector called deuterated triglycine sulfate was cleaned first using acetone p.a. to prevent any possible noise for collecting data. Collecting background was carried out to reduce the friction between diamond and any reference spectrum in the air. The wavenumber region range for data collection was 4,000–650 using 8 cm−1 for resolution conditions and 32 scans/minute. Samples about 10 mg were located on diamond crystal ATR, and Omnic software was carried out to transform the data from spectrophotometer to spectra in absorbance. Each sample was recorded in triplicate.
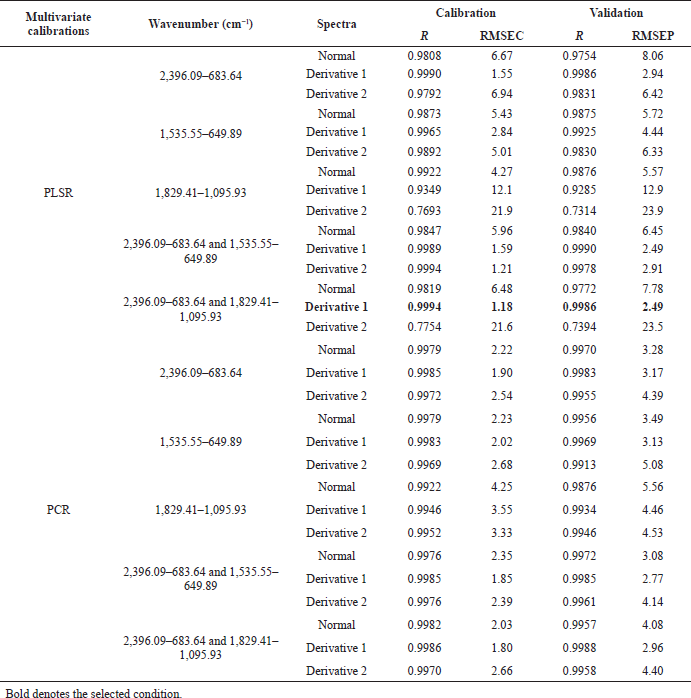 | Table 2. The performance compilation of PCR and PLSR for quantitative analysis of Jamu Pegel Linu in quaternary mixtures with drugs. [Click here to view] |
Analysis data
The obtained spectra data were further analyzed using PCA, PCR, PLSR, and DA. Minitab 18 was employed to carry out a PCA score plot. Triple quadrupole (TQ) Analyst visualised PCR, PLSR, and DA. The PCR and PLSR were carried out by comparing the value of root mean square error of calibration (RMSEC), root mean square error of prediction (RMSEP), and coefficient determination (R2). The regions shown in Tables 2, 3, and 4 were selected based on TQ Analyst software suggestion and modified further to obtain optimal conditions. The first and second derivatizations were applied for increasing the resolution of spectra.
RESULTS
Spectra data analysis of FTIR-ATR
Qualified as green analytical chemistry, FTIR-ATR spectroscopy could analyze a complex sample without any solvent used (Moros et al., 2010). The MIR region at wavenumbers 4,000–650 cm−1 presented visual spectra data containing vibrational bands of metamizole, diclofenac sodium, and prednisone. The spectrum of metamizole exhibited several strong peaks at certain wavenumbers that were 1,656, 1,625, 1,172, 1,152, and 1,047 cm−1. The appeared bands represented stretching C = O, a vibration of C = C, O = S = O stretching, CH2 out of a plane, and S = O vibration (Mohamed, 2015; Moffat et al., 2011; Silverstein et al., 1962). The MIR spectrum of diclofenac sodium delivered some unique bands at 3,253, 1,572, and 1,359 cm−1. Those arising vibrations reported the presence of −NH group, symmetric stretch of C = O, and asymmetric stretch of C = O, respectively (Bucci et al., 1998; Silverstein et al., 1962). Arising peaks of prednisone MIR spectrum at 1,706, 1,665, 1,620, 1,243, and 899 cm−1 represented functional groups, namely, C = O stretching vibration, C = C vibrations, C–O vibration, and C–H bending vibration (Chiong et al., 1992; Moffat et al., 2011; Silverstein et al., 1962). The spectra of three types of herbal products, metamizole, diclofenac sodium, prednisone, and the quaternary model are shown in Figure 2.
Qualification analysis using PCA
The application of PCA was used to discriminate the adulterated and unadulterated samples (Miller and Miller, 2010). The chosen region containing significant bands of the drugs built the PCA model. The optimum wavenumber range for PCA was 1,350–850 cm−1. The desired region was full of information about vibrations related to chemical data in samples (Angeline et al., 2019). Figure 3 shows the score plot of the model. The quaternary model of this research is located around the unadulterated samples and drugs. Three types of unadulterated samples claimed to reduce pain had similar PC1 and PC2, thus appearing contiguous. The variations of drugs (metamizole, diclofenac sodium, and prednisone) spectrum pattern produced diverse PC1 and PC2 values that came up apart. The PCA performance gave a successful result for the discrimination of the samples without any misclassification.
Multivariate analysis calibration
The performance of quantitative analysis assisted by PLSR and PCR brought the optimum prediction models to analysis drug adulterant in quaternary models. Both of these (PLSR and PCR) were exhibited by regression curve in which responses (calculated value) on the y-axis and variables (actual value) on the x-axis (Irnawati et al., 2019). The quantitative multivariate analysis calibration and validation condition of Jamu Pegel Linu in quaternary models with metamizole, diclofenac sodium, and prednisone used PLSR at wavenumbers 2,396.09–683.64 and 1,829.41–1,095.93 in first derivative mode. The powerful result was shown by the low value of RMSEC and RMSEP and the higher value of coefficient determination of each calibration and prediction (R2) (Manaf et al., 2007). The values were 1.18 and 2.49 for RMSEC and RMSEP. The R2 values were 0.9994 and 0.9986 for calibration and validation (Table 2). The regression curve is displayed in Figure 4A.
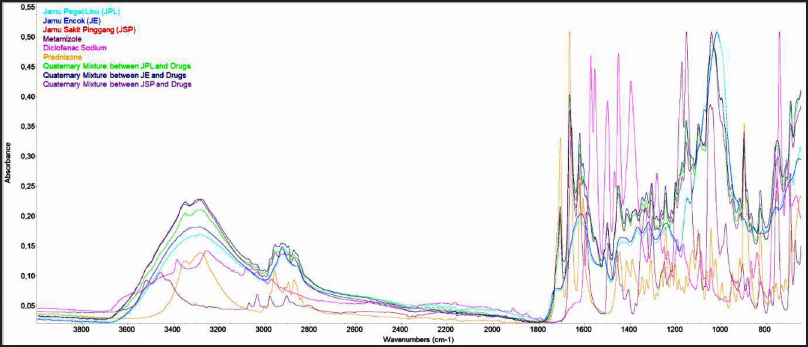 | Figure 2. FTIR spectra of three types of herbal pain products, synthetic drugs used, and quaternary mixtures. [Click here to view] |
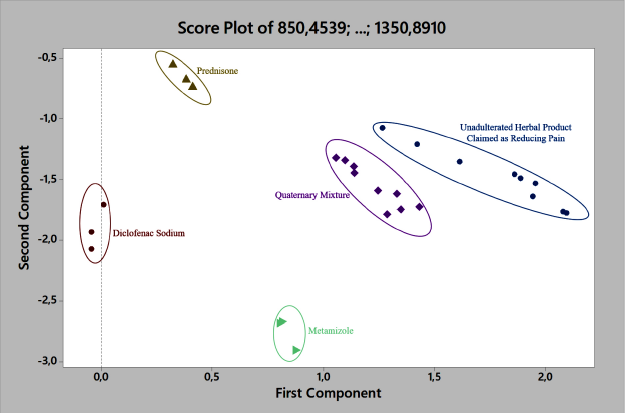 | Figure 3. The score plot result of PCA. [Click here to view] |
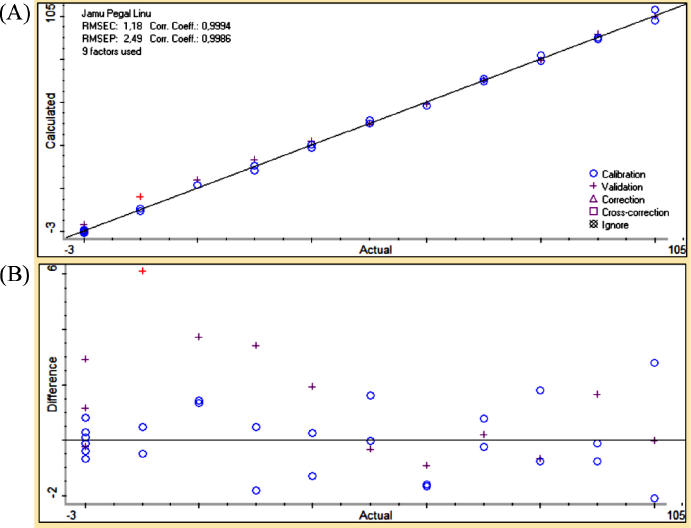 | Figure 4. The correlation curve between actual (x-axis) and predicted (y-axis) values of Jamu Pegel Linu in quaternary mixtures with drugs (A) along with residual analysis (B). [Click here to view] |
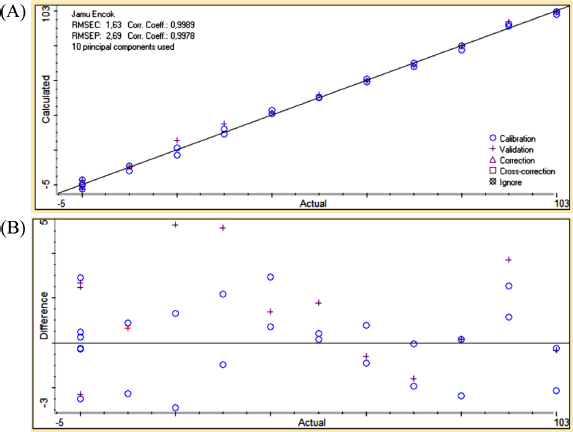 | Figure 5. The correlation curve between actual (x-axis) and predicted (y-axis) values of Jamu Encok in quaternary mixtures with drugs (A) along with residual analysis (B). [Click here to view] |
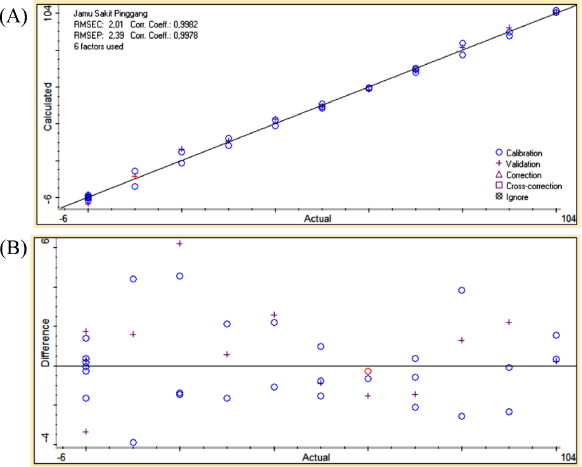 | Figure 6. The correlation curve between actual (x-axis) and predicted (y-axis) values of Jamu Sakit Pinggang in quaternary mixtures with drugs (A) along with residual analysis (B). [Click here to view] |
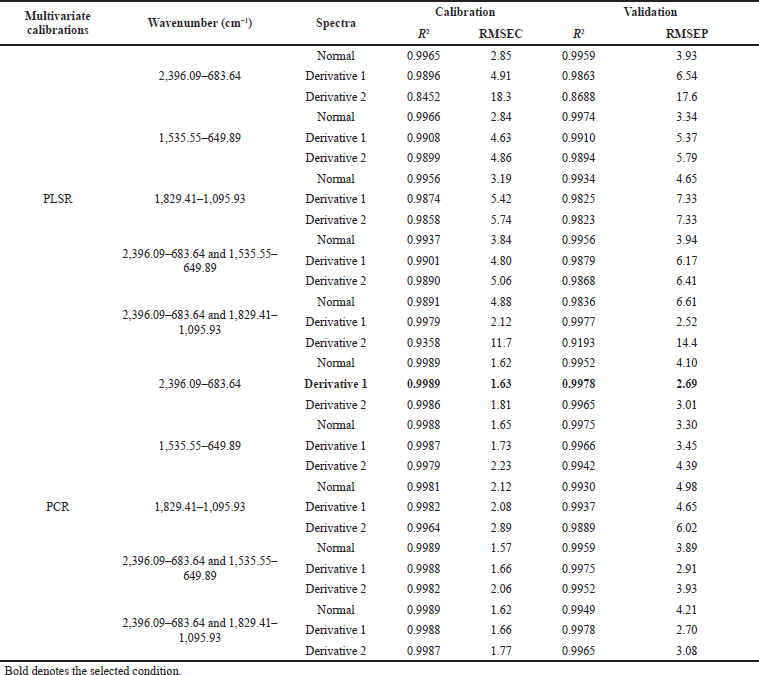 | Table 3. The performance compilation of PCR and PLSR for quantitative analysis of Jamu Encok in quaternary mixtures with drugs. [Click here to view] |
PCR at the first derivative on 2,396.09–683.64 wavenumbers on Table 3 was selected as quantitative analysis model for Jamu Encok in quaternary model with drugs based on R2 values of calibration and validation that were 0.9989 and 0.9978, followed by the values of RMSEC and RMSEP that were 1.63 and 2.69, as shown in Figure 5A. Quaternary model of Jamu Sakit Pinggang for quantitative analysis was carried out by PLSR using the first derivative at 2,396.09–683.64 and 1,535.55–649.89. The result as shown in Figure 6A gave statistical parameter values of 0.9982 and 0.9978 for R2 calibration and validation, also 2.01 for RMSEC, and 2.39 for RMSEP (Table 4). Minimum errors of calibration and prediction models with no systematic errors observed were confirmed by residual analysis in Figures 4B, 5B, and 6B (Riyanto et al., 2019).
Discriminant analysis
As supervised pattern recognition, DA is regularly applied for clustering unadulterated and adulterated samples (Rohman et al., 2014). Figure 7 showed Cooman’s plot between unadulterated herbal products and quaternary mixtures of samples using wavenumber region at 1,812.34–649.89 cm−1 and Mahalanobis distance absorbance units to calculate the distance from each group. As shown, each group was clustered entirely with a 100% accuracy level without misclassification.
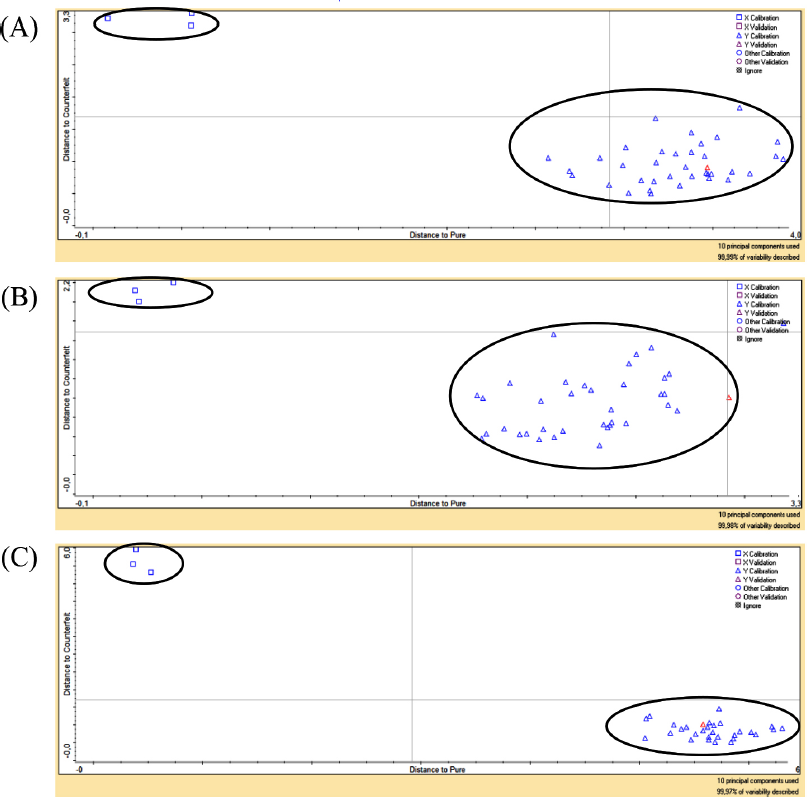 | Figure 7. The Cooman plot of samples discrimination between unadulterated herbal products (?) and quaternary mixtures of samples (?). Jamu Pegel Linu (A), Jamu Encok (B), and Jamu Sakit Pinggang (C). [Click here to view] |
DISCUSSION
This method development for combining FTIR-ATR and chemometrics led to rapid, effective, efficient, and reliable analysis for detecting unadulterated herbal products, especially when mixed with synthetic drugs. The use of ATR as a sampling technique in this research made the sample straightforwardly placed on the crystal without any preparation first. The obtained spectra from FTIR-ATR showed unique bands on every collected sample (Rohman et al., 2011). These peaks at particular wavenumber contained some critical information like functional groups, type of the functional group, and intensity. However, the data of FTIR spectroscopy alone looked arduous to analyze the adulterant in herbal products because of its limitations (Rohman et al., 2019; Popescu and Radu, 2015). Hence, we combine the valuable and robust chemometric technique to assist FTIR spectroscopy in analyzing any contaminant in herbal products.
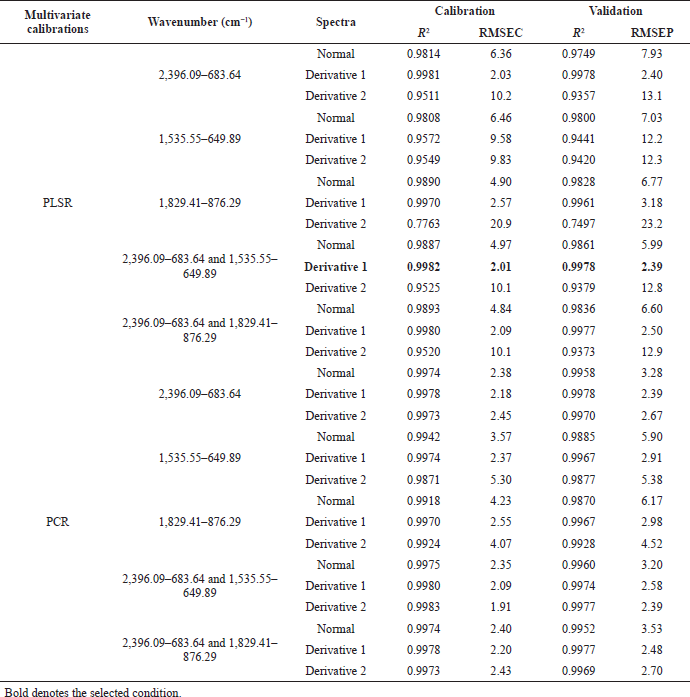 | Table 4. The performance compilation of PCR and PLSR for quantitative analysis of Jamu Sakit Pinggang in quaternary mixtures with drugs. [Click here to view] |
Regarding the score plot result, PCA, as unsupervised pattern recognition, could classify the samples by processing the data via reduction and extraction of the information on data. Afterward, the more convenient data information would become PCs score and further processed by its similarity (Miller and Miller, 2010). In the previous study, PCA could discriminate the binary mixture between herbal products and metamizole (Fatmarahmi et al., 2021). Therefore, the PCA capacity also could classify the quaternary mixtures of herbal products in this research based on the PC1 and PC2 scores.
PCR and PLSR were carried out, compared, and optimized to obtain the quantitative analysis result of samples simultaneously. Derivatization as spectral FTIR treatment could resolve the overlapping peaks limitation on FTIR spectra and yet decrease the sensitivity (Irnawati et al., 2019). The statistical parameters on this research exhibited an optimum result to build the best prediction models. Based on the value of RMSEC, RMSEP, R2, residual analysis, the developed models were accurate and precise.
The DA was included in one of the simple algorithms of supervised pattern recognition. This type of analysis could separate the pure and mixture of samples, yet any misclassification could happen. The high similarity of both samples caused the misclassification that occurred on DA (Riyanto et al., 2019; Marina et al., 2009).
CONCLUSION
Finding the highlights, the prepared quaternary models were successfully applied to predict adulterants in herbal products. As green analytical chemistry, this analytical technique did not need any preparation of the sample. Qualitative analysis using PCA and DA could classify and discriminate adulterated analgesic herbal products with synthetic drugs and unadulterated. Moreover, the performance of multivariate calibration analysis gave an optimal result according to the statistical parameter value. Therefore, FTIR-ATR coupled with PCA, PCR, PLSR, and DA fruitfully offered a potential method that is valid, efficient, effective, and reliable for herbal products quality control, especially for screening synthetic drugs adulterant in herbal products.
ACKNOWLEDGMENTS
The authors sincerely acknowledge RTA as one of UGM funding support programs No. 3143/UN1.P.III/DIT-LIT/PT/2021 and also acknowledge PT Phapros, Tbk for supplying the drugs.
CONFLICT OF INTERESTS
Dharmastuti Cahya Fatmarahmi, Ratna Asmah Susidarti, Respati Tri Swasono, and Abdul Rohman as authors declare no conflict of interest.
AUTHOR CONTRIBUTIONS
All authors made substantial contributions to conception and design, acquisition of data, or analysis and interpretation of data; took part in drafting the article or revising it critically for important intellectual content; agreed to submit to the current journal; gave final approval of the version to be published; and agree to be accountable for all aspects of the work. All the authors are eligible to be an author as per the international committee of medical journal editors (ICMJE) requirements/guidelines.
ETHICAL APPROVALS
This study does not involve experiments on animals or human subjects.
PUBLISHER’S NOTE
This journal remains neutral with regard to jurisdictional claims in published institutional affiliation.
REFERENCES
Angeline E, Susidarti RA, Rohman A. Rapid authentication of turmeric powder adulterated with Curcuma zedoaria and Curcuma xanthorrhiza using FTIR-ATR spectroscopy and chemometrics. Int J Appl Pharm, 2019; 11(5):216–21. CrossRef
Ariffin SH, A Wahab I, Hassan Y, Abd Wahab MS. Adulterated traditional-herbal medicinal products and its safety signals in Malaysia. Drug Health Patient Saf, 2021; 13:133–40. CrossRef
Bucci R, Magrì AD, Magrì AL. Determination of diclofenac salts in pharmaceutical formulations. Fresenius J Anal Chem, 1998; 362(7-8):577–82. CrossRef
Cebi N, Yilmaz MT, Sagdic O. A rapid ATR-FTIR spectroscopic method for detection of sibutramine adulteration in tea and coffee based on hierarchical cluster and principal component analyses. Food Chem, 2017; 229:517–26. CrossRef
Ching CK, Chen SPL, Lee HHC, Lam YH, Ng SW, Chen ML, Tang MHY, Chan SSS, Ng CWY, Cheung JWL, Chan TYC, Lau NKC, Chong YK, Mak TWL. Adulteration of proprietary Chinese medicines and health products with undeclared drugs: experience of a tertiary toxicology laboratory in Hong Kong. Br J Clin Pharmacol, 2018; 84(1):172–8. CrossRef
Chiong DM, Consuegra-Rodriguez E, Almirall JR. The analysis and identification of steroids. JFS, 1992; 37(2):488–502. CrossRef
de Carvalho Lopes D, Neto AJS. Classification and authentication of plants by chemometric analysis of spectral data. In: Comprehensive analytical chemistry, Elsevier, Sete Lagoas, Brazil, pp 105–25, vol. 80, 2018. CrossRef
Ernst E. Adulteration of Chinese herbal medicines with synthetic drugs: a systematic review. J Intern Med, 2002; 252(2):107–13. CrossRef
Fatmarahmi DC, Susidarti RA, Swasono RT, Rohman A. Identification and quantification of metamizole in traditional herbal medicines using spectroscopy FTIR-ATR combined with chemometrics. Res J Pharm Technol, 2021; 14(8):4413–9. CrossRef
Gan TJ. Diclofenac: an update on its mechanism of action and safety profile. Curr Med Res Opin, 2010; 26(7):1715–31. CrossRef
Irnawati, Riyanto S, Martono S, Rohman A. Determination of sesame oil, rice bran oil and pumpkin seed oil in ternary mixtures using FTIR spectroscopy and multivariate calibrations. Food Res, 2019; 4(1):135–42. CrossRef
Jin P, Liang X, Wu X, He X, Kuang Y, Hu X. Screening and quantification of 18 glucocorticoid adulterants from herbal pharmaceuticals and health foods by HPLC and confirmed by LC-Q-TOF-MS/MS. Food Addit Contam Part A Chem Anal Control Expo Risk Assess, 2018; 35(1):10–9. CrossRef
Lee KM, Jeon JY, Lee BJ, Lee H, Choi HK. Application of metabolomics to quality control of natural product derived medicines. Biomol Ther (Seoul), 2017; 25(6):559–68. CrossRef
Lu F, Li S, Le J, Chen G, Cao Y, Qi Y, Chai Y, Wu Y. A new method for testing synthetic drugs adulterated in herbal medicines based on infrared spectroscopy. Analytica Chimica Acta, 2007; 589(2):200–7. CrossRef
Manaf MA, Man YBC, Hamid NSA, Ismail A, Abidin SZ. Analysis of adulteration of virgin coconut oil by palm kernel olein using Fourier transform infrared spectroscopy. J Food Lipids, 2007; 14(2):111–21. CrossRef
Marina AM, Che Man YB, Nazimah SAH, Amin I. Monitoring the adulteration of virgin coconut oil by selected vegetable oils using differential scanning calorimetry. J Food Lipids, 2009; 16(1):50–61. CrossRef
Miller JN, Miller JC. Statistics and chemometrics for analytical chemistry. Ashford Colour Press Ltd, Gosport, UK, 2010.
Moffat AC, Osselton MD, Widdop B, Watts J. Clarke’s analysis of drugs and poisons. Pharmaceutical Press, London, UK, 2011.
Mohamed HM. Green, environment-friendly, analytical tools give insights in pharmaceuticals and cosmetics analysis. TrAC Trends Anal Chem, 2015; 66:176–92. CrossRef
Moros J, Garrigues S, de la Guardia M. Vibrational spectroscopy provides a green tool for multi-component analysis. TrAC Trends Anal Chem, 2010; 29(7):578–91. CrossRef
Mustarichie R, Ramdhani D, Indriyati W. Analysis of forbidden pharmaceutical compouinds in antirheumatic jamu. Asian J Pharm Clin Res, 2017; 10(4):98–101. CrossRef
Popescu A, Radu G. Detection of adulterants by FTIR and GC-MS in herbal slimming food supplements. UPB Sci Bull Series B Chem Mater Sci, 2015; 77(4):221–30.
Riyanto S, Martono S, Rohman A. Analysis of palm oil as oil adulterant in olive and pumpkin seed oils in ternary mixture systems using ftir spectroscopy and chemometrics. Int J Appl Pharm, 2019; 11(5):210–5. CrossRef
Rohaeti E, Rafi M, Syafitri UD, Heryanto R. Fourier transform infrared spectroscopy combined with chemometrics for discrimination of Curcuma longa, Curcuma xanthorrhiza and Zingiber cassumunar. Spectrochim Acta Part A Mol Biomol Spectr, 2015; 137:1244–9. CrossRef
Rohman A, Che Man YB, Yusof FM. The use of FTIR spectroscopy and chemometrics for rapid authentication of extra virgin olive oil. J Am Oil Chem Soc, 2014; 91(2):207–13. CrossRef
Rohman A, Che Man YB. Potential use of FTIR-ATR spectroscopic method for determination of virgin coconut oil and extra virgin olive oil in ternary mixture systems. Food Anal Methods, 2011; 4(2):155–62. CrossRef
Rohman A, Windarsih A, Hossain MAM, Johan MR, Ali ME, Fadzilah NA. Application of near- and mid-infrared spectroscopy combined with chemometrics for discrimination and authentication of herbal products: a review. J App Pharm Sci, 2019; 9(3):137–47. CrossRef
Rooney JS, McDowell A, Strachan CJ, Gordon KC. Evaluation of vibrational spectroscopic methods to identify and quantify multiple adulterants in herbal medicines. Talanta, 2015; 138:77–85. CrossRef
Sanzini E, Badea M, Dos Santos A, Restani P, Sievers H. Quality control of plant food supplements. Food Funct, 2011; 2(12):740–6. CrossRef
Silverstein RM, Bassler GC. Spectrometric identification of organic compounds. John Wiley and Sons, Inc, New York, NY, 1962. CrossRef
Snyman T, Stewart MJ, Grove A, Steenkamp V. Adulteration of south African traditional herbal remedies. Ther Drug Monitor, 2005; 27(1):86–9. CrossRef
Vijayalakshmi R, Anbazhagan S. Method development and validation for simultaneous estimation of metamizole sodium and pitofenone HCl by a stability indicating RP-HPLC. Asian J Res Chem, 2011; 4(9):1371–7.