INTRODUCTION
For patients with Parkinson’s disease, the medicine Opicapone, available under the brand name Ongentys, is commonly used combined with levodopa (Lopez et al., 2008; Scholz et al., 2011) in people with Parkinson’s disease (Barranco et al., 2009; Macleod et al., 2014). A few typical side effects include dyskinesia (Fabbrini et al., 2007; Thanvi and Robinson, 2007), constipation (Bharucha, 2007), elevated blood creatine kinase (Brewster, 2020; Moghadam et al., 2016), hypotension (Chisholm and Anpalahan, 2017; Low, 2015), and weight loss. Opicapone, which has been shown to restore dopamine (Hussain and Lokhandwala, 2003) levels in areas of the brain that control movement and coordination, does so through the inhibition of catechol-O-methyltransferase (COMT) (Bonifácio et al., 2007; Glatt et al., 2003). Levodopa can be given orally, and it has a more effective action when combined with Neurotransmitter dopamine (PEG-PEA). The enzyme COMT is involved in the breakdown of levodopa in the body, and Opicapone prevents it. Levodopa remains active for longer because of this. These measures improve Parkinson’s disease symptoms, such as stiffness and sluggishness. In patients with malignancies that emit catecholamines (Eisenhofer et al., 2004) (such as epinephrine), such as phaeochromocytoma (Hamidi et al., 2017; Tevosian and Ghayee, 2019) or paraganglioma, it is contraindicated since it hinders catecholamine breakdown as a COMT inhibitor. In addition, patients who have experienced neuroleptic malignant syndrome (NMS) (Ananth et al., 2004; Strawn et al., 2007) or non-traumatic rhabdomyolysis (Warren et al., 2002) should not use sertindole since it may create pharmacological interactions with monoamine oxidase inhibitors, which are not utilized as antiparkinsonians. The COMT inhibitors tolcapone and entacapone rarely caused NMS and concomitant rhabdomyolysis. This phenomenon generally occurs after COMT inhibitor treatment, such as when the levodopa dose is lowered or the COMT inhibitor treatment is discontinued. People who are also using non-selective monoamine oxidase inhibitors (Gillman, 2018; Stahl and Felker, 2014), or who have pheochromocytoma, paraganglioma, or other catecholamine secreting neoplasms, should avoid using Opicapone.
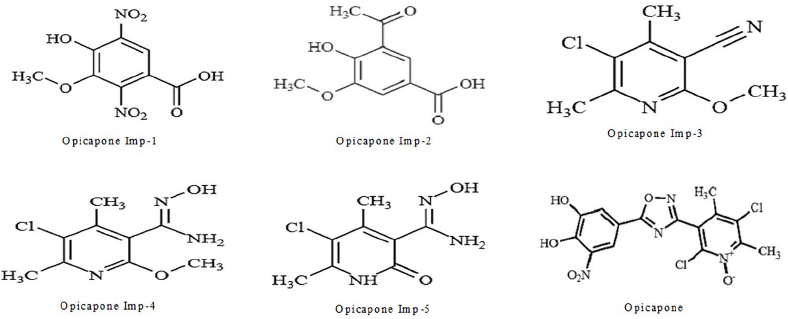 | Figure 1. Chemical representations of Opicapone and its impurities. [Click here to view] |
The research published here use High performance liquid chromatography (HPLC) to measure Opicapone and its associated contaminants. Till now, there have few HPLC reports available. But, we employed HPLC to isolate Opicapone from its contaminants. Figure 1 shows the chemical structures of Opicapone and its impurities.
EXPERIMENTAL STUDY
Chemicals and reagents
HPLC grade of triethylamine, water, and acetonitrile, all of which were acquired from Merck India Ltd in Mumbai, India, were used. The reference standards for Opicapone and its related impurities were provided by Candila health care ltd, Ahmedabad, India. A capsule dosage form of Ongentys (50 mg) was acquired from Zydus, Cadila healthcare Ltd, Ahmedabad-382210, Gujarat, India.
Instrumentation
Waters alliance liquid chromatography (model e-2695) was utilized in this investigation, with the aid of the model 2998 photo diode array detector and the Empower 2.0 data management system.
Mobile phase-A
Acetonitrile
Preparation of mobile phase-B
1 ml of triethylamine is dissolved in 1 l of HPLC grade water and filter through 0.45 μ filter paper.
Optimization of mobile phase
Different trails have conducted their experiments, with different buffers and different mobile phases being utilized in the development of the approach. No peaks have been appropriately divided in all paths. As a result of this approach, all the peaks are resolved, and the limits are fulfilled on all suitability factors.
Chromatographic conditions
The HPLC analysis was conducted on a reverse-phase HPLC system, which employed gradient elution (Table 1) with acetonitrile and 0.1% triethylamine as the mobile phase and an Agilent Eclipse C18 (150 × 4.6 mm, 3.5 μm) column. The retention time of Opicapone was observed at 13.2 minutes with a run time of 20 minutes. A wavelength of 225 nm was observed by using PDA detector.
From all the above results, it is clear that the Opicapone was separated from its five impurities with simple gradient method and having good resolution between each impurity.
The comparision between the previously published works with the current method were given in the form of a Table 2.
Green chemistry and AGREE tool
Green analytical chemistry aims to make analytical techniques less harmful to the environment and more human-friendly. The amount and toxicity of reagents used, generated waste, energy requirements, the number of procedural steps, miniaturization, and automation are just a few of the many parameters taken into account when determining the greenness of an analytical approach. The application of greenness assessment criteria necessitates the use of specialized software such as The Appraisal of Guidelines for REsearch & Evaluation (AGREE). As a result, for a thorough, adaptable, and clear assessment technique, we employed the Analytical GREEnness calculator, which offered a simply interpretable and useful result.
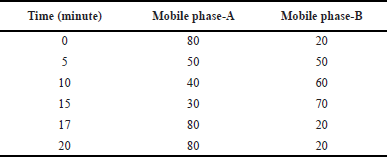 | Table 1. Gradient program. [Click here to view] |
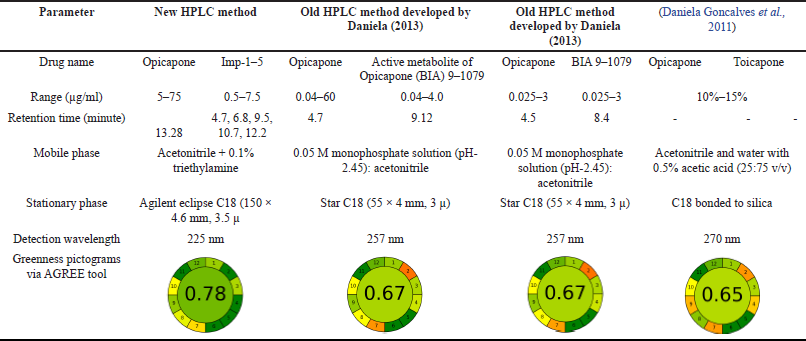 | Table 2. Comparison between new HPLC method in this paper and old methods. [Click here to view] |
Diluent
Mobile phase was used as a diluent.
Validation procedure
International Conference on Harmonization (ICH) Q2 (R1) guidelines were used to verify the performance of several analytical parameters, including system appropriateness, precision, specificity, accuracy, linearity, robustness, LOD, LOQ, forced deterioration, and stability.
Standard stock solution. Load 50 mg of Opicapone into a 100 ml volumetric flask and mix in 70 ml of sonicated diluent for 10 minutes to dissolve the contents. Then bring the total volume to the mark with more diluent.
Sample stock solution. Use 100 ml volumetric flasks with diluent to transfer 129 mg (50 mg of Opicapone) of sample. Make sure you filter the solution with a 0.45 μ nylon syringe filter.
Impurity standard stock solution. Set up a 100 ml volumetric flask, weighing 5 mg of each imp-1, imp-2, imp-3, imp-4, and imp-5 inside of it. Pour in 70 ml of solvent, then sonicate to dissolve it.
Spiked standard solution. Place 5 ml of standard stock solution into a 50-ml volumetric flask, then add 40 ml of diluent. After that, add 5 ml of impurity standard stock solution, and mix until full. Filter the sample through a 0.45 μ syringe filter.
Spiked sample solution. Transfer 5 ml of sample stock into a 50 ml volumetric flask, add 40 ml of diluent, and also add 5 ml of impurity standard stock solution and makeup to the mark with diluent. Filter through 0.45 μ syringe filter.
Results and Discussion
One of the biggest analytical difficulties in the creation of a new technique was separating active pharmaceutical components. The chromatographic conditions were altered to provide an optimal performance.
Method validation
ICH guidelines on system appropriateness, linearity, accuracy, precision, robustness, and stability were achieved by the improved RP-HPLC technique.
System suitability
To evaluate the applicability of devices, 50 μg/ml of Opicapone, 5 μg/ml each of imp-1, imp-2, imp-3, imp-4, and imp-5 were injected into six replicates of spiked standard solution. The findings reveal that the fitness parameter of the machine conforms to the limit defined by ICH. Table 3 and Figure 2 present the system precision results and standard chromatogram, respectively.
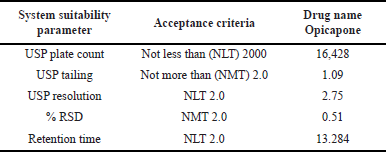 | Table 3. Results of system suitability. [Click here to view] |
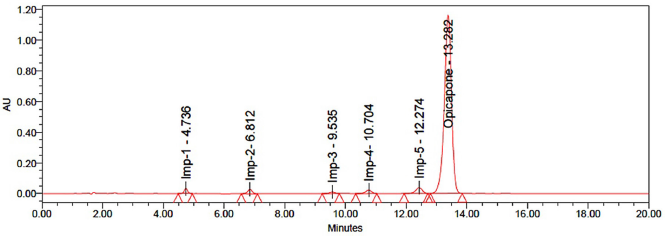 | Figure 2. Standard chromatogram. [Click here to view] |
Specificity
To test the interference, placebo solutions, samples, and standards were tested independently in this test procedure. In the diagram below, you can see that the active ingredient, its associated compounds, and excipients were clearly separated from the blank and that the placebo did not interfere with the major peak. Therefore, the process is specialized. Blank chromatogram was shown in Figure 3.
Linearity
To measure linearity, a calibration curve was created in which the peak area of each concentration was plotted against its concentration. The calibration curve between 5–75 μg/ml of Opicapone and 0.5–7.5 μg/ml of each of imp-1, imp-2, imp-3, imp-4, and imp-5 revealed that the calibration curve was linear. The regression equations for calibration curve were Y = 379,503.15x + 450,638. (R2 = 0.9992) for Opicapone, Y = 50,691.95x + 2,263.91 (R2 = 0.9993) for imp-1, Y = 54,806.35x + 907.52 (R2 = 0.9994) for imp-2, Y = 23,404.21x + 1,816.31 (R2 = 0.9995) for imp-3, and Y = 54,131.96x + 1,681.90 (R2 = 0.9999) for imp-4, Y = 114,430.96x + 6,088.62 (R2 = 0.9996) for imp-5. Table 4 provide the results of linearity testing, and Figure 4 illustrates the calibration plots of Opicapone and its related substances.
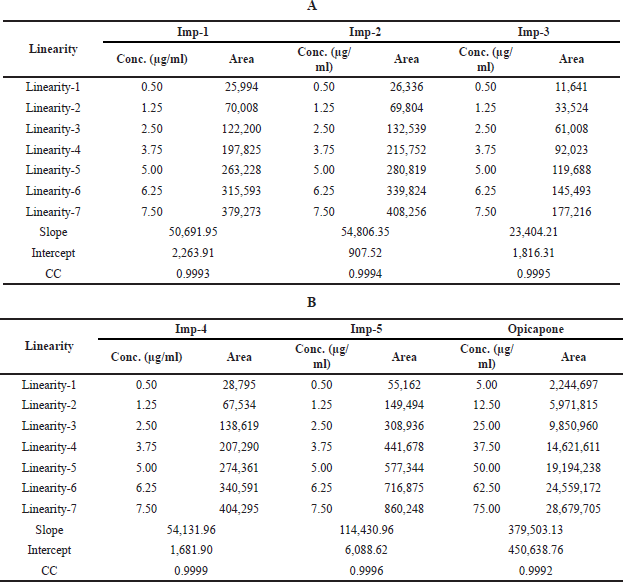 | Table 4. Linearity results of Opicapone and its impurities. [Click here to view] |
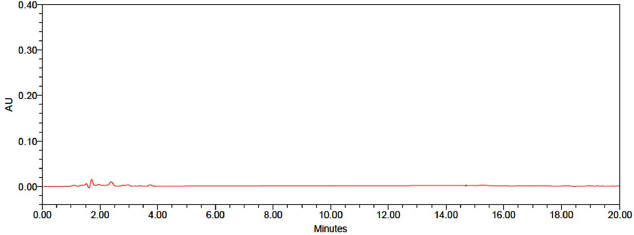 | Figure 3. Chromatogramof blank. [Click here to view] |
Accuracy
The system’s precision was gained by doing the recovery trials at three different points (50%, 100%, and 150%). Active pharmaceutical ingredient (API) stock solutions with a 25, 50, and 75 μg/ml concentration of Opicapone were developed. To administer the test for each injection step, a different test solution was injected three times and was carried out according to the defined protocol. Both the recovery results and Relative Standard Deviation (RSD) values were 100% and under ±2%, respectively. The mean and standard deviation were found for the % recovery. The results of accuracy studies are displayed in Table 5.
 | Table 5. Results of accuracy. [Click here to view] |
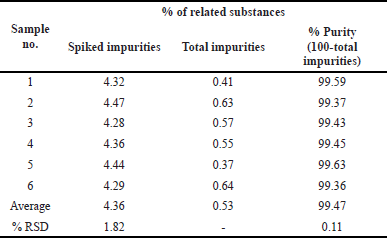 | Table 6. Intraday precision results of allantoin and permethrin. [Click here to view] |
Precision
Measurements produced from several homogeneous mixture samplings can be highly precise, depending on the degree of precision of the analytical procedure. Six measurements of Opicapone and its related compounds were injected to calculate the precision of the medication delivery procedure. Method precision results were shown in Table 6 and sample chromatogram was shown in Figure 5.
Intermediate precision
The samples were evaluated by six different researchers, using different equipment, and were tested on days that varied. It is clear that the average percentage of RSD values is estimated based on the regional maximums. The findings are shown in Table 7.
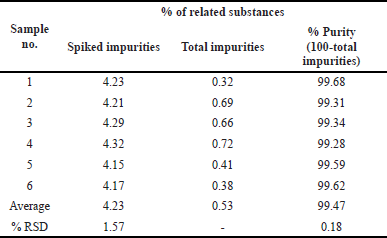 | Table 7. Inter-day precision results. [Click here to view] |
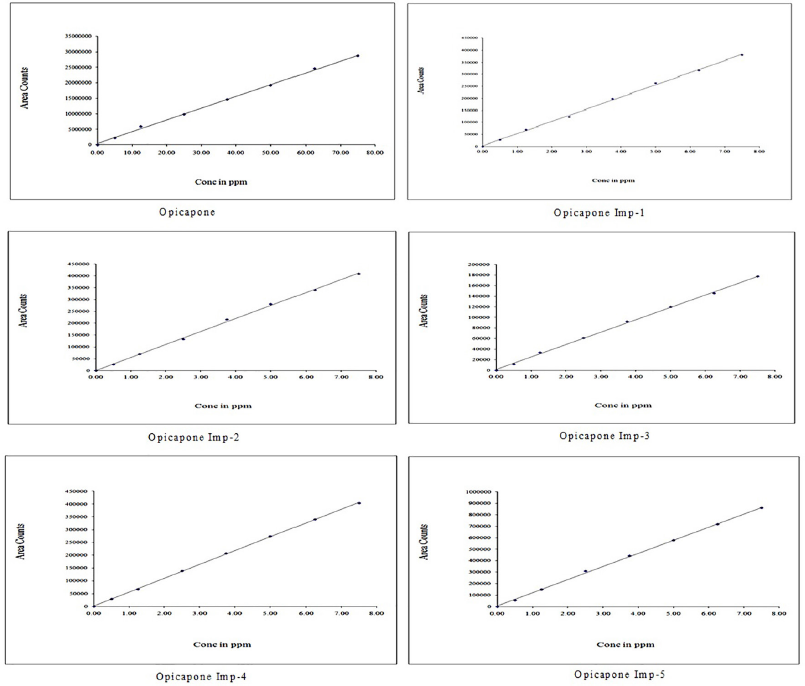 | Figure 4. Calibration plots of Opicapone and its impurities. [Click here to view] |
LOD and LOQ
The calibration curve technique was used to find LOD and LOQ independently. Using the RP-HPLC method devised for the chemical, the LOD and LOQ were evaluated by injecting a series of standard solution concentrations. The concentration levels of LOD and LOQ, as well as their respective Signal to noise ratio (s/n) values, were provided in Table 8.
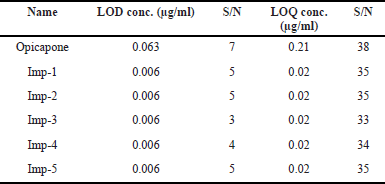 | Table 8. Results of LOD and LOQ. [Click here to view] |
Robustness
The experimental circumstances were varied to assess the robustness of variables that were modified on purpose, such as flow rate, mobile phase organic percentage, and more. As seen in Table 9, the Opicapone impurities as well as the material itself met the specifications for robustness.
Stability
At room temperature and 2°C–8°C, normal solution can be stored for up to 24 hours. The solutions were then fed into the system and the % variation was measured from the initial to 24 hours. It was confirmed that no significant variation occurred, and that the solutions were stable for up to 24 hours. The assay’s percentage did not reach 2%. There is no impact on Opicapone and its byproducts regardless of storage circumstances. The results of the stability testing were shown in Table 10.
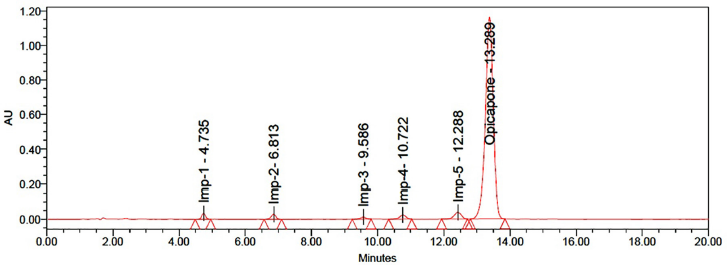 | Figure 5. Chromatogram of sample. [Click here to view] |
Degradation studies
To study the effects of partially degraded Opicapone, the chemical was exposed to a number of experimental situations. For research purposes, degradation trials were forced on material to prove that the technique was appropriate for being used in degraded goods. Another important aspect of the studies is information on the environment in which the medicine is unstable, therefore methods to reduce potential instabilities are also implemented during formulation. Degradation results were shown in Table 11.
Acid degradation. One millilitre of sample stock solution and 1 ml of impurity stock solution were transferred to a 10-ml volumetric flask, with 1 ml of 1 N HCl added and allowed to sit for 15 minutes. Make the diluent to the mark and add 1 ml of 1 N NaOH after waiting 15 minutes. Use a syringe filter to filter the solution, then inject it into the HPLC system.
 | Table 9. Robustness results. [Click here to view] |
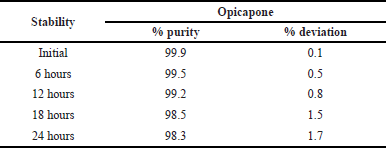 | Table 10. Stability results of Opicapone. [Click here to view] |
Alkali degradation. One millilitre of sample stock solution 1 ml of impurity stock solution were transferred to a 10-ml volumetric flask, with 1 ml of 1 N NaOH added and allowed to sit for 15 minutes. Make the diluent to the mark and add 1 ml of 1 N HCl after waiting 15 minutes. Use a syringe filter to filter the solution, then inject it into the HPLC system.
Peroxide degradation. Add 1 ml of the impurity stock solution to a 10-ml volumetric flask and transfer 1 ml of the sample stock solution to the same flask. Finally, add 1 ml of 30% hydrogen peroxide solution to the volumetric flask and then dilute to the mark with a suitable solvent. Use a syringe filter to filter the solution, then inject it into the HPLC system.
Reduction degradation. To prepare a 10 ml volumetric flask, move 1 ml of sample stock solution and 1 ml of impurity stock solution. Add 1 ml of 30% sodium bi sulphate solution and top off with diluents. Use a syringe filter to filter the solution, then inject it into the HPLC system.
Thermal degradation. The sample solution was set in an oven at 105°C for 6 hours. The resultant solution was injected into HPLC system.
Hydrolysis degradation. To prepare a 10 ml volumetric flask, move 1 ml of sample stock solution and 1 ml of impurity stock solution. Add 5 ml of HPLC water and top off with diluents. Use a syringe filter to filter the solution, then inject it into the HPLC system.
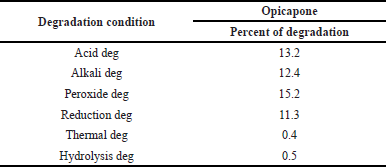 | Table 11. Forced degradation results. [Click here to view] |
CONCLUSION
A developed method gives very good results in 20 minutes, has high efficiency, and complies with the System suitability tests (SST) modifications of United States Pharmacopeia (USP) for Opicapone and its related impurities. The present work demonstrates the efficacy of the Agilent Eclipse C18 column, which provides better resolution, lower plate count, and lower tailing in elution of analytes. In contrast, because of their low tolerance to extractables, C18 columns can achieve high specificity in a shorter time when studying Opicapone per ICH Q3A (R2) guidelines. The proposed method for the simultaneous determination and quantification of Opicapone and its impurities was found to be simple, precise, accurate, linear, robust, and fast. The accuracy of the sample recovery agreed with the labelling claims, leading to the assumption of no interference during the estimation. By using AGREE metrics tool (0.78), we concluded that the method is green and used for impuirites detection.
ACKNOWLEDGEMENT
The authors are thankful to D. Ramchandran for giving his valuable guidance and suggestions and also Shree Icon Pharmaceutical Laboratories for providing laboratory facilities to finish this research work.
AUTHOR CONTRIBUTIONS
All authors made substantial contributions to conception and design, acquisition of data, or analysis and interpretation of data; took part in drafting the article or revising it critically for important intellectual content; agreed to submit to the current journal; gave final approval of the version to be published; and agree to be accountable for all aspects of the work. All the authors are eligible to be an author as per the international committee of medical journal editors (ICMJE) requirements/guidelines.
FUNDING
There is no funding to report.
CONFLICTS OF INTEREST
The authors report no financial or any other conflicts of interest in this work.
ETHICAL APPROVALS
This study does not involve experiments on animals or human subjects.
PUBLISHER’S NOTE
This journal remains neutral with regard to jurisdictional claims in published institutional affiliation.
REFERENCES
Ananth J, Parameswaran S, Gunatilake S, Burgoyne K, Sidhom T. . J Clin Psychiatry, 2004; 65(4):464–70. CrossRef
Barranco Quintana JL, Allam MF, Del Castillo AS, Navajas RF. Parkinson’s disease and tea: a quantitative review. J Am Coll Nutr, 2009; 28(1):1–6. CrossRef
Bharucha AE. Constipation. Best Pract Res Clin Gastroenterol, 2007; 21(4):709–31. CrossRef
Bonifácio MJ, Palma PN, Almeida L, Soares-da-Silva P. . CNS Drug Rev, 2007; 13(3):352–79. CrossRef
Brewster LM. . Purinergic Signal, 2020; 16(3):305–12. CrossRef
Chisholm P, Anpalahan M. Orthostatic hypotension: pathophysiology, assessment, treatment and the paradox of supine hypertension. Intern Med J, 2017; 47(4):370–9. CrossRef
Daniela Gonçalves, Gilberto Alves, Ana Fortuna et al. An HPLC-DAD method for the simultaneous quantification of opicapone (BIA 9-1067) and its active metabolite in human plasma. The Royal society of Chemistry, 2013; 138(8):2463–9. CrossRef
Daniela Goncalves, Gilberto Alves, Patrício Soares-da-Silva et al. Bioanalytical chromatographic methods for the determination of catechol-O-methyltransferase inhibitors in rodents and human samples: A review. Analytica Chimica Acta, 2012; 710:17–32. CrossRef
Eisenhofer G, Kopin IJ, Goldstein DS. Catecholamine metabolism: a contemporary view with implications for physiology and medicine. Pharmacol Rev, 2004; 3(56):331–49. CrossRef
Fabbrini G, Brotchie JM, Grandas F, Nomoto M, Goetz CG. Levodopa-induced dyskinesias. Mov Disord, 2007; 22(10):1379–89. CrossRef
Gillman PK. A reassessment of the safety profile of monoamine oxidase inhibitors: elucidating tired old tyramine myths. J Neural Transm, 2018; 125(11):1707–17. CrossRef
Glatt SJ, Faraone SV, Tsuang MT. Association between a functional catechol O-methyltransferase gene polymorphism and schizophrenia: meta-analysis of case-control and family-based studies. Am J Psychiatry, 2003; 160(3):469–76. CrossRef
Hamidi O, Young WF, Gruber L Smestad J, Yan Q, Ponce OJ, Prokop L, Murad MH, Bancos I. . Clin Endocrinol, 2017; 87(5):440–50. CrossRef
Hussain T, Lokhandwala MF. Renal dopamine receptors and hypertension. Exp Biol Med, 2003; 228(2):134–42. CrossRef
Lopez VM, Decatur CL, Stamer WD, Lynch RM, McKay BS. . PLOS Biol, 2008; 6(9):e236. CrossRef
Low PA. Neurogenic orthostatic hypotension: pathophysiology and diagnosis. Am J Manag Care, 2015; 21(13 Suppl):s248–57.
Macleod AD, Taylor KS, Counsell CE. . Mov Disord, 2014; 29(13):1615–22. CrossRef
Moghadam-Kia S, Oddis CV, Aggarwal R. . Cleve Clin J Med, 2016; 83(1):37–42. CrossRef
Scholz H, Trenkwalder C, Kohnen R, Kriston L, Riemann D, Hornyak M. Levodopa for restless legs syndrome. Cochrane Database Syst Rev, 2011; (2):CD005504.
Stahl SM, Felker A. Monoamine oxidase inhibitors: a modern guide to an unrequited class of antidepressants. CNS Spectr, 2014; 13(10):855–71. CrossRef
Strawn JR, Keck PE, Caroff SN. Neuroleptic malignant syndrome. Am J Psychiatry, 2007; 164(6):870–6. CrossRef
Tevosian SG, Ghayee HK. Pheochromocytomas and paragangliomas. Endocrinol Metab Clin North Am, 2019; 48(4):727–50. CrossRef
Thanvi B, Lo N, Robinson T. . Postgrad Med J, 2007; 83(980):384–88. CrossRef
Warren JD, Blumbergs PC, Thompson PD. Rhabdomyolysis: a review. Muscle Nerve, 2002; 25(3):332–47. CrossRef