
INTRODUCTION
Doripenem (DM) is an antibiotic medication used for treating severe stomach infections, pneumonia, and urinary tract infections, particularly those stemming from kidney issues caused by sepsis. It falls under the carbapenem class and exhibits a wide spectrum of bacterial sensitivity, targeting both gram-positive and gram-negative bacteria. DM inhibits the synthesis of cell walls in microorganisms by interacting with penicillin-binding proteins. It is vulnerable to carbapenemase activity but resistant to beta-lactamases, including those with broad activity. Additionally, it demonstrates enhanced efficacy against Pseudomonas aeruginosa. DM monohydrate (Fig. 1) is chemically defined as (4R,5S,6S)-3-[((3S,5S)-5-[[(aminosulfonyl)amino]methyl]-3-pyrrolidinyl)thio]-6-[(1R)-1-hydroxyethyl]-4-methyl-7-oxo-1-azabicyclo[3.2.0]hept-2-ene-2-carboxylicacid monohydrate, with a molecular mass and formula of 438.52 m/z (420.50 m/z in free-base form) and C15H24N4O6S2·H2O (C15H24N4O6S2 in free-base form), respectively [1].
The importance of developing straightforward and precise analytical methods to detect and quantify impurities in medicines is underscored by their growing therapeutic significance [2]. Analyzing impurities and assays for quantitative estimation and identification is increasingly essential to assess the quality of both drug substances and pharmaceutical products, ensuring their safety and acceptability for use [3,4]. As a result, it is imperative to test each drug for assay and organic impurities to determine its potency and impurity profile, ideally achieved through suitable liquid chromatography techniques.
Liquid chromatographic techniques are commonly utilized methods for separating and quantifying target analytes within complex sample mixtures, ensuring accurate estimation without interference. Chromatographic separation can be achieved through either normal-phase liquid chromatography [5–8] or reversed-phase liquid chromatography [9–13]. Liquid chromatography methods featuring stability-indicating characteristics, such as high-performance liquid chromatography (HPLC), ultra-performance liquid chromatography (UPLC), and liquid chromatography-mass spectrometry, are frequently employed for potency assays and impurity profiling [12–15].
The stability-indicating method (SIM) is a reliable analytical approach used to effectively separate closely eluting peak pairs and accurately identify each component without any interference, whether in a drug substance or drug product. Stability testing, employing this technique, aims to assess how the quality of a drug substance or product changes over time due to various environmental factors such as temperature, humidity, and light. The resulting data helps in making decisions regarding the management of the drug’s stability. This includes determining a retest period for the drug substance or a shelf life for the drug product, as well as establishing appropriate storage conditions.
Following an extensive literature review, it was noted that there are only a handful of documented analytical procedures for assaying and testing impurities. A thorough examination of scientific literature revealed the absence of officially standardized methods for assaying and testing impurities in DM using chromatography techniques. Moreover, no chromatographic method has been reported for simultaneously determining both DM-related organic impurities and doripenemic acid (DMA) [16–23], as illustrated in Figure 1. However, there is no reported SIM for estimating the assay and organic-related impurities of DM. Consequently, the author developed and established a stability-indicating reversed-phase HPLC method (RP-HPLC) for determining organic-related impurities and the assay of doripenem in both drug substances and pharmaceutical formulations (infusion for injection).
To create a stability-indicating HPLC method, a series of experiments, typically around 15, were devised using a factorial design model. This initial method was then further refined and scientifically elucidated through optimization using the design of experiments (DoEs) approach [24]. The proposed The proposed HPLC procedure underwent validation, demonstrating exceptional characteristics such as linearity, accuracy, precision, specificity, stress testing, detection limit, and quantitation limit (QL) [25–36]. Robustness and solution stability investigations were conducted to ensure the ongoing efficacy of the developed HPLC method, yielding results within acceptable parameters.
EXPERIMENTS
Reagents and materials
Analytical reagent-grade phosphoric acid and potassium dihydrogen phosphate were obtained from SRL Private Ltd. (Mumbai, India). DM monohydrate and its organic impurity (DoE) were generously provided by Aurex Laboratories (Hyderabad, India). Samples of DM powder for infusion (500 mg/vial) and placebo powder (containing DM and all its excipients) were prepared at Aurex Laboratories (Hyderabad, India). Ultra-purified water for HPLC analysis was sourced from the Department of Chemistry, Acharya Nagarjuna University (Guntur, India). SRL Private Ltd. (Mumbai, India) supplied analytical reagent-quality sodium hydroxide, hydrochloric acid, potassium nitrate, and hydrogen peroxide (50%, w/w).
Instrumentation
The assay and organic impurity testing of DM were conducted utilizing a Waters Alliance e2695 HPLC system (Waters, UK) paired with a 2,996 photodiode array detector (Waters, UK). A C18 column (Inertsil ODS-3V, 250 × 4.6 mm, 5.0-µm, GL Sciences, Japan) was employed for chromatographic separation. Chromatographic data were acquired using Empower 3 software. Samples and standards were weighed using an analytical balance (Mettler Toledo, XSR105, Switzerland). The pH of the buffer was measured and adjusted utilizing a Polmon pH meter (LP-135M, Polmon, India).
HPLC conditions
To achieve chromatographic separation in gradient elution mode, an HPLC system with an Inertsil ODS-3V analytical column (250 × 4.6 mm, 5.0 µm) was utilized. The mobile phase A consisted of a potassium dihydrogen phosphate buffer solution (25 mM, pH adjusted to 6.1 with dilute sodium hydroxide solution), while acetonitrile served as mobile phase B. A gradient elution mode with the following profile [(time (min)/%B): 0/0, 15/8, 30/28, 35/28, 40/0, and 45/0] was employed, with a flow rate of 1.2 mL/min and an injection volume of 20 µL. The auto-sampler tray temperature was maintained at a constant 5°C, while the column temperature was set to 45°C. The potency assay and organic-related impurities of DM were determined using a detection wavelength of UV 295 nm. Doripenemic acid (DMA) was quantified using a detection wavelength of UV 210 nm.
 | Figure 1. Chemical structures of (a) DM and (b) DMA. [Click here to view] |
Diluting solvent
All samples and standard solutions were prepared using a diluent composed of a 90:10 (v/v) mixture of acetonitrile and pH 6.1 buffer solutions.
Standard solution
To prepare the working standard stock solution of DM, 10 mg of DM was dissolved in 100 mL of diluent, resulting in a concentration of 100 µg/mL To achieve a final concentration of 6.0 µg/ml for potency assay analysis, the stock solution was further diluted by transferring 3.0 ml of the stock solution into a 50 mL volumetric flask and then diluting with diluent.
For the standards of DM (4.0 mg) and DMA (4.0 mg), the substances were accurately weighed and added to separate 100-ml volumetric flasks. To each flask, 30 ml of diluent was added, and the solutions were fully dissolved using sonication for 2 minutes. After cooling to room temperature, diluent was added to reach the final volume. Finally, 3.0 ml of the resulting stock solution was transferred into separate 100-ml volumetric flasks and diluted with diluent to the appropriate volume.
Sample solution
To prepare the sample solution for organic impurities in DM, 120 mg of DM powder (for infusion, 500 mg per vial; for injection, 1 g per vial) was weighed into a 100 mL volumetric flask. Subsequently, 70 mL of diluent was added to the flask. The mixture was then placed in an ultrasonic bath and sonicated for 20 minutes with intermittent shaking to facilitate drug extraction from the sample matrix. After sonication, the solution was allowed to cool to room temperature, and an additional diluent was added to reach the final volume. The resulting solution was thoroughly mixed.
The supernatant solution, with a concentration of 1.20 mg/mL, was used for HPLC analysis of organic-related impurities after centrifuging the sample solution at 5000 rpm for 5 minutes. For the assay, a further dilution of 1.0 mL of the sample solution in 200 mL of diluent was made, resulting in a concentration of 6.0 µg/mL.
Placebo solution
A placebo solution, intended for assessing excipient peaks, was prepared by dissolving a finely powdered placebo (a drug-free formulation) in 100 mL of the same diluent used for the sample solution.
Quality by design with DoEs
The robustness of the newly developed HPLC technique is often evaluated using either the ‘one factor at a time (OFAT)’ approach or DoEs, which employs the factorial design concept. In this study, a DoE was utilized for robustness assessment to identify potential failure points or risks. The proposed method aims to pinpoint critical analytical attributes (CAAs) that significantly influence the separation of closely eluting components and associated critical quality attributes (CQAs) are evaluated based on these CAAs.
To optimize the HPLC technique for achieving the best separation in the shortest run time, the initially designed method underwent further refinement using the DoE approach. A full factorial response surface design with a Box-Behnken design type and a quadratic model was employed using Design Expert 13 software. The Box-Behnken design enhances prediction accuracy in the center-factor space and is replicated for every categorical treatment combination when categorical elements are included.
Fifteen runs were conducted with critical analytical attributes including buffer pH 6.2 (used in the mobile phase), flow rate (1.0 ± 0.2 mL/min), and column temperature (40 ± 5°C). The Box-Behnken design model was then utilized to evaluate the retention times (RT) of DMA and DM (Table 1). Among the 15 runs, three were center points, while the remaining twelve were numeric runs.
Stress testing study
For the forced degradation study, various stress testing conditions including acid, neutral, base, humidity, oxidation, photolysis, and thermolytic stress were employed to evaluate the stability of the drug [27–31].
For acid and alkaline stress conditions, approximately 60 mg of the drug was transferred to a 50-mL volumetric flask and treated with 5 mL of aqueous 0.05 N hydrochloric acid (HCl) solution at 25°C for 1 hour and 5 mL of aqueous 0.5 N sodium hydroxide solution (NaOH) at 25°C for 1 hour, respectively. After treatment with these reagents, each sample solution was neutralized with the respective reagents: 5 mL of 0.05 N sodium hydroxide solution for acid stress conditions and 5 mL of 0.5 N hydrochloric acid solutions for alkali stress conditions.
 | Table 1. Method variables selected for the DoE study. [Click here to view] |
 | Figure 2. Chromatogram of spiked sample obtained initial trials (before DoE study). [Click here to view] |
 | Table 2. Experiments design obtained from Box-Behnken design model. [Click here to view] |
 | Table 3. Fit statistics and final equations. [Click here to view] |
For hydrolysis conditions (water stress, neutral), about 60 mg of the drug was placed into a 50-mL volumetric flask and treated with 5 mL of purified water at 25°C for 1 hour. For oxidative stress conditions, the drug (approximately 60 mg) was taken into a 50-mL volumetric flask and treated with 5 mL of aqueous 0.3% hydrogen peroxide solution (H2O2) at 25°C for 1 hour. Subsequently, this solution was exposed to 60°C for 10 minutes to halt the oxidation reaction.
 | Table 4. Method variables confirmed from the DoE study of DM. [Click here to view] |
 | Table 5. Post analysis results of DOE study (point prediction and confirmations) of DM. [Click here to view] |
 | Figure 3. (a) Contour plot of response 1 obtained from interactions between pH and flow rate. [Click here to view] |
 | Figure 3. (b) Contour plot of response 1 obtained from interactions between pH and column temperature. [Click here to view] |
 | Figure 3. (c) Contour plot of response 1 obtained from interactions between flow rate and column temperature. [Click here to view] |
For thermolytic, photolytic, and humidity stress conditions, DM samples (1 g/vial) equivalent to 240 mg for each condition were subjected to (a) dry heat at 105°C for 24 hours in a hot air vacuum oven, (b) photolytic conditions (ultraviolet light of 200 watt-hours per square meter and white cool fluorescence or visible light of 1.2 million lux-hours) in a photo-stability chamber [30–31], and (c) humidity conditions at 90% RH at 25°C for 24 hours in a humidity chamber, respectively. The stressed samples were dissolved in a diluent (60 mg in 50 mL) to prepare the stressed sample solutions. Subsequently, these sample solutions were centrifuged at 5000 rpm for 5 minutes, and the supernatant solutions were used for analysis.
All stressed samples, including those subjected to acid, alkaline, hydrolysis, oxidative, thermolytic, photolytic, and humidity stress conditions, were analyzed using the proposed HPLC method to determine the amount of organic impurities (% degradation) in DM and DMA under each stress testing condition. The stressed samples were further diluted with the same diluent to achieve a concentration of 6 µg/ml. They were then analyzed against a freshly prepared working standard (6 µg/ml), and the mass balance was evaluated by examining the amounts of impurities and the assay of the main substance.
 | Figure 4. (a) Contour plot of response 2 obtained from interactions between pH and flow rate. [Click here to view] |
 | Figure 4. (b) Contour plot of response 2 obtained from interactions between pH and column temperature. [Click here to view] |
 | Figure 4. (c) Contour plot of response 2 obtained from interactions between flow rate and column temperature. [Click here to view] |
RESULTS AND DISCUSSION
Summary of HPLC method development trials
The primary objective of the current research is to establish a dependable and consistent testing method for the separation, detection, and simultaneous quantification of DMA, DM, and related organic impurities in formulated drug products (powder for injection). Various experiments were conducted across multiple trials, employing different mobile phases, columns, and chromatographic conditions to optimize the methodology [27,32]. Here is a summary of all the trials conducted.It was determined that DM exhibits a maximum wavelength at 295 nm, following a comparison of the ultraviolet spectra of DM and DMA obtained from the photodiode array detector in the UV range of 200–395 nm. Consequently, the final detection wavelength for assay and impurity testing was selected accordingly. However, for the assessment of DMA in drug substances and drug products, a wavelength maximum of UV 210 nm was chosen. This decision was made because DMA demonstrates a wavelength maximum at UV 210 nm and provides excellent peak responses, ensuring an accurate estimation of all contaminants.
In the initial trials, aqueous buffers such as potassium phosphate (10 mM), phosphoric acid (0.1%), and trifluoroacetic acid (0.1%) in water were tested as mobile phases in isocratic elution mode, along with organic modifiers such as acetonitrile and methanol. However, none of the peaks were sufficiently separated under the isocratic conditions. Subsequently, potassium phosphate buffer solution (25 mM, pH 6.2) was selected as mobile phase A, while acetonitrile served as mobile phase B. A gradient elution mode with the following profile [(time (min)/%B): 0/0, 15/8, 30/28, 35/28, 40/0, and 45/0] was employed, with a flow rate of 1.0 mL/min and an injection volume of 20 µl.
Preliminary development trials involved testing various analytical columns, including C8 and C18, suitable for RP-HPLC, at different column oven temperatures ranging from 30°C to 50°C. However, the desired separation was only achieved using the C18 column, specifically the Inertsil ODS-3V (250 × 4.6 mm, 5 µm) from GL Sciences, Japan, with a column temperature set at 45°C. The Inertsil ODS-3V column, known for its high carbon loading, proved instrumental in separating closely eluting peak pairs within the selected pH range of 6.0–6.4.
The drug was diluted and extracted using a mixture of 90:10 (v/v) acetonitrile and a buffer solution with a pH of 6.2. Initially, an injection volume of 10 µl was chosen for preliminary analysis. However, suitable peak responses could not be achieved at this volume. Therefore, an injection volume of 20 µl was eventually selected for the measurement of the assay and all organic-related impurities of DM, followed by DMA (Fig. 2).
 | Table 6. Results of forced degradation study obtained from DM samples. [Click here to view] |
 | Table 7. System suitability results of DM and DMA. [Click here to view] |
Statistical analysis of DoE study
The DMA impurity was spiked onto the DM sample solution at the specification level (0.2%, w/w) and analyzed using the 15 runs of the Box-Behnken design [33-35]. The responses, including the retention time of DMA and DM, obtained from the critical peak pairs, were collected from the 15 experimental runs and analyzed using the DoE software (Table 2).
The analysis of variance (ANOVA) results indicate that the model is significant for all the responses, with p-values < 0.0001. The p-values less than 0.0500 indicate that model terms have a significant effect on responses (R1 and R2). In this case, acetonitrile ratio (A) and column temperature (B) are significant model terms (Table 3).
The fit summary results for response 1 (R1: Retention time of DMA, 3.82 minutes) show that the predicted R2 and adjusted R2 values were 0.3800 and 0.6238, respectively. Similarly, for response 2 (R2: Retention time of DM, 11.98 min), the predicted R2 and adjusted R2 values were 0.4959 and 0.6903, respectively. These values indicate a close agreement between the predicted and actual values. The difference between the predicted and adjusted R2 values is approximately 0.24. The F-values for response 1 (R1) and response 2 (R2) are 8.74 and 11.40, respectively, indicating that the selected model is significant.
The Adeq Precision measures the signal-to-noise (S/N) ratio, with values of 14.6677 for R1 and 13.7849 for R2, suggesting an adequate signal for providing information on the design space. Point prediction analysis confirmed that the optimum conditions (two-sided, 95% confidence interval) are a retention time of 3.7715 minutes for DMA and 11.8051 minutes for DM (Tables 3–5).
To cross-verify the point prediction values, the spiked sample solution was analyzed using the derived conditions of Box-Behnken (i.e., buffer pH 6.12, flow rate 1.20 ml/min, and column temperature 45°C). The experimental results for R1 and R2 were found to be 2.91 and 10.09, respectively, indicating good agreement with the predicted results.
The DoE approach demonstrated that the 3-factorial design used was well-suited for exploring the interactions between the independent factors (buffer pH, flow rate, and column oven temperature) and dependent variables (response factors: R1 and R2). The interaction and effects of AB (buffer pH and flow rate) significantly influenced response R1 and response R2 (Tables 4 and 5 and Figs. 3–7). A robust HPLC method was developed with a run time of 30 minutes using a gradient program of [(time (min)/%B): 0/0, 15/8, 18/28, 25/28, 27/0, and 30/0].
Results of stress testing
The stressed sample solutions of DM (concentration of 1.20 mg/ml) were analyzed using the developed HPLC method, and the test results are summarized in Table 6. Major degradation was observed in hydrolysis (acid, alkali, and neutral) and oxidation stress conditions, while no significant degradation was observed in other stress conditions (thermal stress, photolytic stress, and humidity stress conditions) (Fig. 8).
 | Figure 5. Cubes of desirability of response 1 and response 2. [Click here to view] |
 | Table 8. Linearity results of DM and DMA [Click here to view] |
To establish their mass balance, all stressed samples were compared to a working standard with equivalent concentrations. The mass balance was calculated using the assay results and degradation products. Peak purity of DM and DMA peaks under each stress condition was assessed using the photodiode array detector. The forced degradation investigation demonstrated that the designed HPLC method is stability-indicating and effectively separates closely eluting peaks.
Method validation
The developed HPLC method was verified as per the United States Pharmacopeia [26] and ICH guidelines [25] for system suitability, specificity, linearity, quantification limit, precision, accuracy, solution stability, and robustness. The validation experiment summary was discussed as follows:
System suitability
The system suitability results derived from the standard solution containing DM and DMA are summarized in Table 7 and Fig. 9. The system suitability factors including tailing factor (not more than 2.0), theoretical plates (not less than 2,000), and %RSD (relative standard deviation, not more than 2.0 for DM and not more than 5.0% for DMA) were evaluated and found to be well within the pre-defined limits.
Specificity
The specificity of the HPLC method was assessed by injecting the placebo solution, DMA, and diluent into the system to detect any potential interference. The results of the specificity study revealed no interference at the retention time of the DMA peak, the DM peak, or any of its unknown organic impurities.
Linearity
For the organic impurities and assay testing, a series of calibration curve solutions were prepared with DM at six different concentrations. These concentrations ranged from the QL to 150% of the target concentration (6 µg/ml). The concentrations used were: 0.0115 µg/ml (QL, 0.010%), 2.8819 µg/ml (50%), 4.6111 µg/ml (80%), 5.7639 µg/ml (100%), 6.9166 µg/ml (120%), and 8.6458 µg/ml (150%).
 | Figure 6. (a) 3D surface, desirability plot (interactions between flow rate and column temperature). [Click here to view] |
 | Figure 6. (b) 3D surface, desirability plot (interactions between buffer pH and flow rate). [Click here to view] |
 | Figure 6. (c) 3D surface, desirability plot (interactions between buffer pH and column temperature). [Click here to view] |
For the content of DMA, the linearity was determined across concentrations ranging from 5% (QL) to 150% of the target test concentration of 1.20 µg/ml, corresponding to 0.10%. These concentrations were: 0.060 µg/ml (QL, 5%), 0.120 µg/ml (10%), 0.240 µg/ml (20%), 0.480 µg/ml (40%), 0.720 µg/ml (60%), 0.960 µg/ml (80%), 1.200 µg/ml (100%), and 1.80 µg/ml (150%).
The calibration curves for DM and DMA were constructed by plotting the peak areas versus concentrations. The correlation coefficient (r) obtained for both doripenem and DMA exceeded 0.999 (R2 > 0.999), indicating excellent linearity. The slope, intercept, and %y-intercept results derived from the calibration curves can be found in Table 8. Visual representations of the calibration curves are provided in Fig. 10(a) for DM and Fig. 10(b) for DMA.
QL
The QL for DM and DMA were determined using the S/N ratio approach, following the guidelines outlined in ICH Q2(R2). The established QL concentrations were found to be 0.0115 µg/ml for DM and 0.060 µg/ml for DMA. To confirm these QL concentrations, six replicate solutions were prepared at the derived concentrations for precision assessments. The results of these precision assessments are summarized in Table 9.
Precision
For assay testing, homogenous sample solutions were prepared in six replicates at the intended test concentration of 6.0 µg/ml and analyzed to assess the precision of the developed method. The results of these analyses are presented in Table 10.
To evaluate the repeatability of the developed testing method for DMA impurity, six spiked sample solutions were individually prepared at concentrations of 1.2 mg/ml of DM and 1.20 µg/mL of DMA (0.10%, w/w) from homogeneous samples of the same batch of DM for injection. The precise estimation of the DMA impurity obtained from each sample was determined, and the highest individual impurity was recorded. The recovery values (target range: 80.0% to 120.0%) of the DMA impurity obtained from the six replicate sample determinations were then calculated, along with the relative standard deviation (RSD) which should not exceed 10.0%. These results are summarized in Table 10.
Accuracy
For assay testing, three spiked samples were prepared by adding the drug substance to placebo of the drug product at three different concentrations: 50% (2.8819 µg/ml), 100% (5.7639 µg/ml), and 150% (8.6458 µg/ml). Similarly, three spiked samples were prepared by adding the respective impurity to the drug product sample at three different concentration levels: 0.05% (0.60 µg/ml), 0.10% (1.20 µg/ml), and 0.20% (1.80 µg/ml) for the analysis of organic related impurities.
 | Figure 7. Chromatogram of spiked sample obtained from DoE study. [Click here to view] |
 | Figure 8. Chromatogram of control sample solution. [Click here to view] |
 | Figure 9. (a) Chromatogram of DM standard solution. [Click here to view] |
 | Figure 9. (b) Chromatogram of placebo solution (210 nm). [Click here to view] |
 | Figure 9. (c) Chromatogram of placebo solution (295 nm). [Click here to view] |
The accuracy of these sample solutions for both assay and impurities was assessed using the developed HPLC method. The percent recovery values and percent %RSD of DM and DMA were then calculated and summarized in Table 11. The accuracy results confirm that the developed test method is accurate and reliable.
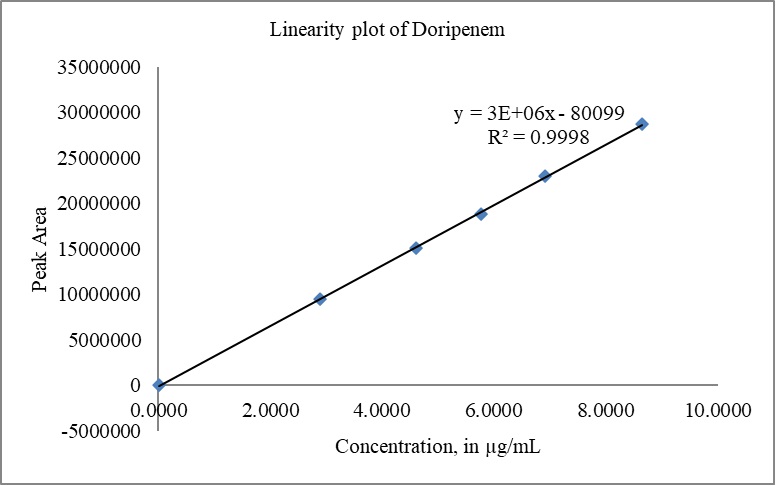 | Figure 10. (a) Linearity plot of DM. [Click here to view] |
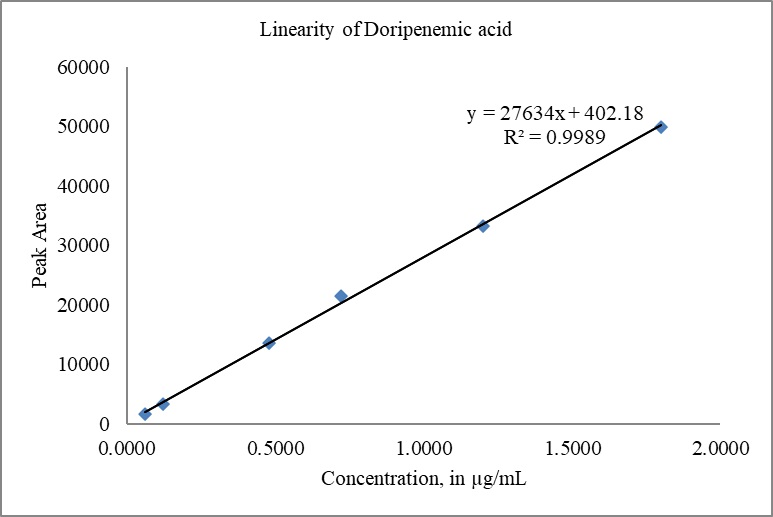 | Figure 10. (b) Linearity plot of DMA. [Click here to view] |
Solution stability
The solution stability of standard and sample solutions was assessed by storing the solutions in clear volumetric flasks under two different conditions: room temperature (25°C) and refrigerator conditions (2°C–8°C). The solutions were then analyzed at different time intervals of 24, 48, and 72 hours.
The test results demonstrated that the standard and sample solutions remained stable at room temperature and under refrigerator conditions for approximately 48 hours. This indicates that the solutions can be reliably stored and used for analysis within this time frame without significant degradation or alteration.
Robustness
The robustness of the test method was assessed by deliberately altering several parameters, including the flow rate (1.2 ± 0.2 ml/minutes), column temperature (45°C ± 5°C), buffer pH (6.1 ± 0.2), and wavelength of the buffer solution (210 ± 2 nm; 295 ± 2 nm). The objective was to determine if the system’s suitability remained unaffected and if the acceptance criteria were met. The observed retention times of DMA and DM did not exhibit significant variation with changes in flow rates, column temperatures, or pH conditions. Additionally, the variability in the estimation of impurities was within ±10%, indicating that the method is robust and capable of providing consistent and reliable results under varying experimental conditions. The results are summarized in Table 12.
 | Table 9. QL results of doripenemic and DMA. [Click here to view] |
 | Table 10. Precision results of doripenemic and DMA. [Click here to view] |
 | Table 11. Accuracy results of doripenemic and DM acid. [Click here to view] |
CONCLUSION
A liquid chromatography method was developed and validated to simultaneously determine DMA, assay, and organic impurities of DM in pharmaceuticals, following ICH guidelines. The method achieved efficient separation of DM and its impurities within a 25-minute run time, without interference. Stress testing confirmed its stability-indicating nature. The method exhibited specificity, linearity, accuracy, and precision, making it suitable for quality control purposes. It was successfully applied for analyzing release and stability samples of DM in drug substances and products, ensuring their quality, efficacy, and safety.
 | Table 12. Robustness study results of doripenemic and DM acid. [Click here to view] |
ACKNOWLEDGMENTS
The authors wish to thank the management of Gitam (Deemed to be University), Hyderabad (India), and Dr. SLN Laboratories Private Limited (Hyderabad, India) for supporting and providing the facilities for this research work.
AUTHOR CONTRIBUTIONS
All authors made substantial contributions to the conception and design, acquisition of data, or analysis and interpretation of data; took part in drafting the article or revising it critically for important intellectual content; agreed to submit to the current journal; gave final approval of the version to be published; and agree to be accountable for all aspects of the work. All the authors are eligible to be an author as per the International Committee of Medical Journal Editors (ICMJE) requirements/guidelines.
FINANCIAL SUPPORT
There is no funding to report.
CONFLICTS OF INTEREST
The authors have declared that they have no conflicts of interest.
ETHICAL APPROVALS
The study does not involve experiments on humans or animals.
DATA AVAILABILITY
All the data is available with the authors and shall be provided upon request.
PUBLISHER’S NOTE
All claims expressed in this article are solely those of the authors and do not necessarily represent those of the publisher, the editors and the reviewers. This journal remains neutral with regard to jurisdictional claims in published institutional affiliation.
USE OF ARTIFICIAL INTELLIGENCE (AI)-ASSISTED TECHNOLOGY
The authors declares that they have not used artificial intelligence (AI)-tools for writing and editing of the manuscript, and no images were manipulated using AI.
REFERENCES
1. Doribax (doripenem) injection IV label, 2007 [cited 2023 June 20]. Available from: https://www.accessdata.fda.gov/drugsatfda_docs/label/2013/022106s008lbl.pdf
2. Narasimha SL, Chandrasekar K, Niroja V, Poornima R, Kalyani C, Sanjeeva RC. Molecular docking, in-vitro anticancer evaluation and ADME profiling of 7-Oxo Midostaurin. J Mole Struct. 2023;1293:136159. CrossRef
3. ICH. Q3A(R2), Impurities in new drug substances, 2006 [cited 2023 July 20]. Available from: https://database.ich.org/sites/default/files/Q3A%28R2%29%20Guideline.pdf
4. ICH. Q3B(R2), Impurities in new drug products, 2006 [cited 2023 July 20]. Available from: https://database.ich.org/sites/default/files/Q3B%28R2%29%20Guideline.pdf
5. Vadagam N, Haridasyam SB, Venkatanarayana M. Stability-indicating normal-phase HPLC method development for separation and quantitative estimation of S-enantiomer of lacosamide in pharmaceutical drug substance and tablet dosage form. Biomed Chromatogr. 2023;37(9):e5688. CrossRef
6. Vadagam N, Haridasyam SB, Venkatanarayana M, Lakka NS, Chinnakadoori SR. Separation and quantitative estimation of stereo-selective enantiomers of montelukast in pharmaceutical drug substance and tablets dosage forms by using stability-indicating normal phase-HPLC method. Chirality. 2023;35(12):952–65. CrossRef
7. Vadagam N, Haridasyam SB, Venkatanarayana M, Lakka NS, Chinnakadoori SR. Separation and quantitation of Valacyclovir Enantiomers using stability-indicating chiral liquid chromatography method with an immobilized chiral phase of Amylose Tris-(3,5-dimethylphenylcarbamate). Sep Sci Plus. 2023;6(12):2300145. CrossRef
8. Vadagam N, Haridasyam SB, Venkatanarayana M, Lakka NS, Chinnakadoori SR. Separation and simultaneous estimation of enantiomers and diastereomers of muscarinic receptor antagonist Solifenacin using stability-indicating normal-phase HPLC technique with chiral stationary phase amylose tris-(3,5-dimethylphenylcarbamate). Chirality. 2023;36(2):e23632. CrossRef
9. Lakka NS, Goswami N. A stability indicating RP-HPLC method for simultaneous determination of halobetasol propionate and pchlorocresol in creams. Int Res J Pharm Appl Sci. 2012;2(5):13–9. Available from: https://www.scienztech.org/index.php/irjpas/article/view/335
10. Praveen BNVVD, Sharath BH, Niroja V, Mohan P, Muvvala V, Belquis B. Stability-indicating liquid chromatography method development for assay and impurity profiling of amitriptyline hydrochloride in tablet dosage form and forced degradation study. Biomed Chromatogr. 2022;36(10):e5436. CrossRef
11. Narasimha SL, Nishant G, Penugonda B, Vaddi S. Development and validation of a stability-indicating RP-HPLC for the simultaneous determination of atorvastatin calcium and simvastatin in pharmaceutical solid dosage forms. Int J Res Pharm Sci. 2011;2(4):608–15.
12. Lakkireddy P, Malipeddi H, Venkata BS, Narasimha SL. Impurity profiling and a stability-indicating UPLC method development and validation for the estimation of related impurities of halobetasol propionate in halobetasol propionate 0.05% (w/w) cream. Journal of Chromatogr Sci. 2015;53(1):112–21. CrossRef
13. Menda J, Chintala V, Kowtharapu LP, Kanuparthy PR, Katari NK. Quality by design tool evaluated green stability-indicating UPLC content determination method for the olanzapine and samidorphan dosage form. Microchem J. 2023;197:109835. doi: http://dx.doi.org/10.2139/ssrn.4575839
14. Nagulancha BR, Lakka NS, Vandavasi KR. Stability-indicating method development and validation for quantitative estimation of assay and organic impurities of antiviral drug baloxavir marboxil in drug substance and pharmaceutical dosage form using HPLC and LC–MS methods. Biomed Chromatogr. 2023;37(8):e5644. CrossRef
15. Vaishnavi C. Stability indicating reversed-phase-high-performance liquid chromatography method development and validation for pyridostigmine bromide and sodium benzoate in oral solution. Biomed Chromatogr. 2023;30(3):e5800. CrossRef
16. Singaram K, Garikapati D. A validated new gradient stability-indicating LC method for the analysis of Doripenem in bulk and injection formulation. Chromatogr Res Int. 2013;963595:1–9. CrossRef
17. Veldi V, Golkonda R, Chintala R. A novel validated and stability indicating RP-HPLC method for the determination of doripenem in bulk and pharmaceutical formulations. Anal Chem Indian J. 2013;12(10):384–92.
18. Srinivasa RC, Vaishnavi C, Vishnu N, Rajyalakshmi C, Sasikiran GE, Leela PK, et al. Quantification of Drospirenone- and ethinyl estradiol-related impurities in a combined pharmaceutical dosage form by a chromatography method with a QbD Robustness study. J AOAC Int. 2023;107(1):31–9. CrossRef
19. Jose K, Jayasekhar P. Stability indicating HPLC determination of Doripenem in pharmaceutical dosage forms. Int J Pharm Sci Rev Res. 2013;22(2):41–5.
20. Paliosa PK, Garcia CV, Schapoval EES, Mendez ASL. Quantitative determination of the β-methyl carbapenem doripenem in powder for injection by a stability-indicating capillary zone electrophoresis method. Die Pharm Int J Pharm Sci. 2015;70(9):569–73. CrossRef
21. Katarzyna M, Genowefa P, Stefan T. Determination of doripenem and related substances in medicinal product using capillary electrophoresis. J Sep Sci. 2011;34(4):475–82. CrossRef
22. Andreas SLM, Luciano M, Fábio B, Carla TMS, Cássia VG, Fávero RP, et al. Characterization of the antibiotic Doripenem using physicochemical methods-chromatography, spectrophotometry, spectroscopy and thermal analysis. Quím Nova. 2011;34(9):1634–8. CrossRef
23. Rajesh K, Vaishnavi C, Satya Sree N, Naresh KK, Suresh S, Murty JNSRC, et al. Isolation and identification of forced degradation products of Februxostat. 2023;1. CrossRef
24. Lakka NS, Kuppan C, Vadagam N, Reddamoni SY, Muthusamy C. Degradation pathways and impurity profiling of the anticancer drug apalutamide by HPLC and LC–MS/MS and separation of impurities using design of experiments. Biomed Chromatogra. 2022;37(2):e5549. CrossRef
25. ICH, Q2(R1). Validation of analytical procedures: text and methodology, 1996 and 2005. Available from: https://database.ich.org/sites/default/files/Q2%28R1%29%20Guideline.pdf
26. United States Pharmacopeia, USP<1225> Validation of compendia procedures, 2020. Available from: http://www.uspbpep.com/usp32/pub/data/v32270/usp32nf27s0_c1225.html
27. Narasimha SL, Kuppan C. Principles of chromatography method development. In: Boldura O-M, Baltla C, Awwad NS, editors. Biochemical analysis tools-methods for bio-molecules studies. London, UK: IntechOpen; 2019. doi. 10.5772/intechopen.89501
28. Blessy M, Ruchi DP, Prajesh NP, Agrawal YK. Development of forced degradation and stability indicating studies of drugs-a review. J Pharm Anal. 2014;4(3):159–65. CrossRef
29. Mohan P, Sharath BH, Niroja V, Praveen BNVVD, Sanjeeva RC, Narasimha SL. Separation and quantification of organic-related impurities of beta-adrenergic receptor blocking agent propranolol in pharmaceutical solid dosage forms: impurity profiling using stability-indicating HPLC method. Sep Sci Plus. 2023;7(1):2300159. CrossRef
30. ICH. Q1B(R2). Stability testing: Photostability testing of new drug substances and products; 1996. Available from: https://database.ich.org/sites/sdefault/files/Q1B%20Guideline.pdf
31. ICH. Q1A (R2). Stability testing of new drug substances and products. 2003.
32. Snyder LR, Joseph JK, Joseph LG. Practical HPLC method development, 2nd ed., Hoboken, NJ: John Wiley and Sons; 2010.
33. Lakshmi NRK, Thirupathi D, Santhosh KE. Quality by design with design of experiments approach for development of a stability-indicating LC method for enzalutamide and its impurities in soft gel dosage formulation. Biomed Chromatogr. 2021;35(5):e5062. CrossRef
34. Siva KM, Naresh KK, Kalyan KS, Henele S, Vishnu MM, Santhosh KE, et al. Implementation of analytical quality by design and green chemistry principles to develop an ultra-high performance liquid chromatography method for the determination of Fluocinolone Acetonide impurities from its drug substance and topical oil formulations. J Chromatogr A. 2022;1679:463380. CrossRef
35. Jyothsna M, Phani RK, Naresh KK, Leela PK, Santhosh KE, Surya PRP. Quality by design tool–evaluated stability-indicating ultra-performance liquid chromatography method for the determination of drugs (ritonavir and darunavir) used to treat the human immunodeficiency virus/acquired immunodeficiency syndrome. Biomed Chromatogra. 2023;37(9):e5687. CrossRef
36. Boppy N, Haridasyam, SB, Vadagam N, Venkatanarayana M, Chinnakadoori SR, Lakka NS. Separation and quantification of organic-related impurities of anti-histamine drug hydroxyzine in pharmaceutical dosage forms using stability-indicating high-performance liquid chromatography, liquid chromatography-mass spectrometry, and high-resolution mass spectrometry techniques. Sep Sci Plus. 2024; e2300157. CrossRef