INTRODUCTION
Telmisartan (TS) is an angiotensin II receptor antagonist used to treat high blood pressure. TS is normally taken once a day at a dosage of 40–80 mg (Burnier, and Maillard, 2001; Han et al., 2010; Merck Index, 2001; Sharpe et al., 2001; Unger, 1999). A daily dose of 20 mg could also be beneficial to certain patients. If the target blood pressure is not met, the dosage of TS can be increased to a maximum of 80 mg once daily (Schumacher and Mancia, 2008). TS is not recommended for use during pregnancy. TS, like other drugs that affect the Renin-Angiotensin System, can cause birth defects, stillbirths, and neonatal deaths in babies. The drug’s ability to transfer into breast milk is unknown. It’s also not recommended if the patient suffer from bilateral renal artery stenosis because it may lead to kidney failure (Negro et al., 2017).
Hydrochlorothiazide (HCTZ) is a diuretic, commonly used to treat elevated blood pressure and fluid retention (Duarte and Cooper-DeHoff, 2010; World Health Organization, 2019) Other applications include diabetes insipidus and renal tubular disease, acidosis, and to reduce the risk of kidney stones in those that are at risk and with high amount of calcium in the urine. For high blood pressure, it is often suggested as a first line of defence (Katzung, 2012). HCTZ is often administered in combination with other anti-hypertensive drugs. Some of the possible side effects up on administration of HCTZ includes the following. Electrolyte imbalances particularly in people with impaired kidney function, low potassium levels in the blood and, less frequently, low blood sodium leading to gout and dizziness. Although it has been suggested that HCTZ allergies are more common in people who are allergic to sulfa drugs, this connection has not been proven. It belongs to the thiazide drug family which works by lowering the kidneys’ capacity to hold water (Wellington and Faulds, 2002). This decreases blood volume at first, lowering blood return to the heart and, as a result, cardiac arrest (Herman and Bashir, 2020). However, it is thought to lower peripheral vascular resistance in the long run.
A need for a simple, accurate, rapid, and sensitive method for the quantification of TS and HCTZ in tablet formulation exists owing to its populous use as anti-hypertensive combinational formulation in India. Up until now, TS and HCTZ were quantified in individual or in combination with other drugs using reverse-phased high performance liquid chromatographic technique (Bhatia et al., 2010; Duza et al., 2015; Ilango and ShijiKumar 2011; Kannappan and Mahendra kumarr, 2015, Rane et al., 2008, Sasidhar et al., 2014). This method aims to develop and validate a UPLC-Q-ToF/MS method for the simultaneous estimation of TS and HCTZ in tablet formulation using olmesartan medoxomil (OSM) as internal standard.
MATERIALS AND METHODS
Chemicals and reagents
Analytical reference standards of TS, HCTZ, and OSM were a kind gift from Akums Drugs and Pharmaceuticals. Pvt. Ltd., New Delhi, and was not less than 99.7% pure. Methanol (LC-MS grade) and acetonitrile (LC-MS grade) were procured from Honeywell Research Chemicals, USA. Ammonium acetate and formic acid of LC-MS grade were procured from Thermo Fischer Scientific India Pvt. Ltd., Mumbai. Milli Q grade water was used for the preparation of mobile phase and solutions for analysis. (Millipore, Milford, MA).
Tablet formulation containing 40 mg dose of TS and 12.5 mg dose of HCTZ, in combination, was purchased from local pharmacy.
Equipment’s and software’s
Chromatographic separation coupled with mass spectrometric analysis was performed on a WATERS ACQUITY® Xevo G2-XS Q-ToF UPLC®/MS system (Waters Corporation, Milford, MA) equipped with a binary solvent manager, auto-sample manager, column heater, photodiode array detector, and a quadrupole time of flight mass detector. A Thermo AccucoreTM C18 column (50 × 4.6 mm i.d, 2.6 μ) was used as stationary phase (Thermoscientific, Bellefonte, PA). Analysis of chromatographic peaks and calculation of the areas were performed using the Mass-Lynx TM version 4.1 software. Statistical analyses were performed using GraphPad Prism Software V9.0.
UPLC-Q-ToF/MS parameters
The chromatographic analysis of TS and HCTZ was carried out on a Thermo AccucoreTM C18 column (50 × 4.6 mm i.d, 2.6 μ) with the mobile phase composition of A: 10 mM ammonium acetate (pH = 5.8), B: acetonitrile delivered through a gradient flow program for 11 minutes with PDA detection (190–600 nm). The sample injection volume was set at 5 μl. For the mass spectrometric analysis, combined electrospray ionization (ESCi) source in negative polarity mode within a mass range of 50 to 1,000 Da was opted. The capillary, corona, sampling cone onset, and source offset voltages were set at 1.8 kV, 5 μA, 30 and 80, respectively. The source and desolvation temperatures were set at 120°C and 450°C, respectively. The flow rate of cone gas and desolvation gas (nitrogen) were set at 50 and 750 l/hour, respectively. During analysis, the cone voltage was ramped up from 15 V, initially, to 60 V.
Preparation of standard solutions
Standard solutions were prepared in separate for TS and HCTZ for constructing respective calibration curves. About 40 mg TS and 12.5 mg HCTZ, analytical reference standards were accurately weighed and transferred to a 100 ml volumetric flask. Then, 70 ml of acetonitrile was added and stirred until complete dissolution in a 100 ml volumetric flask. The solution was then made up to volume using acetonitrile [stock solution of 400 μg/ml (TS) and 125 μg/ml (HCTZ)]. A series of standard solutions were prepared by appropriately diluting the stock solutions in 10 mM ammonium acetate and acetonitrile (50:50, %v/v) to reach nine concentrations i.e., 0.203, 0.401, 0.801, 1.602, 2.01, 2.40, 2.80, 3.60, and 4.01 ng/inj.vol. and 0.06, 0.125, 0.250, 0.500, 0.625, 0.750, 0.875, 1.125, and 1.250 ng/inj.vol. of TS and HCTZ, respectively. All these concentrations were spiked with olmesartan medoxomil (OSM), internal standard, such that all working standard stock solution contains 1 ng/inj.vol. concentration of IS. These standard solutions were used to observe the linearity and construct the corresponding calibration curves.
Preparation of working standard solutions
A mixture of TS, HCTZ, and OSM (IS) was prepared by transferring 1 ml of each standard stock solution into 100 ml volumetric flask. The solution was made up to volume using 10 mM ammonium acetate and acetonitrile (50:50, %v/v). Working standard solution containing 20, 10 and 6.25 ng/inj.vol., of TS, HCTZ, and IS was analysed for its feasibility of chromatographic separation and mass spectrometric detection. The analytes were found to be suitable for analysis using this method as their separation delivered acceptable resolution, retention and ionisation characteristics.
Analytical method validation
The developed UPLC-Q-ToF/MS method was validated in accordance with the ICH Q2(R1) guideline (ICH harmonised tripartite guideline, 2005). Accordingly, the method has been evaluated for the solution stability of analytes, linearity range, limit of detection (LOD) and limit of quantification (LOQ), accuracy and precision.
Solution stability
It is important to evaluate the stability of analyte in a solution that remains for hours in an auto-sample manager as the analytes were at a risk of undergoing degradation. To determine the stability of TS, HCTZ and IS (20, 10, and 6.25 ng/inj.vol.) in solution, it was assayed after storage at -20°C, 4°C, and 25°C for 72 hours. Accelerated stability evaluation for the analytes was performed at 80°C for 8 hours. The obtained mean peak area values (n = 6) of TS, HCTZ and IS were compared with those obtained in a freshly prepared solution.
Linearity
The linear range analysis for TS and HCTZ was carried out by analysing the calibration standards i.e., 0.203, 0.401, 0.801, 1.602, 2.01, 2.40, 2.80, 3.60, and 4.01 ng/inj.vol. and 0.06, 0.125, 0.250, 0.500, 0.625, 0.750, 0.875, 1.125, and 1.250 ng/inj.vol. of TS and HCTZ, respectively, containing 1 ng/inj.vol. concentration of IS. Each concentration was evaluated five times and the corresponding mean peak area ratios (response factor) were plotted as a function of concentrations. The data was then statistically tested for its fitness in the linear regression model. A correlation coefficient (R2) value of >0.999 confirms the method’s linearity in the given concentration range.
Limit of detection and quantification
According to ICH, Limit of Detection (LOD), and limit of quantification (LOQ) were calculated using the response’s standard deviation and slope. Equation (1) was used to determine LOD, and Equation (2) was used to determine LOQ (ICH harmonized tripartite guideline, 2005)
Equation (1) – LOD = 3.3 σ/s
Equation (2) – LOQ = 10 σ/s
where σ corresponds to standard deviation of the y-intercepts of regression line and S is the slope of calibration curve. Both LOD and LOQ were validated by independent analysis of three different concentrations, at LOD and LOQ, under and above.
Precision and accuracy
The intra- and inter-assay precisions were determined using the CV (%), and the intra- and inter-assay accuracies were expressed as the percent difference between the measured concentration and the nominal concentration. The % accuracy of the method was expressed by the formula: % accuracy = (measured concentration)/(nominal concentration) × 100. Intra-assay precision and accuracy were calculated using replicate (n = 6) determinations for each concentration of the spiked sample during a single analytical run. Inter-assay precision and accuracy were calculated using replicate (n = 6) determination of each concentration made on three separate days.
Three independent concentrations i.e., 1.00 (LQC), 2.00 (MQC), and 3.00 (HQC) ng/inj.vol. of TS and 0.312 (LQC), 0.625 (MQC), and 0.937 (HQC) ng/inj.vol. of HCTZ were evaluated for determining the accuracy and precision of the method. The mean peak area values were compared with the mean peak area of internal standard (IS; 1 ng/inj.vol.).
The method was found to be accurate with recoveries of 99-102% and precision values were <2% CV.
Assay of marketed tablet formulation
For the assay, tablet formulation containing TS and HCTZ in combination was procured from local pharmacy. Prior to weighing, the tablets were ensured to be free from film coating. Tablets were weighed accurately and powdered using a mortar and pestle to fine powder. Weight equivalent to 40 mg of TS and 12.5 mg of HCTZ were transferred to a 15 ml centrifugal tube. Added an appropriate amount of IS to reach a final concentration of 1 ng/inj.vol. 7 ml acetonitrile was added and vortexed for 2 minutes. After the vortex formation, solution was centrifuged for 10 minutes at 6,000 rpm in room temperature. The supernatant was collected and the volume was made up to 25 ml using 10 mM ammonium acetate in water (1.6 and 0.5 ng/inj.vol., of TS and HCTZ, simultaneously).
Preparation of working sample solutions
The prepared sample stock solution, spiked with IS, was appropriately diluted for UPLC-Q-ToF/MS analysis.
RESULTS AND DISCUSSION
Analytical method development–optimization of analytical parameters
The working standard solution containing 20, 10, and 6.25 ng/inj.vol., of TS, HCTZ, and IS was evaluated for its analytical performance with C18 columns of varying dimensions, 10 mM ammonium acetate, and 0.1% formic acid in water as aqueous mobile phase components, acetonitrile and methanol as organic modifiers, ESCi in positive and negative polarity modes, varying capillary (0–5 kV), corona (0–7 μA), sampling cone (10–110 V) and source offset (10–130 V) voltages.
The structural aspects of TS, HCTZ, and IS were reviewed for characteristics like logP, pKa, polarizability and likewise for optimizing LC and Q-ToF/MS parameters (Fig. 1). Upon various trails, suitable analytical performance of the analytes was observed with Thermo AccucoreTM C18 column (50 × 4.6 mm i.d, 2.6 μ) as stationary phase, 10 mM ammonium acetate solution and acetonitrile as mobile phase components delivered through a gradient program (Table 1), 5 μl sample injection volume, combined ESCi source in negative polarity mode within a mass range of 50 to 1,000 Da, capillary, corona, sampling cone onset and source offset voltages set at 1.8 kV, 5 μA, 30 and 80 V, source and desolvation temperatures set at 120°C and 450°C, rate of cone gas and desolvation gas set at 50 and 750 l/hour and ramping the cone voltage from 15 V, initially, to 60 V.
The UPLC performance of analytes were found to be suitable for analysis with the analyte peaks being symmetric and well resolved. The mass spectrometric detection was found to be suitable for analyzing the analytes concerning the formation of distinct ion peaks in total ion chromatograms at times corresponding to the chromatographic elution (Fig. 2). Also, the ion peaks were found to be well resolved and symmetrical (Fig. 3). The mass spectrum displayed the parent ion peak i.e., the M− and base peak i.e., the (M–H)− and the corresponding daughter ion peaks for the analytes (Fig. 4).
Analytical method validation
Solution stability
The analytes were found to be stable in solutions after 72 hours of storage at −20°C, 4°C and 80°C as the %CV was <3% and %RSD was <15%. The analysis of stored solutions and freshly prepared solutions revealed recoveries of not less than 98%, confirming that the analytes remain unaffected during the storage (Table 2).
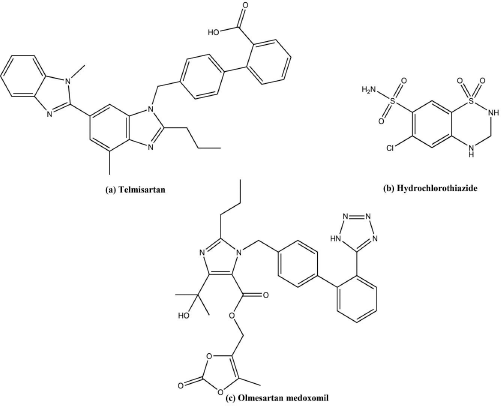 | Figure 1. Structure of TS, HCTZ, OSM. [Click here to view] |
 | Table 1. Gradient time and flow rate program of solvent delivery in UPLC. [Click here to view] |
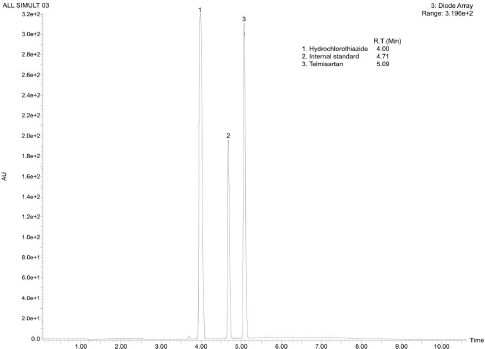 | Figure 2. Representative UPLC-DAD chromatogram of TS, HCTZ and IS reference standards. [Click here to view] |
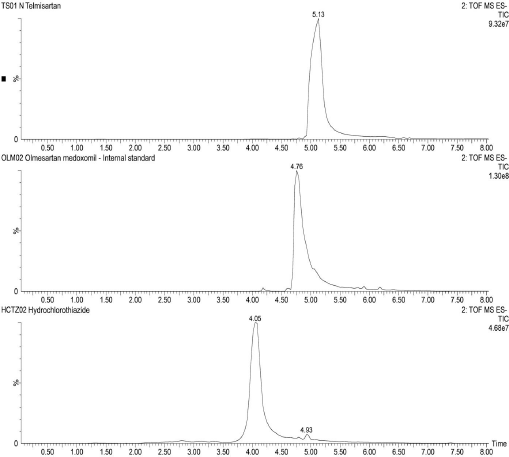 | Figure 3. Representative total ion chromatograms of TS, IS and HCTZ in negative polarity, respectively. [Click here to view] |
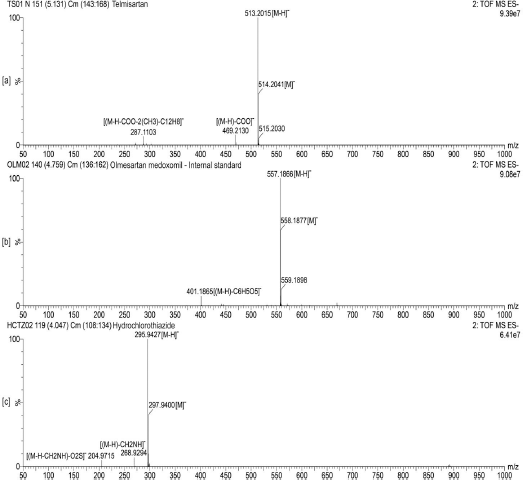 | Figure 4. Representative time of flight mass scan spectra of (a) TS, (b) IS and (c) HCTZ, respectively. [Click here to view] |
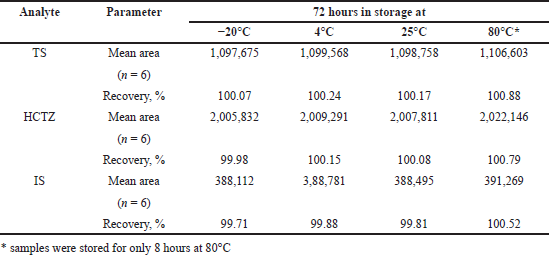 | Table 2. Results of solution stability studies for TS and HCTZ, respectively. [Click here to view] |
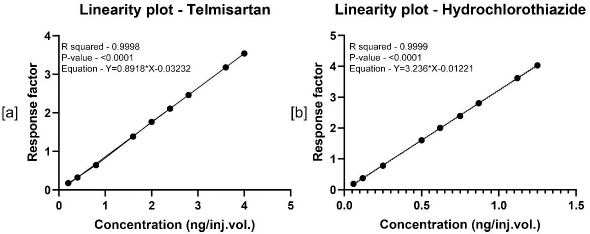 | Figure 5. Linearity plots of TS and HCTZ, respectively. [Click here to view] |
 | Table 3. Results of sensitivity studies for TS and HCTZ, respectively. [Click here to view] |
Linearity range
Calibration curves of TS and HCTZ were represented in Figure 5. The method was found to be linear in the given concentration ranges with R2 values >0.999. These results suggest the method’s ability to quantify TS and HCTZ in the ranges 0.203–4.01 ng/inj.vol., and 0.06-1.250 ng/inj.vol., respectively.
Limit of detection and quantification
The values of intercept, standard deviation of intercept, and slope obtained from the linear regression analysis were used to calculate the LOD and LOQ. Analysis of TS and HCTZ reported 0.137 and 0.034 ng/inj.vol., as LOD and 0.203 and 0.062 ng/inj.vol., as LOQ values of TS and HCTZ, respectively (Table 3).
Accuracy and precision study
Table 4 shows the results for precision and accuracy in terms of the coefficients of variation. %CV values for evaluation in intra-day and inter-day precision were found to be <2% (Table 4).
Assay of marketed tablet formulation
Upon extraction of the analyte’s TS and HCTZ from the tablet formulation using the procedure explained in previous sections, the assay of marketed tablet formulation was performed using UPLC-Q-ToF/MS analysis (Figs. 6–8). The assay was found to be successful with recovery values of 98.9% for TS and 99.6% for HCTZ from the tablet formulation (Table 5).
 | Table 4. Results of accuracy and precision for TS and HCTZ, respectively. [Click here to view] |
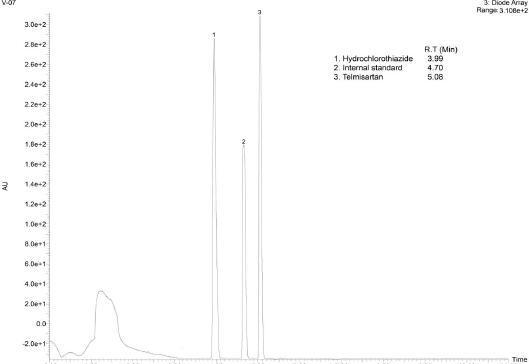 | Figure 6. Representative UPLC-DAD chromatogram of the analytes TS and HCTZ in tablet formulation. [Click here to view] |
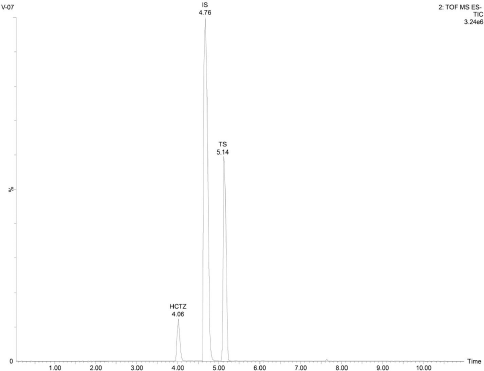 | Figure 7. Representative total ion chromatogram of the analytes TS and HCTZ in tablet formulation. [Click here to view] |
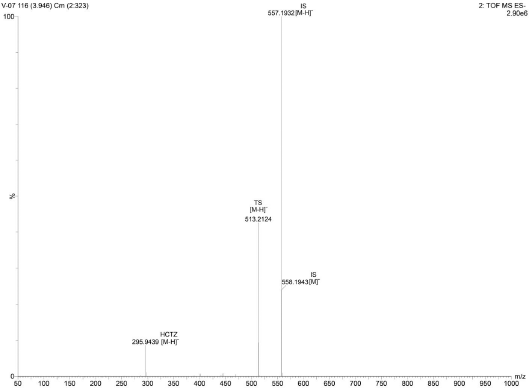 | Figure 8. Representative time of flight mass spectrum of the analytes TS and HCTZ in tablet formulation. [Click here to view] |
 | Table 5. Assay results for TS and HCTZ from tablet formulation. [Click here to view] |
 | Table 6. Table representing the values of system suitability parameters. [Click here to view] |
Summary of system suitability parameters
The developed UPLC-QToF/MS method was found to be suitable for analysing TS and HCTZ using OLM as internal standard in tablet formulations (Table 6).
CONCLUSION
A simple, accurate, rapid, and sensitive UPLC-Q-ToF/MS method was developed and validated for its application in the simultaneous assay of TS and HCTZ in combinational tablet formulation utilizing olmesartan medoxomil as internal standard. This method could be considered as the method of choice for the analysis of TS and HCTZ owing to its simple extraction procedure from the tablets and rapid analysis. Besides this, the accurate and sensitive properties of this method could reduce the quantity of sample to be taken for extraction, as low as 1 ng. Overall, this method was found suitable for the industrial and laboratory analysis of TS and HCTZ in individual or in combination on a routine basis.
ACKNOWLEDGMENTS
The authors are thankful to Institute of Excellence, University of Mysuru, Mysore for providing the facilities to carry the work.
AUTHOR CONTRIBUTIONS
All authors made substantial contributions to conception and design, acquisition of data, or analysis and interpretation of data; took part in drafting the article or revising it critically for important intellectual content; agreed to submit to the current journal; gave final approval of the version to be published; and agree to be accountable for all aspects of the work. All the authors are eligible to be an author as per the international committee of medical journal editors (ICMJE) requirements/guidelines.
FUNDING
There is no funding to report.
CONFLICTS OF INTEREST
The authors report no financial or any other conflicts of interest in this work.
ETHICAL APPROVALS
This study does not involve experiments on animals or human subjects.
PUBLISHER’S NOTE
This journal remains neutral with regard to jurisdictional claims in published institutional affiliation.
REFERENCES
Burnier M, Maillard M. The comparative pharmacology of angiotensin II receptor antagonists. Blood pressure. Supplement, 2001; 1:6–11. CrossRef
Bhatia NM, Shinde HV, Bhatia MS, Choudhari PB, Ingale KB. Development and validation of spectrophotometric and ion pair chromatographic techniques for estimation of telmisartan and hydrochlorothiazide. ARS Pharmaceutica, 2010; 51(3):145–54.
Duarte JD, Cooper-DeHoff RM. Mechanisms for blood pressure lowering and metabolic effects of thiazide and thiazide-like diuretics. Expert Rev Cardiovasc Ther, 2010; 8(6):793–802. CrossRef
Duza MB, Kumar SA, Kumar GV, Saka VP, Malik N. Method development and validation for simultaneous estimation of hydrochlorothiazide and telmisartan in Bi-layered tablet dosage form by RP-HPLC. Indo Am J Pharm Res, 2015; 5(1):303–25.
Han JY, Kim YJ, Kim L, Choi SJ, Park IS, Kim JM, Chu YC, Cha DR. PPARγ agonist and angiotensin II receptor antagonist ameliorate renal tubulointerstitial fibrosis. J Korean Med Sci, 2010; 25(1):35–41. CrossRef
Herman LL, Bashir K. Hydrochlorothiazide. StatPearls, Treasure Island, FL, 2020.
ICH harmonised tripartite guideline. Validation of analytical procedures: text and methodology. Q2R1, 2005.
Ilango K, ShijiKumar PS. Simultaneous estimation of telmisartan and hydrochlorothiazide in pharmaceutical dosage form. Asian J Pharm Health Sci, 2011; 1(1):12–5.
Kannappan N, Mahendra kumarr CB. Analytical method development and validation for the determination of hydrochlorothiazide, amlodipine besylate and telmisartan hydrochloride in multicomponent tablet dosage form and in biorelevant media (FaSSIF) by RP-HPLC techniques. Int J Pharm Pharm Sci, 2015; 7(1):218–25.
Katzung BG. Basic and clinical pharmacology. Mc Graw Hill, New York, NY, 2012.
Merck Index. Merck & Co., Inc., Whitehouse Station, NJ, 2001.
Negro A, De Marco L, Cesario V, Santi R, Boni MC, Zanelli M. A case of moderate sprue-like enteropathy associated with telmisartan. J Clin Med Res, 2017; 9(12):1022–25. CrossRef
Rane VP, Sangshetti JN, Shinde DB. Simultaneous high-performance liquid chromatographic determination of telmisartan and hydrochlorothiazide in pharmaceutical preparation. J Chromatogr Sci, 2008; 46(10):887–91. CrossRef
Sasidhar RL, Vidyadhara S, Deepti B, Tejaswi K, Suhasini J. Development and validation of RP-HPLC method for the simultaneous determination of hydrochlorothiazide, amlodipine besylate and telmisartan in bulk and pharmaceutical formulation. Orient J Chem, 2014; 30(4):1815. CrossRef
Schumacher H, Mancia G. The safety profile of telmisartan as monotherapy or combined with hydrochlorothiazide: a retrospective analysis of 50 studies. Blood Pressure, 2008; 17(1):32–40. CrossRef
Sharpe M, Jarvis B, Goa KL. Telmisartan: a review of its use in hypertension. Drugs, 2001; 61(10):1501–29. CrossRef
Unger T. Significance of angiotensin type 1 receptor blockade: why are angiotensin II receptor blockers different. Am J Cardiol, 1999; 84(10):9–15. CrossRef
Wellington K, Faulds DM. Valsartan/hydrochlorothiazide. Drugs, 2002; 62(13):1983–2005. CrossRef
World Health Organization. WHO model lists of essential medicines. World Health Organization, Geneva, Switzerland, 2019.