
INTRODUCTION
Chemical stability of pharmaceutical molecules is a matter of great concern as it affects the safety and efficacy of the drug product. Stability-indicating methods are quantitative analytical methods based on the characteristic properties of active ingredients of a drug product and distinguishes each active ingredient from their degradation products, so that the content of active ingredient can be accurately measured (Blessy et al., 2014; Henry et al., 2016).
Ulipristal acetate (UPA), chemically known as [17α-acetoxy-11β-(4-N, N-dimethyl amino-phenyl)-19-norpregna-4,9-diene-3,20-dione] (Fig. 1), is a selective modulator of progesterone receptor. It is an emergency contraceptive also used for uterine fibroids. Its major role is involved in avoiding pregnancy, birth control failure, or unprotected sex. It is not intended to be used for birth control on a daily basis. Contraceptive mechanism involves the prevention of ovulation during menstrual cycles (Gong and Zhu, 2015). It precludes the binding of progesterone to the receptor leading to the occlusion of gene transcription inhibiting the synthesis of proteins necessary to start and sustain the pregnancy (Bari et al., 2015). It is whitish to yellowish amorphous powder with less water solubility and high solubility in methanol, acetone, and chloroform. The drug was approved by the European Commission in May 2009 for marketing as an emergency contraceptive within 5 days or 120 hours of unprotected sexual intercourse. The United States Food and Drug Administration (US-FDA) approved its use in the Unites States in 2010.The drug is marketed by the trade name ‘ellaOne’ in the European Union and Ella in the US (Haeger et al., 2018). It is included in the Indian Pharmacopoeia (IP Volume III, 2018) and British National Formulary (BNF 2014) and in the essential medicines list of the World Health Organization (2019), which is considered as the most effective and safest medicines needed for a healthcare system.
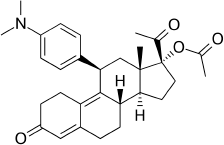 | Figure 1. Structure of UPA. [Click here to view] |
High performance thin-layer chromatography (HPTLC) has emerged as an important tool for the analysis of various drugs and its substance.. Due to several advantages, such as low running costs, high sample performance, it has become a standard analytical technique nowadays. The key benefit of HPTLC is that, unlike high-performance liquid chromatography (HPLC), it runs multiple samples using minimum mobile phase, thereby decreasing the cost per study and processing time (Abdel et al., 2014; Dhaneshwar, 2015; Zanwar et al., 2020; Zlatkis and Kaiser, 2011).
Different analytical methods were reported regarding UPA estimation, including spectrophotometric method (Bari et al., 2015; Gorumutchu and Ratnakaram, 2019), the HPLC method (Gong and Zhu, 2015), degradation studies on the HPLC method (Rao et al., 2019), and HPTLC (Kamdar and Desai, 2020). Separation of natural deuterium isotopologue by HPLC and its structural characterization is carried out through nuclear magnetic resonance (NMR) and mass spectroscopy (MS) (Béni et al., 2014). Therefore, the main objective of current study was to develop a sensitive and responsive stability-indicating method of HPTLC for UPA by using mobile phase dichloromethane: methanol (9.5:0.5; v/v), in accordance with the International Conference on Harmonization (ICH) guidelines.
MATERIALS AND METHODS
Materials
UPA was obtained as a generous gift from Mylan Laboratories Ltd, Telangana, India. FibristalTM (5 mg label claim by Akumentis Healthcare Ltd) was purchased from local retail pharmacy. Analytical grade solvents, viz. methanol and dichloromethane, were purchased from Merck Millipore (Mumbai, India).
Standard solution preparation
Stock solution was prepared by accurately weighing UPA (10 mg) and dissolving it in 10 ml of methanol (concentration 1,000 μg ml−1). It was further diluted 10 times with methanol to get the concentration of 100 μg ml−1 and further a 20–150 ng/spot concentration range was applied on thin layer chromatography (TLC) plate with Linomat V autosampler.
Sample solution preparation
The average weight of 20 tablets of FibristalTM was calculated and finely powdered. The quantity equivalent to 10 mg of UPA was taken and dissolved in 10 ml methanol; the content was sonicated for 15 minutes before being centrifuged at 2,000 rpm for 5 minutes. The supernatant was then analyzed on TLC plate for drug content of 90 ng/spot.
Chromatographic conditions
The prepared samples of UPA and its marketed preparation were spotted as 8 mm bandwidth on precoated silica gel 60 F254, aluminum plates (20 × 10 cm with 250 μm thickness; E. Merck, Germany) using Camag Linomat V autosampler consisting of Camag microliter syringe (Switzerland). Methanol was employed for prewashing the plates, followed by activation for 5 minutes before chromatographic application. Twin trough glass chambers (Camag) were saturated using saturation pads for 20 minutes, using mobile phase dichloromethane: methanol (9.5:0.5, v/v). Migration time was 15 minutes covering migration distance of 7 cm. The densitogram scanning was carried out at 312 nm on Camag TLC scanner III, vision CATS version 2.5.18262.1 software. The deuterium lamp was utilized as source of UV radiation between 200 and 400 nm.
Analytical method validation
Linearity and range
Standard solution of the drug in the range of 30–150 ng/spot was applied on plate for the development and then analyzed to evaluate linearity (as per guidelines of ICH 5 spots were spotted). The calibration curve was plotted for peak area vs. drug concentration with the help of vision CATS software and the analysis of linear regression was carried out.
Sensitivities [limit of detection (LOD) and limit of quantification (LOQ)]
Method sensitivities were determined in terms of LOD and LOQ. LOD indicates the minimal amount of an analyte that can be identified but not normally quantified, whereas LOQ is the minimal quantity of the drug, which is estimated with proper precision and accuracy. The LOD and LOQ were calculated by using the following formula as per ICH guidelines:
where ‘σ’ is the standard deviation of linear responses based on the calibration curve and ‘S’ is the slope of the calibration curve. Standard deviation is calculated through the residual value between a set of observed and predicted values shown by points in a regression analysis.
Accuracy
The accuracy of the analysis is presented as the percentage recovery and was carried out by spiking 80%, 100%, and 120% of the standard drug to the formulation by standard addition method in triplicates.
Precision
Three different concentrations of UPA (70, 90, and 110 ng/spot) were applied and analyzed for intraday and interday precision.
Specificity
Specificity is the capability of a method to identify the analyte when other components are expected to present. It was determined by checking the interference of the drug with the diluent and mobile phase. For this standard solution and sample solution of ulipristal (each having 90 ng/spot), mobile phase and diluent was applied on the plate and chromatographic run was assessed.
Degradation study
Forced degradation studies provide the approach to analyze the stability of drug samples. The ICH guidelines that are applicable to forced degradation studies are ICH Q1A (stability testing of new drug substances and products) and ICH Q1B (photostability testing of new drug substances and products).
Acid and alkaline degradation
Acid degradation study was carried out by dissolving the drug in 0.1 N methanolic hydrochloric acid solution to get the stock solution of 1 mg ml−1 concentration and refluxing it at 60°C in dark for 1 hour to avoid any possible side effects of light. However, alkaline degradation of UPA was carried out for the concentration of 1 mg ml−1 using 0.01 N methanolic sodium hydroxide solution for 15 minutes in the dark. Solution was applied on a precoated plate of TLC after dilution to achieve concentration of 100 ng/spot and then chromatogram was run.
Oxidative degradation
Drug solution of concentration 1 mg ml−1 was prepared with methanol and solution was exposed to 10 ml of 6% v/v H2O2 at room temperature for 1 hour inthe dark, after dilution it was applied on the precoated TLC plate to get 100 ng/spot.
Thermal and photochemical degradation
For thermal degradation, UPA (10 mg) was kept in oven at 60°C for 4 hours, and its 1 mg ml−1 solution was prepared in methanol and analyzed on a precoated plate of TLC to get a concentration of 100 ng/spot. While for photochemical degradation study, the drug was exposed in direct sunlight for 48 hours, after subsequent dilutions with methanol it was applied on plate to get concentration of 100 ng/spot.
RESULT AND DISCUSSION
Method development and validation
The HPTLC method was optimized for developing stability indicating method, using dichloromethane: methanol (9.5:0.5, v/v) as mobile phase, a sharp and symmetrical peak of UPA was observed with retention factor (Rf) of 0.60 ± 0.02 (Fig. 2). The current guidelines of the ICH Q2 (R1) were adopted for method validation.
Linearity
Calibration curve of UPA (Fig. 3 and Fig. 4) exhibited linear correlation between peak area and concentration in the range of 30–150 ng/spot (five data points). The regression data of graph was found to be linear with best correlation r2 ≥ 0.998 (Table 1).
LOD and LOQ
The findings of LOD and LOQ regarding UPA were 9.577 and 29.022 ng/spot, respectively (Table 1).
Accuracy
Accuracy was calculated in terms of % recovery at each addition level with % relative standard deviation (RSD) (Table 2). The mean percentage recovery was determined as 98.56%.
Precision
Three concentrations (70, 90, and 110 ng/spot) of the drug were analyzed in triplicates for performing repeatability and interday precision. The consequence of the repeatability indicates no significant variation in intraday (%RSD = 1.14) and interday (%RSD = 1.68). The values were within the acceptable range (Table 1).
Analysis of marketed formulation
Densitogram of marketed tablet of UPA (FibristalTM) revealed only one spot at Rf 0.60 showing no interference from excipients of the tablet. The experimental finding regarding amount of ulipristal in tablets was estimated to be 99.6% which showed good conformity with label claim of tablet (5 mg per tablet), thereby re-emphasizing the fact of no interference with any excipients and indicating the method suitability for routine analysis of ulipristal and its formulation.
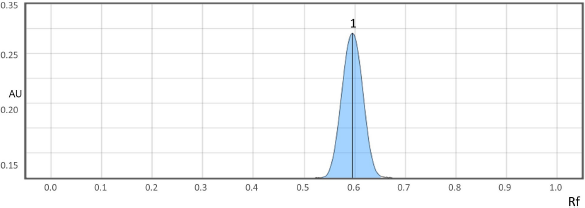 | Figure 2. Densitogram of UPA (Rf = 0.60 ± 0.02) at 312 nm. [Click here to view] |
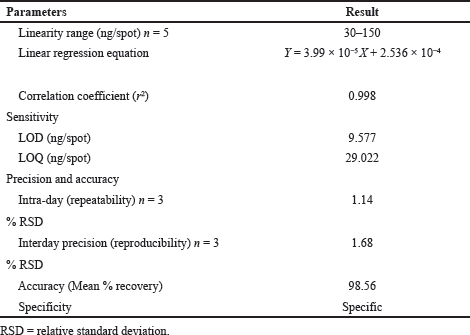 | Table 1. Summary of the HPTLC method validation parameters. [Click here to view] |
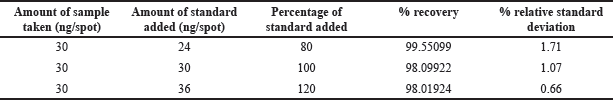 | Table 2. Accuracy studies of UPA. [Click here to view] |
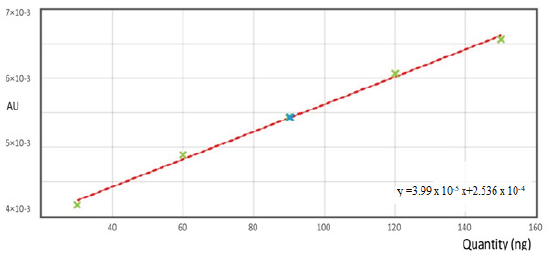 | Figure 3. Linearity graph of UPA. [Click here to view] |
Degradation studies
The UPA exhibited varied degradation pattern under different stress conditions.
Acidic degradation
In acidic degradation, two degradants were observed at Rf 0.49 and 0.83 along with peak of UPA (Fig. 5A).
Alkaline degradation
In alkaline degradation, seven degradation products were resolved having Rf value of 0.01, 0.03,0.30, 0.39, 0.45, 0.50, and 0.86, as shown in Fig. 5B, along with drug peak with 20.20% degradation.
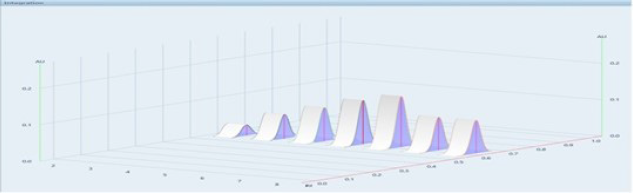 | Figure 4. 3D view densitogram of UPA (standard: 30, 60, 90, 120, 150 ng/ spot; track 2–6) (sample: two spots of 90 ng/spot; track 7 and 8). [Click here to view] |
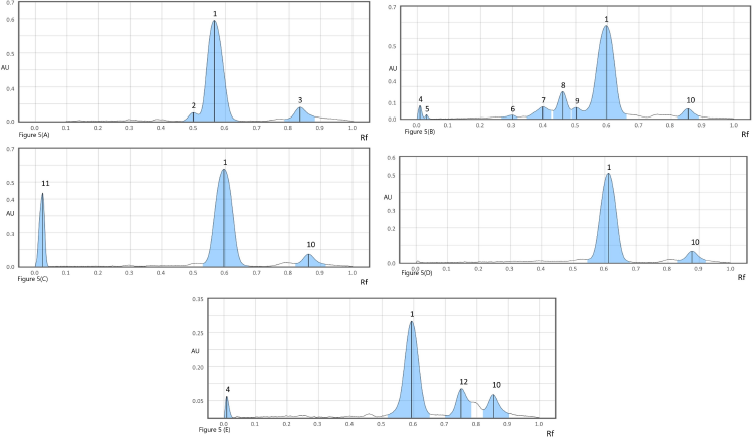 | Figure 5. (A) Densitogram of acid degradation: peak 1 (ulipristal Rf: 0.58), peak 2 (degradant Rf: 0.49), and peak 3 (degradant Rf: 0.83); (B) densitogram of base degradation: peak 1 (ulipristal), peak 4 (degradant Rf: 0.01), peak 5 (degradant Rf: 0.03), peak 6 (degradant Rf: 0.30), peak 7 (degradant Rf: 0.39), peak 8 (degradant Rf: 0.45), peak 9 (degradant Rf: 0.50), and peak 10 (degradant Rf: 0.86); (C) densitogram of peroxide degradation: peak 1 (ulipristal Rf: 0.58), peak 11 (degradant Rf: 0.04), and peak 10 (degradant Rf: 0.86); (D) densitogram of thermal degradation: peak 1 (ulipristal Rf: 0.61) and peak 10 (degradant Rf: 0.86); (E) densitogram of photochemical degradation: peak 1 (ulipristal Rf: 0.59), peak 4 (degradant Rf: 0.01), peak 12 (degradant Rf: 0.75), and peak 10 (degradant Rf: 0.86). [Click here to view] |
Oxidative degradation
UPA was susceptible to oxidative degradation amounting to 17.25% of the degradation and the degradants were identified at Rf 0.04 and 0.86 (Fig. 5C).
Thermal degradation
Thermal degradation at 60°C up to 4 hours resulted in 10.02% degradation, the degradant was resolved at Rf 0.86 (Fig. 5D), which was same as obtained in alkaline and peroxide induced degradation study.
Photochemical degradation
Photochemical degradation led to 19.29% degradation, with three peaks at Rf 0.01, 0.75, and 0.86, as shown in Fig. 5E. One degradant at Rf 0.86 was common in all degradation studies except in acidic degradation. The outcome of the degradation studies is summarized in Table 3.
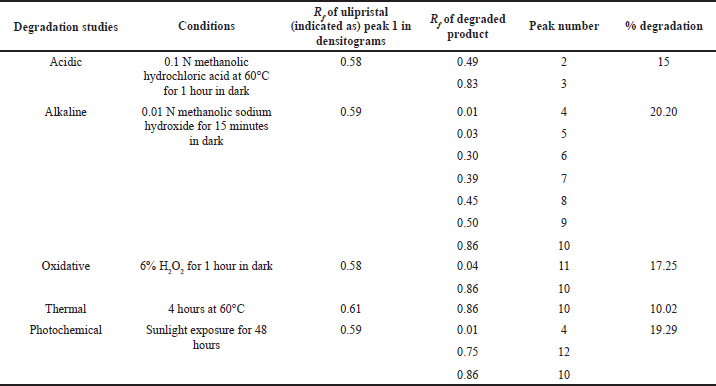 | Table 3. Degradation study of UPA. [Click here to view] |
CONCLUSION
A sensitive stabilty indicating HPTLC method was developed and validated successfully according to ICH guidelines for estimating UPA in the presence of its degradants obtained by forced degradation. The method resolved total 10 degradants in various degradation media. The experimental findings revealed an unstable behavior of UPA under alkaline condition as it degraded completely under strong alkaline condition in a very short span of time. It was found sensitive to acidic and oxidative conditions as well and showed labile nature in light. One degradant (peak 10) with Rf of 0.86 was nearly found in every type of degradation except acidic degradation. The developed method was found to be sensitive, responsive, and specific. So, this method could be of great commercial value for the industries regarding routine analysis of drug and its formulations for stability studies.
ACKNOWLEDGMENTS
The authors thank Mylan Laboratories Ltd, Telangana, India, who provided the gift sample of standard UPA, and Mr. Dilip Charegaokar of Anchrom Laboratory, Mumbai, for providing the instrumental facilities for the work to be carried out.
CONFLICT OF INTEREST
The authors do not have any conflict of interest to declare.
FUNDING
This research did not receive any funding to report.
ETHICAL APPROVAL
This work does not involve studies on animals or human subjects.
AUTHORS’ CONTRIBUTIONS
All authors have made substantial contributions to the paper. They took part in study design, data analysis, drafting, revising the manuscript for important intellectual content, and gave approval for the final version of the manuscript.
REFERENCES
Abdel-Aziz O, Farouk M, Nagi R, Abdel-Fattah L. Simple spectrophotometric and HPTLC-densitometric methods for determination of cefdinir in bulk powder and pharmaceuticals, and in presence of its hydrolytic degradation products. J Appl Pharm Sci, 2014; 4(7):129.
Bari AK, Prajapati PR, Modi VS, Desai SS. Development, and validation of UV spectrometric method for quantitative determination of ulipristal acetate. Int J Pharm Sci, 2015; 7(7):451–3.
Béni Z, Orgoványi J, Kóti J, Sánta C, Horváth J, Mahó S, Szántay Jr C. Detection by HPLC and structural characterization by NMR and MS of a natural deuterium isotopologue of ulipristal acetate. J Pharm Biomed Anal, 2014; 98:279–86. CrossRef
Blessy MR, Patel RD, Prajapati PN, Agrawal YK. Development of forced degradation and stability indicating studies of drugs—a review. J Pharm Anal, 2014; 4(3):159–65. CrossRef
Dhaneshwar SR. Pharmaceutical applications of high-performance thin layer chromatography. In: Instrumental thin-layer chromatography. Elsevier, Amsterdam, The Netherlands, pp 451–78, 2015. CrossRef
Gong A, Zhu X. Dispersive solvent-free ultrasound-assisted ionic liquid dispersive liquid–liquid microextraction coupled with HPLC for determination of ulipristal acetate. Talanta, 2015; 131:603–8. CrossRef
Gorumutchu GP, Ratnakaram VN. Extractive spectrophotometric determination of ulipristal acetate using naphthol blue black. Res J Pharm Technol, 2019; 12(3):1347–52. CrossRef
Haeger KO, Lamme J, Cleland K. State of emergency contraception in the US, 2018. Contracept Reprod Med, 2018; 3(1):1–2. CrossRef
Henry TR, Penn LD, Conerty JR, Wright FE, Gorman G, Pack BW. Best practices in stability indicating method development and validation for non-clinical dose formulations. AAPS J, 2016; 18(6):1418–23. CrossRef
Kamdar G, Desai S. Optimization and validation of HPTLC method for estimation of ulipristal acetate in presence of its forced degradation products. J Chromatogr Sci, 2020; 58(5):427–32. CrossRef
Rao AL, Alimunnisa D, Lakshmi GV, Vani VB. Development and validation of stability indicating HPLC method for the determination of ulipristal acetate in pharmaceutical dosage form. Int J Res AYUSH Pharm Sci, 2019; 2:321–7.
World Health Organization. World Health Organization model list of essential medicines: 21st list 2019. World Health Organization, Geneva, Switzerland, 2019.
Zanwar AS, Sen DB, Maheshwari RA, Chandrakar VR, Seth AK, Sen AK. Simultaneous analysis of mometasone furoate, miconazole nitrate, and nadifloxacin in cream formulation by HPTLC. J Appl Pharm Sci, 2020; 10(07):108–15.
Zlatkis A, Kaiser RE. HPTLC-high performance thin-layer chromatography. Elsevier, Amsterdam, The Netherlands, 2011.