INTRODUCTION
The rapid increase in the generation of environmentally hazardous waste worldwide has aroused the need to conserve our environment in all aspects. Pharmaceutical industries generate many environmental hazards waste, and one among them is the analytical waste generated by the solvents and chemicals used with high performance liquid chromatography (HPLC).
The development of a greener HPLC method should ensure two main criteria, the first being method performance characteristics such as sensitivity, selectivity, accuracy, and precision, while the subsequent one is the greenness profile such as safety of reagents, absence of derivatization, minimal energy consumption, low waste generation, and recovery of chemicals from the waste (Armenta et al., 2008; Koel and Kaljurand, 2006; Koen et al., 2010).
Few strategies impart virtuous knowledge about the choice of greener chemicals for the development of such greener analytical methods (Galuszka et al., 2013; Pena-Pereira et al., 2015; Plotka et al., 2013; Tobiszewski et al., 2010; Welch et al., 2010). Although greener analytical techniques have several advantages its use is very limited in the routine quality control process in pharmaceutical industry. The implementation of greener HPLC methods benefits operator safety, harmless to environment and much more.
Rosuvastatin calcium (RC) (Fig. 1) is calcium salt of (3R, 5S, 6E)-7-[4-(4-Fluorophenyl)-6-6(1-methylethyl)-2-[methyl (methylsulfonyl) amino]-5-5pyrimidinyl]-3, 5-digydroxy-6hepanoic acid (Williams, 2006). RC is used as hyperlipaedamic drug and exerts its action by inhibiting the enzyme hydroxy methyl glutaryl-coenzyme A reductase, which is essential for the biosynthesis of cholesterol (Brunton et al., 2011). The intended work boons a new HPLC method through less perilous solvent ethanol, which is supposed to be an eco-friendly option to methanol and acetonitrile. The proposed work also stress on the ease of switching traditional mobile phases by less harmful chemicals and greener solvents without altering method performance. Different analytical procedures do not reveal a comparable level of greenness, and hence there arises a need to assess the greenness profile of an analytical method. Greenness evaluation tools such as analytical eco scale and Analytical Greenness (AGREE) Metric Approach and Software tool used to study the level of greenness.
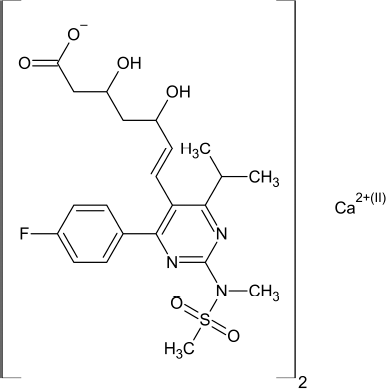 | Figure 1. Chemical structure of RC. [Click here to view] |
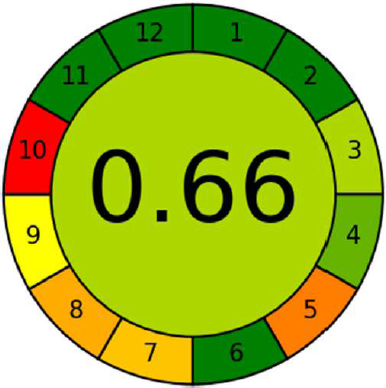 | Figure 2. Agree metrics output including 12 principles of green chemistry with overall score in the middle. [Click here to view] |
The analytical eco scale (Galuszka et al., 2012) built on allotting the penalty points based on the number of pictogram with its signal words given by “The Globally Harmonized System of Classification and Labelling of Chemicals”, along with its quantity. Analytical Eco scale methodology includes every reagent, its kind and quantity, potential occupational exposure, and energy depletion, including waste. The penalty points deducted from the base of 100.
Analytical Eco-scale = 100 − total penalty points (1)
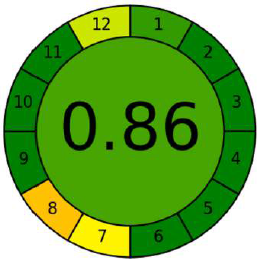
The second assessment methodology employ AGREE metrics (Pena-Pereira et al., 2020), a novel software for measuring the greenness profile. The results of this software are depicted in the form of a circular diagram, carrying numbers at the edge from 1 to 12 in clockwise direction. Each of these numbers denote the 12 ideologies of green analytical chemistry. The outcomes from each of these 12 principles, are made on an aggregate scale ranging from 0 to 1, considering the provided inputs and their weightage. This aggregate scale is colour coded as red, yellow, and green, where red indicates the value zero while dark green indicates a value of one or close to one and yellow in between red and dark green. The result from all the 12 principles and the core gives the score indicative of the extent of greenness (Fig. 2).
Implementation of quality by design (QbD) in developing greener analytical methods provides valuable knowledge about the use of greener chemicals and their impact on method performance. The International Council for Harmonisation of Technical Requirements for Pharmaceuticals for Human Use (ICH) guidelines (ICH Q8) (ICH Q8(R2), 2009) define the concept of QbD as “a systematic approach to development that begins with predefined objectives and emphasizes product and process understanding and process control, based on sound science and quality risk management.” The idea of analytical quality by design (AQbD) defines the quality of analytical target profile (ATP), recognition of critical quality attributes (CQA’s), and critical analytical attributes (CAA’s), optimization of CQA’s using design of experiments (DOE) for the best chromatographic parameters.
The outcome of literature review puts fourth numerous analytical methods like UV spectrophotometry, spectrofluorimetry, capillary zone electrophoresis, mercury drop electrode, highly sensitive enzyme linked immune sorbent assay, HPLC, high performance thin layer chromatography, and liquid chromatographic couples with tandem mass spectrophotometry [liquid chromatography-mass spectrometry (LC-MS)/MS] were reported for the assessment of RC as lone component and in combination with other drugs (Angelo et al., 2018; Rajput et al., 2018). The HPLC methods (Balakumar et al., 2013; Balanagamani et al., 2017; Caglar and Toker, 2013; Chirag et al., 2010; Divya and Prabhakar, 2016; Dudhipala and Veerabrahma, 2017; Haq et al., 2018; Hemant Kumar et al., 2015; Jana and Mahanti, 2020; Kaila et al., 2010; Kumar et al., 2006; Lakshmana Rao and Suneetha, 2010; Moid et al., 2018; Mostafa et al., 2014; Nazir et al., 2016; Sailaja and Sravana Kumari, 2019; Zahi and Khatatbeh, 2014) pertaining to the assessment of RC as single component revealed AQbD aided stability indicating green HPLC method was not reported for the estimation of RC by HPLC; subsequently, the proposed method is the first-ever study reporting AQbD aided stability-indicating green RP-HPLC method for the assessment of RC.
The prime focus of the proposed method is to develop a simple, green and stability-indicating reverse phase high performance liquid chromatography method for the determination of RC in tablet formulation. The most commonly used organic solvents such as acetonitrile and methanol should be minimized due to their issues and health safety; acetonitrile is flammable, volatile, and toxic, while methanol even though less toxic and more easily biodegradable than acetonitrile it is also ranked as hazardous solvent due to its inherent toxicity and waste disposal (ICH Q3C (R8), 2021). It was further considering the environmental impact relating to the use of organic solvents commonly used in chromatographic methods has received significant interest in analytical chemistry.
The greenest organic solvent primarily suitable for green liquid chromatography is the ethanol (Plotka et al., 2013; Sheldon, 2012). The inhaled amount of ethanol is less due to its lower vapour pressure when associated with methanol and acetonitrile, which have higher vapour pressure that subsequently infers less toxicity of ethanol. Furthermore, in terms of selectivity, ethanol is in the same group as that of methanol as Snyder's classification of organic solvents. The prime drawback of ethanol is that it engenders high pressure in the HPLC system due to its viscosity compared with acetonitrile and methanol, which shall be sorted out by increasing the column temperature (Plotka et al., 2013).
MATERIALS AND METHODS
Active pharmaceutical ingredient and tablet formulation
RC of 99.68% w/w purity was procured from Ideal Analytical and Research Institution (Puducherry, India). Tonact®10 with a label claim of 10 mg of RC were procured from the local retail pharmacy.
Chemicals and materials
Premium grade Ethanol (100%) purchased from Hayman Group Ltd. East Ways Park Witham, UK, which conforms to monographs of British Pharmacopoeia, European Pharmacopoeia and United States Pharmacopoeia suitable for HPLC. Acetic acid of HPLC grade, analytical reagent grade hydrochloric acid, sodium hydroxide, hydrogen peroxide was from SRL Pvt. Ltd. HPLC grade methanol from Finar, Ahmedabad, India. Water for HPLC using Milli-Q Plus water purification system (Millipore, Milford, MA).
Apparatus and accessories
Analytical balance AY220 (Shimadzu Corporation, Japan), Digital pH meter model 111 (Electronics India), Sonicator (GT Sonic, India), UV light chamber (Newtronic NLPS4SI, India), Hot air Oven TC70 (Industrial and Laboratory tools corporation, India), 0.45μm nylon membranes, and 0.45μm nylon syringe filter (Millipore, India).
Instrument
The Agilent 1220 Infinity Gradient LC System (Product No.G4294B) with a dual-channel gradient pump with the integrated degassing unit, autosampler, column compartment, and the diode array detector. The data were acquired and processed using Agilent Open LAB CDS Chem Station Edition for LC and LC-MS Systems, Rev. C.01.07 SR3[465]. Agilent Open LAB CDS 3D UV Add-On Software.
Statistical analysis
General statistical measures like linear regression analysis, standard deviation, mean, relative standard deviation were obtained by working with Microsoft excel 2013 software. The response surface optimization with analysis of variance (ANOVA), construction of perturbation plot, 3D response surface plot etc., were performed through Design expert software version 11. With the trial edition of statistical process control for Excel, the Bartlett test was applied to data of areas of linearity for estimation of homoscedasticity of variance and deviation from linearity.
Preparation of diluent
The diluent was prepared by mixing HPLC grade water and ethanol in the proportion of 2:98 v/v and favours solubility.
Preparation of standard solutions
A standard stock solution of RC (1,000 μg ml−1) was prepared with the diluent; appropriate dilutions were made with the diluent to attain a concentration of 100 μg ml−1.
Method development
Initial chromatographic conditions
The column used is Agilent ZORBAX Eclipse plus C18 (4.6 × 150 mm, 5 μm). The mobile phase consisted of 0.5% v/v acetic acid and ethanol (52:48 v/v). The mobile phase was prepared, followed by filtration through a 0.45 μm nylon membrane filter and sonicated for 15 minutes. The flow rate of the mobile phase is 1 ml/minute, and the column temperature is maintained at 40 ± 0.5°C. The injection volume was 5 μl, while detection was made at 246 nm (Peraman et al., 2015).
Implementation of QbD
Step 1: ATP. The perfect description of ATP is the prime objective in method development. The ATP was to develop an ecofriendly HPLC method using green chemicals used to analyze RC in tablet formulation with no intrusion from the sample matrix and degradation products. The aim of the optimized chromatographic conditions comprises the best chromatogram with reasonable retention time, a capacity factor of more than 1.5, a tailing factor closer to 1 and the maximum number of theoretical plates.
Step 2: Risk assessment. The construction of a fishbone diagram with various parameters (Fig. 3) was made, and risk analysis was performed to recognize CQA’s to be selected for further study. The setup of ATP and CAA’s works as a base for sorting out CQA’s from several experimental variables. The volume of ethanol and flow rate was established as CQAs instituted by preceding expertise and preliminary screening. The response variables (CAA’s) were a capacity factor, tailing factor, and theoretical plates.
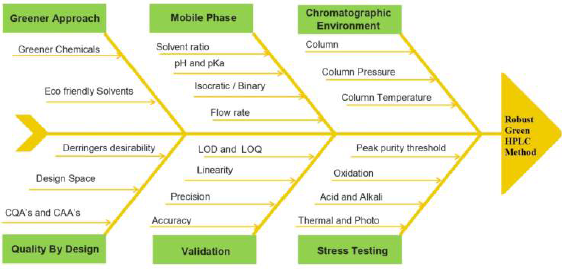 | Figure 3. Fishbone diagram for selection of variables. [Click here to view] |
Step 3: Performing experimental design. This stage involves the implementation of method development trails and choosing appropriate arrays of the CQA’s. The DOE methodology is involved in optimizing CQA’s in their specific ranges. The experimental design with the utility of response surface methodology was applied. The optimization method involves a rotatable Central Composite Design (CCD) through two factors besides 13 runs. This design is established on the CQA’s at five diverse levels (−α, −1, 0, +1, +α), needing 13 runs, including five centre points and performed twice. The replicates at the centre point are to find reproducibility, increase the experimental design’s power, and know the pure error. The coded levels and their actual values are presented in Table 1.
Step 4: Assessment of experimental results and optimization of the method. The results obtained were subjected to statistical analysis through Design expert software version 11. The statistical tools like predicted versus actual plot, ANOVA, lack of fit, prediction equations, 3D plot, and contour plot were used to analyze each response (CAA’s), and design space was created.
Step 5: Describing the analytical method performance strategy. The proper understandings of method performance with diverse experimental settings provide brief knowledge about method control strategy. This strategy helps to deal with risk and ensure that the method conveys expected quality attributes.
System suitability
System suitability was established on a standard solution of 100 μg ml−1 and injecting in sextuplicate. The % relative standard deviation (RSD) was calculated for peak area, retention time, capacity factor, tailing factor, and theoretical plates.
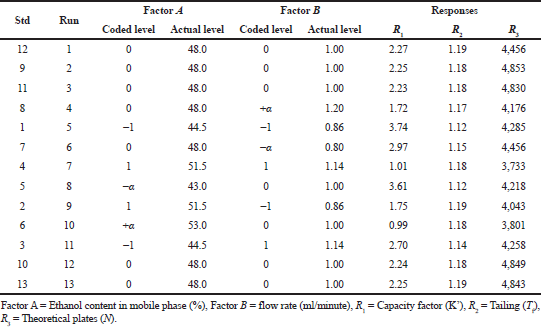 | Table 1. Rotatable CCD experimental design with levels and their measured responses. [Click here to view] |
Solution stability
The standard solution of RC was kept at room temperature and assessed at 0, 6, 18, and 24 hours. The stability was measured by % assay value with that of freshly made standard solutions.
Method validation
Validation accompanied ICH guidelines (ICH Q2 (R1), 2005).
Specificity
RC stock solution (1,000 μg ml−1) was utilized for degradation studies. The solutions of stressed samples were matched to the standard solution of 100 μg ml−1. The drop in peak area or the presence of degradant peak was used to calculate the quantum of degradation and evaluated by % recovery.
Acid degradation. The acid degradation study was made with 1 M hydrochloric acid (HCl). 10 mg of RC was weighed accurately and transferred to 10 ml volumetric flask, 5 ml diluent was added, followed by 1 ml of 1M HCl and kept aside in the dark at room temperature for 1 hour, then neutralized with 1 ml of 1M sodium hydroxide (NaOH) and the volume completed to 10 ml with diluent and then diluted appropriately to obtain a concentration of 100 μg ml−1.
Alkali degradation. The alkali degradation study was performed with 1 M NaOH. 10 mg of RC were weighed exactly then moved to 10 ml volumetric flask, 5 ml diluent was added followed by 1 ml of 1M NaOH and kept aside in the dark at room temperature for 12 hour, neutralized with 1 ml of 1 M HCl and the volume completed to 10 ml with the diluent and then diluted appropriately to obtain a concentration of 100 μg ml−1.
Oxidative degradation. The oxidative degradation study was performed with 10% v/v hydrogen peroxide, 10 mg of RC were weighed exactly and moved to 10 ml volumetric flask, 5 ml diluent was added followed by 1 ml of 10% v/v hydrogen peroxide and set aside in the dark at room temperature for 12 hour; furthermore, the volume completed to 10 ml with the diluent and then diluted appropriately to attain a concentration of 100 μg ml−1.
Photo degradation. The photochemical degradation was studied through exposing 100 μg ml−1 of the solution prepared in diluent and kept in UV chamber for 48 hours.
Thermal degradation. The dry powder of RC was left in an oven at 70°C for 48 hours, and the same was used to prepare a solution of 100 μg ml−1 of RC in the diluent.
All the solutions prepared for forced degradation study were injected into the HPLC system with the optimized chromatographic conditions.
Linearity. From the stock solution, aliquots of RC were taken in a 10 ml volumetric flask. A series of dilutions were made with the diluent to obtain a concentration range between 10 and 150 μg ml−1 of RC solutions were injected with the optimized chromatographic conditions. The solutions were analyzed in quintuplicate, and the calibration curve was constructed through plotting concentration versus peak area and the regression equation was computed. The homoscedasticity of the linearity was tested using Bartlett test at 95% significance level.
Sensitivity—limit of detection (LOD) and limit of quantification (LOQ)
The LOD and LOQ were calculated to establish the method’s sensitivity. The LOD and LOQ were calculated as per ICH guidelines with the following equations.
LOD = 3.3 × σ/S (2)
LOQ = 10 × σ/S (3)
σ = the standard deviation of the response
S = the slope of the calibration curve
Precision
Precision was evaluated in terms of system, intraday, and interday precision.
System Precision. System precision was evaluated by using six determinations at a concentration of 100 μg ml−1.
Method precision. Six samples of same batch RC in tablet formulation were prepared in the concentration range of 100 μg ml−1 and assessed.
Intraday and interday precision. Six samples of the same RC tablet formulation were prepared in the concentration range of 100 μg ml−1 and assessed for three consecutive days with three different analysts.
Accuracy
The accuracy was assessed at 80%, 100%, and 120% of the test concentration (100 μg ml−1) of RC by the standard addition method. The solution for accuracy studies were prepared with varying concentration of standard and equal concentration of sample with diluent to attain a concentration of 80, 100, and 120 μg ml−1 for 80%, 100%, and 120% correspondingly. The procedure for accuracy was done in triplicate for each level, and the % recovery was calculated.
RESULTS AND DISCUSSION
The preliminary phase in HPLC method development comprises plain ethanol with water as mobile phase, and the results obtained were a broad peak with too much fronting and lack of symmetry, the pKa value of RC is 4.6, which are acidic, and hence their retention in the column is pH dependant. In the next stage of method development, 0.5% v/v of acetic acid was added as a part of the mobile phase, and various trials were carried out. The selection of 0.5% v/v acetic acid along with ethanol as mobile phase in the proportion of 52:48 v/v and with a flow of 1ml/minute gave peak with ideal retention time along with good peak symmetry, low tailing, capacity factor, and theoretical plates.
CCD design
The DOE methodology in method development is far superior to the traditional approach, which involves one factor at a time that fallouts in a larger number of runs, subsequently the time, use of solvents and cost etc. In DOE methodology, factors are varied together that fastens optimization procedure along with the interaction among the selected factors, and hence total impact of the factors on the selected response.
 | Table 2. ANOVA and regression summary of models. [Click here to view] |
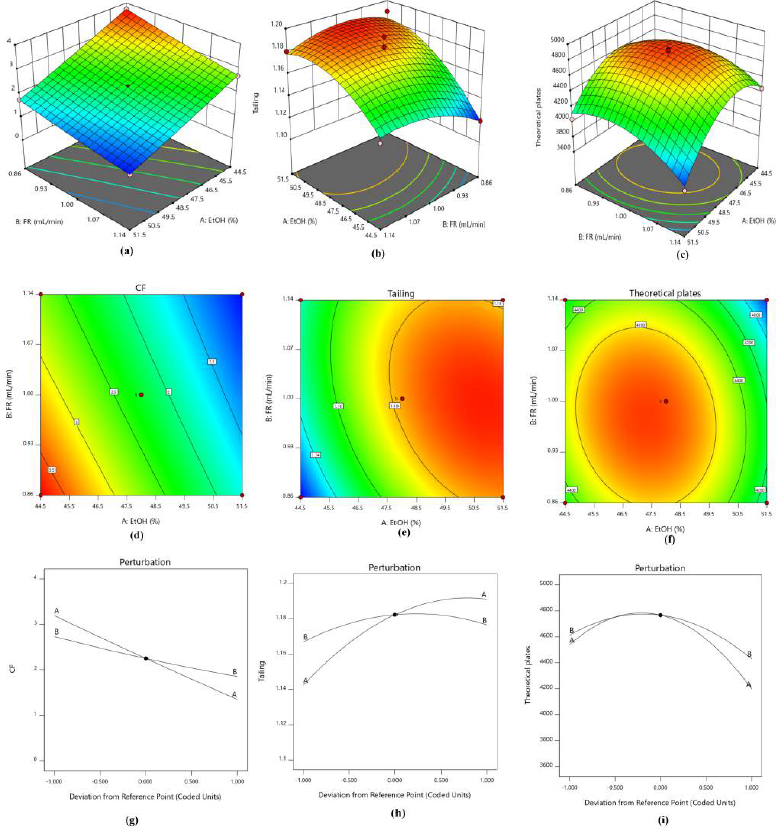 | Figure 4. (a–c) 3-D response surface plot, (d–f) 2D contour surface plot and (g–i) perturbation plot for capacity factor, tailing factor and theoretical plates respectively. [Click here to view] |
The polynomial equation with the regression coefficients of selected factors is given by
Y = β + βA + βB + βA2 + βB2 + βAB (4)
The early investigations were utilized as an indication to choose experimental assortments of the two selected CQA’s, the volume of ethanol (A) and flow rate (B) at five different levels. A rotatable CCD with two independent experimental variables at five levels was utilized to optimize CQA’s. The coded and actual values of the design, along with their results were shown in Table 1. The responses at the centre point of each factor (level zero) were repeated for five times to estimate the experimental error. The responses were the average of the runs performed in duplicate.
The significance of the experimental quadratic models was established by ANOVA, and their outcomes were shown in Table 2.
Fischer ratio (F value) used to measure the significance of each model. The F values for capacity factor, tailing and theoretical plates were presented in Table 2, and all the three models were significant with p values less than 0.0001.
The polynomial regression equations attained were evaluated based on the correlation coefficient (R2), adjusted correlation coefficient (Adj. R2) and predicted correlation coefficient (Pred. R2). The values of r2 in all the determination coefficient is neighbouring to 1 representing the data fit by the regression curve with the accuracy of not less than 99%. The difference among the adjusted r2 and predicted r2 is less than 0.2 and is in realistic agreement, whereas the value of adequate precision is more than four, which infer sufficient signal. The polynomial equations in the coded form for each model are as follows.
CF = 30.96 + −0.56 * A + −14.50 * B + 0.14 * A * B + 0.0016 * A2 + 2.10 * B2 (5)
Tailing = −3.30 + 0.14 * A + 1.81 * B −0.01 * A * B −1.24 A2 −0.52 * B2 (6)
Theoretical plates = −84,930.10 + 3,158.6204* A + 30,729.13* B −141.5 * A * B −31.92 * A2 – 12,292.5 * B2 (7)
The residual plots exhibited arbitrary dispersion of variables inside +4 to −4 with no drift, demonstrating no systematic bias or outliers. The optimization studies were carried out with the evaluation of the 3D response surface plot, 2D contour plot, and perturbation plot drawn over the whole experimental design to identify the interaction among the variables and depicted in Figure 4.
The plot presented in Figure 4a and g depicts a continuous decline in the capacity factor with an upsurge in the study levels of both the CQA’s among which the % ethanol has a more significant effect on the capacity factor when compared with flow rate. The curvature plots (Fig. 4b and c) attained for tailing factor and theoretical plates revealed that both the CQA’s were significant. The perturbation plot in Figure 4h indicates an increase in tailing factor with higher values of % ethanol while flow rate has a minimal effect. Figure 4i indicates % ethanol was predominantly more significant than that of flow rate with a decrease in the number theoretical plates for greater values of CQA’s. A similar interpretation was attained from the contour plot (Fig. 4d–f) that reinforced the conclusions drawn from response surface studies.
Analytical design space and optimized method conditions
Numerical optimization methods were applied to attain the optimal method conditions established on the stated goals and limitations for each response. In the existing study, Derringer’s desirability function was used to optimize three responses with different targets (Derringer and Suich, 1980). The desired goal for CQA’s is to minimize the volume of ethanol and to fix the flow rate in range. The goals for the responses were to maximize the number of theoretical plates that ensures higher column efficiency. In contrast, the goal for peak tailing was minimized, which produces good peak shape. The capacity factor targeted above 2.5 that ensures ideal retention of analyte with the column stationary phase. Figure 5 shows the overlay plot with an optimum region as design space and identified method conditions denoted by the flag. The predicted solutions obtained for the above-said goals were 47.30% v/v ethanol in mobile phase, a flow rate of 0.978 ml/minute, capacity factor 2.506, tailing factor 1.17, and theoretical plates 4,790 with a desirability value of 0.944. The prediction efficacy of the model was affirmed by the execution of the experiment with the optimal conditions, which yielded 2.49, 1.172, and 4,782 as the values for capacity factor, tailing factor, and theoretical plates, respectively. The % errors were 0.60 for capacity factor, 1.36 for tailing factor, and 2.46 for theoretical plates.
Optimized chromatographic conditions
The optimized chromatographic conditions for the proposed green HPLC method for the estimation of RC is obtained, which include 0.5% v/v acetic acid: ethanol (52.70:47.30 v/v) as components of mobile phase flowing at a rate of 0.978 ml/minute. The column being Agilent ZORBAX Eclipse plus C18 (4.6 × 150 mm, 5 μm) maintained at 40 ± 0.5°C. The injection volume was 5 μl, while the detection was made at 246 nm.
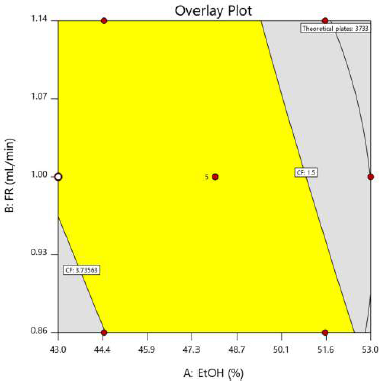 | Figure 5. The fusion QbD software design space (method operable design region) graph. [Click here to view] |
 | Table 3. System suitability test for the proposed HPLC method. [Click here to view] |
System suitability
The results of system suitability are depicted in Table 3. The % RSD obtained of the parameters like retention time, peak area, capacity factor, and tailing factor were less than 2%, and theoretical plates of more than 2,000 are a clear indication of system suitability.
Solution stability
The corresponding chromatograms for solution stability showed no degradation peak, and there was no noteworthy variation in the peak area for 24 hours. The assay results found were within ± 2% as compared with the fresh solution.
Method validation
Results of stress studies
The quantum of degradation was analyzed by matching the peak area with a newly prepared standard solution. The results of stress studies infer that RC exhibited maximum degradation beneath photolytic stress and acidic hydrolysis. The percent recovery diminished to about 58.53% and 81.83% for photolytic stress and acidic hydrolysis, respectively. The peak of RC in all the stressed samples were evaluated for peak purity and found to be within the threshold confirming that there is no coelution of other peaks with that of RC. The peak purity of the RC peak obtained in photolytic and acid stress was found to be within the threshold limit and is shown in Figure 6. The overlay chromatogram of standard RC, along with its photolytic and acidic stress sample, is presented in Figure 7.
Linearity
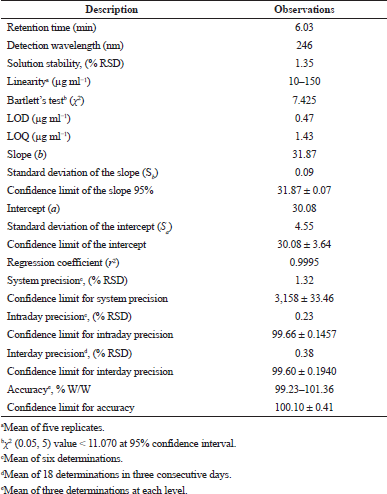
The linearity between the concentration and peak area assessed by constructing calibration curve. Good linearity was observed between 10 and 150 μg ml−1 with a correlation coefficient (r2 > 0.9999). Table 4 depicts the analytical data for linearity with a standard deviation of slope (Sb) and intercept (Sa). The linearity results with a low intercept value and a high correlation coefficient revealed a worthy linear relationship among the peak area and concentration. The Bartlett’s test confirmed the homoscedasticity of the variance with chi-square values less than the tabulated value (Table 4).
Sensitivity—LOD and LOQ
The LOD and LOQ values were calculated based on the standard deviation of the response and slope of the regression line and shown in Table 4.
Precision
The results of all the precision studies carried out were presented in Table 4, and the % RSD was not more than 2%, demonstrating reliable precision.
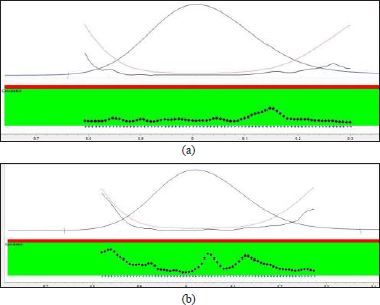 | Figure 6. Peak purity of RC in acid stressed (a) and UV light stressed (b) samples. [Click here to view] |
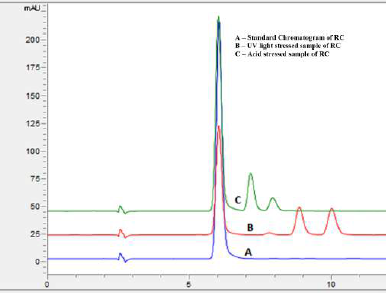 | Figure 7. Overlay chromatogram of standard RC (A), UV light stressed sample (B) and acid stressed sample (C). [Click here to view] |
Accuracy
The results of accuracy (Table 4) depict a good percentage recovery range indicating the best accuracy of the proposed technique.
Assessment of greenness of the proposed method
Two Green metrics, namely analytical Eco-Scale and the novel software-based AGREE metrics, were engaged in assessing the green characteristics of the established HPLC method in addition to reported HPLC methods for the estimation of RC.
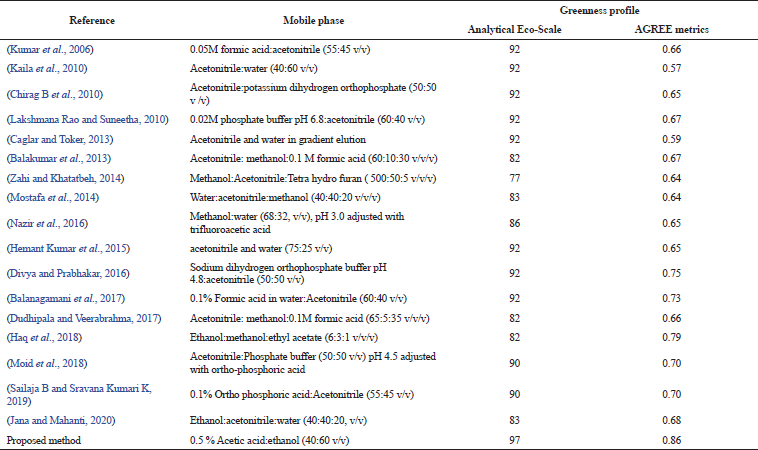
Analytical eco scale. When subjected to evaluation by analytical eco scale, the proposed HPLC method scored a value of 90, with total penalty points of 10 (acetic acid—4, ethanol—4, and HPLC-UV detection—2). Comparing the proposed method's analytical score with that of the reported method (Table 5) depicts the superiority of the proposed method in terms of greenness. The ideology behind the calculation of analytical scale involves the number of pictograms, thus giving higher Eco scale values for the reported HPLC methods that utilize acetonitrile despite its toxicity (Kannaiah et al., 2021; Segura Carretero et al., 2003). However, the proposed method has the highest eco scale values that utilize less harmful chemicals.
 | Table 4. Results for analytical and validation parameters for the proposed HPLC method. [Click here to view] |
 | Table 5. Comparison of the greenness profile among the suggested and reported methods. [Click here to view] |
Agree metrics
The novel evaluation software-based tool for the assessment of greenness is AGREE, which is highly suitable since its results are more quantitative when competed to Analytical Eco scale (Kannaiah et al., 2021). The Analytical Eco scale is semi-quantitative while, in contrast AGREE system is entirely quantitative. The score generated by the agree software for the suggested and reported HPLC methods presented in Table 5 demonstrates that the proposed method is greener. The output of the agree diagram for the proposed method is shown in Figure 8.
Pharmaceutical application
The determination of RC in their tablet dosage form Rozat 10 was performed in sextuplicate by the proposed green HPLC method and the reference method (Balakumar et al., 2013). The results were 99.63 ± 0.31 and 99.54 ± 0.15 (Mean ± SD) for the proposed and reference method, respectively. Student's t-test for accuracy and variance ratio F test for precision was applied to the assay results obtained. The calculated t-value (0.451) and F-values (4.284) did not exceed the tabulated values, t = 2.776 and F = 19 at the 95% confidence level for 10 degrees of freedom revealed that there is no noteworthy variation among the developed method and the reference method.
 | Figure 8. AGREE metrics results for the proposed method. [Click here to view] |
CONCLUSION
This work describes proficient stability indicating the green HPLC method for the determination of RC in pharmaceutical tablet formulation by applying AQbD. The establishment of AQbD in the proposed method affirmed superior robustness besides the enhanced performance of CAA’s and recognised the CQA’s and their effects on CAA’s. The suggested method was selective for the analysis of RC in pharmaceutical formulation and degradation products. Forced degradation studies have shown that RC is highly prone to degrade under applied acidic and photolytic stress conditions. The proposed method proves to be the best alternative over reported methods with the slightest impact on the environment. Validation of the method was found to be agreeable.
AUTHOR CONTRIBUTIONS
All authors made substantial contributions to conception and design, acquisition of data, or analysis and interpretation of data; took part in drafting the article or revising it critically for important intellectual content; agreed to submit to the current journal; gave final approval of the version to be published; and agree to be accountable for all aspects of the work. All the authors are eligible to be an author as per the international committee of medical journal editors (ICMJE) requirements/guidelines.
FUNDING
There is no funding to report.
CONFLICTS OF INTEREST
The authors report no financial or any other conflicts of interest in this work.
ETHICAL APPROVALS
This study does not involve experiments on animals or human subjects.
PUBLISHER’S NOTE
This journal remains neutral with regard to jurisdictional claims in published institutional affiliation.
REFERENCES
Angelo ML, Moreira FD, Morais Ruela AL, Santos ALA, Salgado HRN, de Araujo MB. Analytical methods for the determination of Rosuvastatin in pharmaceutical formulations and biological fluids: a critical review. Crit Rev Anal Chem, 2018; 48(4):317–29. CrossRef
Armenta S, Garrigues S, Guardia M. Green analytical chemistry. Trends Anal Chem, 2008; 27(6):497–511. CrossRef
Balakumar K, Raghavan CV, Selvan NT, Prasad RH, Abdu S. Self nanoemulsifying drug delivery system (SNEDDS) of Rosuvastatin calcium: design, formulation, bioavailability and pharmacokinetic evaluation. Colloids Surf B Biointerfaces, 2013; 112:337–43. CrossRef
Balanagamani D, Deepthi K, Sivasubramanian KL. Development and validation of stability indicating RP-HPLC method for Rosuvastatin calcium. Int Res J Pharm, 2017; 7(12):118–23. CrossRef
Brunton L, Knollmann B, Hilal-Dandan R. Goodman and Gilman’s the pharmacological basis of therapeutics. Mc Graw Hill, New York, NY, 2011.
Caglar S, Toker S. Determination of Rosuvastatin at picogram level in serum by fluorimetric derivatization with 9-anthryldiazomethane using HPLC. J Chromatogr Sci, 2013; 51(1):53–8. CrossRef
Chirag BP, Channabasavaraj K, Jayadeep D, Chudasama, Mani TT. Development and validation of RP-HPLC method for determination of Rosuvastatin calcium in bulk and pharmaceutical dosage Form. Int J Pharm Sci Rev Res, 2010; 5(2):82–6.
Derringer G, Suich R. Simultaneous optimization of several response variables. J Qual Technol, 1980; 12(4):214–9. CrossRef
Divya S, Prabhakar B. Stability-indicating assay method for determination of Rosuvastatin in nano-formulation and pharmaceutical dosage form by RP-HPLC. Int J Pharm Tech Res, 2016; 9(7):265–4.
Dudhipala N, Veerabrahma K. Improved anti-hyperlipidemic activity of Rosuvastatin calcium via lipid nanoparticles: pharmacokinetic and pharmacodynamic evaluation. Eur J Pharm Biopharm, 2017; 110:47–57. CrossRef
Galuszka A, Migaszewski Z M, Konieczka P, Namiesnik J. Analytical Eco-Scale for assessing the greenness of analytical procedures. Trends Anal Chem, 2012; 37:61–72. CrossRef
Galuszka A, Migaszewski Z, Namiesnik J. The 12 principles of green analytical chemistry and the significance mnemonic of green analytical practices. Trends Anal Chem, 2013; 50:78–84. CrossRef
Haq N, Shakeel F, Alanazi F, Alshora DH, Ibrahim MA. Development and validation of a green RP-HPLC method for the analysis of Rosuvastatin: a step towards making liquid chromatography environmentally benign. Green Process Synth, 2018; 7(2):160–9. CrossRef
Hemant Kumar T, Swathi Sri D, Vara Prasada Rao K, Srinivasa Rao Y. Determination of Rosuvastatin calcium in bulk and pharmaceutical formulation. Int J Pharm Sci Res, 2015; 6(7):2913–7.
ICH Q2 (R1). Validation of analytical procedures: text and methodology. International Conference on Harmonisation, Geneva, Switzerland, 2005. Available via https://database.ich.org/sites/default/files/Q2%28R1%29%20Guideline.pdf (Accessed 12 June 2021).
ICH Q3C (R8). Guideline for residual solvents. International Conference on Harmonisation. Geneva, Switzerland, 2021. Available via https://database.ich.org/sites/default/files/ICH_Q3C-R8_Guideline_Step4_2021_0422_1.pdf (Accessed 12 June 2021). ICH Q8(R2). Pharmaceutical development. International Conference on Harmonisation (vol. 8). Geneva, Switzerland, 2009. Available via https://database.ich.org/sites/default/files/Q8_R2_Guideline.pdf (Accessed 12 June 2021).
Jana K, Mahanti B. Development and validation of a new improved RP-HPLC method for estimation of Rosuvastatin calcium in pharmaceutical dosage form. Res J Pharm Technol, 2020; 13(6):2886. CrossRef
Kaila H, Ambasana M, Thakkar R, Saravaia H, Shah A. A new improved RP-HPLC method for assay of Rosuvastatin calcium in tablets. Indian J Pharm Sci, 2010; 72(5):592. CrossRef
Kannaiah KP, Sugumaran A, Chanduluru HK, Rathinam S. Environmental impact of greenness assessment tools in liquid chromatography—a review. Microchem J, 2021; 170:106685. CrossRef
Koel M, Kaljurand M. Application of the principles of green chemistry in analytical chemistry. Pure Appl Chem, 2006; 78(11):1993–2002. CrossRef
Koen S, Alberto P, Frank D, Pat S, Gerd V. Green chromatography (Part 1): introduction and liquid chromatography. LCGC Europe, 2010; 23(5):242–59.
Kumar TR, Shitut NR, Kumar PK, Vinu MCA, Kumar VVP, Mullangi R, Srinivas NR. Determination of Rosuvastatin in rat plasma by HPLC: validation and its application to pharmacokinetic studies. Biomed Chromatogr, 2006; 20(9):881–7. CrossRef
Lakshmana Rao A, Suneetha, D. Development and validation of RP-HPLC method for the estimation of Rosuvastatin in bulk and pharmaceutical dosage form. Int J Chem Soc, 2010; 8(2):1308–14.
Moid M, Afzal S, Rahim N, Ali T, Iffat W, Bashir L, Naz S. High performance liquid chromatographic method validation for determination of Rosuvastatin calcium in tablet dosage forms. Pak J Pharm Sci, 2018; 31(4):1577–82.
Mostafa NM, Badawey AM, Lamie NT, Abd El-Aleem, Abd El-Aleem AE. Selective chromatographic methods for the determination of Rosuvastatin calcium in the presence of its acid degradation products. J Liq Chromatogr Related Technol, 2014; 37(15):2182–96. CrossRef
Nazir S, Iqbal Z, Nasir F. Impact of menopause on pharmacokinetics of Rosuvastatin compared with premenopausal women. Eur J Drug Metab Pharmacokinet, 2016; 41(5):505–9. CrossRef
Pena Pereira F, Kloskowski A, Namiesnik J. Perspectives on the replacement of harmful organic solvents in analytical methodologies: a framework toward the implementation of a generation of eco-friendly alternatives. Green Chem, 2015; 17(7):3687–705. CrossRef
Pena Pereira F, Wojnowski W, Tobiszewski M. AGREE— Analytical GREEnness Metric Approach and Software. Anal Chem, 2020; 92(14):10076–82. CrossRef
Peraman R, Bhadraya K, Padmanabha Reddy Y. analytical quality by design: a tool for regulatory flexibility and robust analytics. Int J Anal Chem, 2015; 2015:1–9. CrossRef
Plotka J, Tobiszewski M, Sulej AM, Kupska M, Gorecki T, Namiesnik J. Green chromatography. J Chromatogr A, 2013; 1307:1–20. CrossRef
Rajput P, Shah DB, Maheshwari DG. A Review on chromatographic method for estimation of Rosuvastatin calcium. Int J Res Pharm Pharm Sci, 2018; 3(1):28–31.
Sailaja B, Sravana Kumari K. Stability-indicating method development and validation for the estimation of Rosuvastatin calcium in bulk and tablet formulation by reverse phase high performance liquid chromatography. Asian J Pharm Clin Res, 2019; 12(8):251–6. CrossRef
Segura Carretero A, Cruces-Blanco C, Perez Duran S, Fernandez Gutierrez A. Determination of imidacloprid and its metabolite 6-chloronicotinic acid in greenhouse air by application of micellar electrokinetic capillary chromatography with solid-phase extraction. J Chromatogr A, 2003; 1003(1–2):189–95. CrossRef
Sheldon RA. Fundamentals of green chemistry: efficiency in reaction design. Chem Soc Rev, 2012; 41(4):1437–51. CrossRef
Tobiszewski M, Mechlinska A, Namiesnik, J. Green analytical chemistry—theory and practice. Chem Soc Rev, 2010; 39(8):2869. CrossRef
Welch CJ, Wu N, Biba M, Hartman R, Brkovic T, Gong X, Helmy R, Greening analytical chromatography. TrAC Trends Anal Chem, 2010; 29(7):667–80. CrossRef
Williams M. The Merck index: an encyclopedia of chemicals, drugs, and biologicals. Whitehouse Station/Rahway, Hunterdon, NJ, 2006.
Zahi TM, Khatatbeh OA. Stability-indicating RPHPLC method development and validation for the determination of Rosuvastatin (calcium) in pharmaceutical dosage form. Int J Pharm Sci Drug Res, 2014; 6(2):154–9.