
INTRODUCTION
Ibuprofen, (RS)-2-(4-(2-methylpropyl) phenyl)-propionic acid, is a nonsteroidal anti-inflammatory drug and it acts as a nonselective cyclooxygenase inhibitor. It is commonly used for the relief of toothache, rheumatoid arthritis, osteoarthritis, any kind of joint pain and muscle spasm, and in reducing fever and any other nonspecific inflammation (Lewis, 1975). Globally, numerous brands of ibuprofen tablet dosage forms are available in the pharmaceutical market. Before the launching of any pharmaceutical product, pharmaceutical companies must adhere to quality control guideline processes to ensure the overall quality assurance of a pharmaceutical product. When the product is launched in the market, a variety of factors such as environmental conditions can affect the quality of the product during distribution or shipment. The drugs that are available in the market are either classified as innovator or generic drugs. The Gulf Cooperation Countries pharmaceutical market is dominated by patented drugs, with 5%–6% generic products (Balasubramanian et al., 2015). In the United Arab Emirates (UAE), three pharmaceutical companies are manufacturing and marketing ibuprofen tablet dosage forms; therefore, to meet the demand of UAE people, several other brands are imported from around the globe. For importation of foreign medicine into the UAE, various approvals are required to ensure the drugs that are brought into the country are compliant with the UAE standards for safe consumption (Balasubramanian et al., 2015; Hassan et al., 2017; Pateriya et al., 2011). An important step to confirm similarity and interchangeability in pharmaceutical products is to determine the pharmaceutical equivalence. The formulation of pharmaceutically equivalent drug products may differ in excipients, release mechanisms, packaging, shape, expiration time, and labeling (FDA, 2005). Hence, the pharmaceutical equivalence studies are important and required to know the differences in the quality of brand products and test products. Several authors reported the pharmaceutical equivalence study of marketed ibuprofen tablets and the results revealed that all studied products were not pharmaceutically equivalent (Abdulmajed et al., 2018; Eraga et al., 2015; Gwaziwa et al., 2017; Okunlola et al., 2009). Various researchers reported on the development of UV-spectrophotometric and HPLC analytical methods for quantification of ibuprofen as a single component (El-Fatatry et al., 2016; Eraga et al., 2015; Sunaric et al., 2013) or in combination with paracetamol (Borahan et al., 2019; Lakka et al., 2011), with diphenhydramine (Kumar et al., 2018), and with famotidine (Krishnaveni and Sathyannarayana, 2013; Kumar et al., 2014), respectively, present in pharmaceutical dosage. In this context, this study was designed to develop a simple RP-HPLC method for identification, quantification, and dissolution study of commercially available ibuprofen tablets in the UAE and to compare the dissolution profiles similarity of test products with the reference product generated from the RP-HPLC and USP42-NF37 method (UV-spectrophotometry), respectively, to conclude whether the studied products are pharmaceutical equivalents.
MATERIALS AND METHODS
Materials for physical and chemical analysis
USP reference standard ibuprofen and naproxen were obtained from Sigma-Aldrich (USA). HPLC-grade acetonitrile (Honeywell, France), monobasic sodium phosphate and phosphoric acid (85%) [Sigma-Aldrich (USA)], and phosphate buffer solution pH 7.2 (Hanna Instruments, Italy) were used in this study. Pyrex-grade glassware, disposable 0.45 μm syringe filters (Fisher Scientific, UK), and Milli-Q Ultrapure (Type 1) water (Millipore, Bedford, MA) were used throughout the study.
Sample information
Nine brands of ibuprofen tablets were purchased from the pharmacies of the UAE and were investigated in this study. The strength of all the products was 400 mg except one product available only as 200 mg. Three products were manufactured locally and the remaining six products were imported from different countries. The working code for the products was assigned as IBU-1 (UAE), IBU-2 (Oman), IBU-3 (Germany), IBU-4 (USA), IBU-5 (USA), IBU-6 (Saudi Arabia), IBU-7 (UAE), IBU-8 (Switzerland), and IBU-9 (UAE), respectively. The prices of studied product were AED14 (IBU-1), AED10.5 (IBU-2), AED15 (IBU-3 and IBU-4), AED16.5 (IBU-5), AED10 (IBU-6), AED14 (IBU-7), AED21.5 (IBU-8), and AED10.5 (IBU-9), respectively.
Determination of physical parameters
Weight variation [mg ± standard deviation (SD)] of 20 tablets of each brand were recorded using an analytical balance (KERN & SOHN GmbH, Germany). The length of 20 tablets in mm (± SD) was measured using a micrometer. A friability test apparatus (Grover Enterprises, India) was used for measuring % loss of tablets (10 units for each brand) and the apparatus was operated at 25 rpm for 4 minutes and this was repeated twice. Tablet Disintegration Tester (India) was used for recording the time of disintegration (minutes) of nine tablets for each brand and the temperature of the water bath was maintained at 37°C ± 2°C. The Erweka Hardness Tester (Germany) was used for breaking the tablets (10 units for each brand) and the force required to break the tablets was expressed in kilogram-force (kg-f ± SD).
Preparation of standards and sample solutions
A wide range of ibuprofen reference standard solutions (0.001 to 1,000 μg/ml) in acetonitrile: water (7:3 v/v; diluent) were prepared and used for the development of the RP-HPLC method for qualitative and quantitative analysis of ibuprofen present within the tablets. 15 μg/ml naproxen was prepared in acetonitrile: water (7:3) and used as an internal standard (IS). For sample preparation, 10 tablets of each brand were weighed and ground into a fine powder using a mortar and pestle. Three replicates of 400 μg/ml equivalent of powdered tablets were accurately weighed and transferred into a 100 ml volumetric flask. 50 ml of acetonitrile:water (7:3 v/v) was then added and the mixture was sonicated for 5 minutes for enhancing solubility and then the volume was made up to 100 ml with a diluent. The sample solutions were then filtered through a Whatman no. 42 filter paper and 0.45 μm membrane filter, respectively, for qualitative and quantitative analysis.
Instrumental analysis
HPLC analysis was carried out utilizing a Water binary pump HPLC instrument, equipped with a UV-VIS detector and autosampler, and Breeze 2 software. The sample was analyzed using a Pinnacle DB C18 column (150 × 4.6 mm, 3.5 μm particles, Restek, USA) with the mobile phase consisting of acetonitrile and acidified Milli-Q Ultrapure water (1% phosphoric acid) (70:30 v/v) in the isocratic mode. The sample (10 μl) was run for 8 minutes with a flow rate of 1 ml/minute and the component of interest was detected at 221 nm. The freshly prepared, degassed, and filtered (0.45 μm membrane filter) mobile phase was used for HPLC analysis. A UV-VIS spectrophotometer, Shimadzu (UV-1800), was also used for quantification of percent cumulative release of drug in the dissolution study (USP-NF, 2019). The mode of analysis was photometric at 221 nm using a quartz cell (pathlength: 10 mm, cell volume: 3.5 ml). The ambient temperature of the lab was maintained at 25°C during the analysis.
Calibration curves and ranges
Detector linearity of the developed RP-HPLC analytical method was evaluated by utilizing nine data point calibration curves prepared from concentration ranges of 0.25 to 1,000 μg/ml ibuprofen standard solution. In contrast, detector linearity of UV analysis was carried out by utilizing nine data point calibration curves prepared with concentration ranges of 0.001 to 50 μg/ml. For the determination of the rate of dissolution of ibuprofen from tablets, a calibration curve was constructed from the concentration ranges of 10 to 500 μg/ml with seven data points in RP-HPLC analysis. In contrast, a calibration curve of concentration ranges of 0.25 to 50 μg/ml was constructed in UV analysis with six data points to obtain slope, intercept, and correlation coefficient for each drug. IS calibration curve (ratio of standard peak area/IS peak area) was prepared with five data points from concentration ranges of 100–500 μg/ml ibuprofen standard solution and this curve was utilized for the quantitative determination of ibuprofen drug contents present within the tablet in RP-HPLC analysis. Naproxen (15 μg/ml) was used as IS. The injections were repeated three times for every single concentration. The repeated injections data output was reported as a mean area with SD and % relative standard deviation (RSD).
System suitability, accuracy, and intraday and day-to-day precision
The suitability of the HPLC system (ICH, 2005) for analysis was evaluated by injecting 10 μl of 10, 50, and 100 μg/ml ibuprofen standard solutions, respectively, and the injection was repeated 10 times. The resolution, tailing factor of the ibuprofen peak, and the theoretical plate number (N) and plate height (H) of the C18 column were calculated (ICH, 2005). The accuracy of the method was evaluated by a recovery study, where three different concentrations of ibuprofen standard solution (100, 200, and 600 μg/ml) were added to 400 mg equivalent powdered tablets (IBU-8) and the sample was prepared according to the sample preparation procedure. The recovery of standards from the added sample was calculated by subtracting the value from the blank that was prepared without added standards. The intraday precision of the analytical method was evaluated by injecting five replicates each of 10, 50, and 100 μg/ml standard solutions of ibuprofen into the HPLC system at a different time interval during the same day, whereas for day-to-day variation the injections were repeated for 6 days. The limit of quantification (LOQ) and limit of detection (LOD) of ibuprofen were investigated according to Q2 (R1) guidelines (ICH, 2005) under the same experimental conditions by injecting various concentrations of ibuprofen standard solution into the HPLC system and the signal height of the analyte (S) was compared with its corresponding blank samples’ noise height (N). The LOQ was the minimum concentration based on the S/N ratio = 10:1, where the peak height of the analyte signal was 10 times higher than the corresponding blank sample noise height, and the LOD was chosen based on the S/N ratio = 3:1 under the same experimental conditions, where the height of the analyte signal was three times higher than its corresponding blank sample noise height (ICH, 2005).
In vitro dissolution study
Dissolution of ibuprofen tablets was carried out in 900 ml phosphate buffer (pH 7.2) using USP Apparatus II (Paddle) with paddle speed 50 rpm (USP-NF, 2019). Six tablets were used for each brand and 5 ml sample solutions were withdrawn at the time intervals of 5, 10, 15, 20, 25, 30, 45, and 60 minutes and the withdrawn volume was replaced with a phosphate buffer solution. The collected sample solutions were filtered through a 0.45 membrane filter and their drug contents analyzed through RP-HPLC (three injections for each unit) and UV-analytical techniques at 221 nm. According to USP42-NF37, the results were reported as % cumulative of drug released from tablets at 60 minutes intervals.
Comparison of in vitro dissolution profiles
The dissolution profiles of ibuprofen tablets generated from both RP-HPLC and UV-analytical data using eight sampling data points were constructed by plotting the % cumulative release of drug at each sampling data point versus time in minutes. For comparison of dissolution profiles of two curves, a product of Switzerland (IBU-8) was considered as a reference product and other studied brands were considered as test products. The similarity or differences in the rate of release of drug at each sampling data point in between two curves was expressed as similarity factor (f2) and difference factor (f1) (Moore and Flanner, 1996). The f1 measured the differences and relative errors in between two dissolution curves at each sampling data point and the reference values are 0%–15%. The f2 measured the similarity between two dissolution curves at each sampling data point and “it is a logarithmic reciprocal square root transformation of the sum of squared error.” The reference value of f2 is 50%–100%. The f2 and f1 of the test products were calculated using (1) and (2), respectively (Moore and Flanner, 1996):
f2 = 50 × log {[1 + (1/n) Σ (Rt − Tt)2]−0.5} × 100, (1)
f1 = {[ Σ | Rt − Tt | ]/[ Σ Rt ]} × 100, (2)
where n is the number of sample time points and Rt and Tt are the percent cumulative release of drug from the reference product and the test product (at sample time point’s t), respectively (Moore and Flanner, 1996).
Statistical analysis
IBM SPSS statistics (version 23) was used for the statistical analysis of the results obtained in this study. All the results were expressed as mean ± SD and %RSD. For multiple comparisons between groups one-way analysis of variance and Tukey’s test were conducted (p < 0.05).
RESULTS
Recorded physical parameters of tablets
The average weight of the studied tablet brands was varied from 470.5 mg (IBU-4) to 690 mg (IBU-3). The percentages of weight variation were ranged from 96.53% to 104.78% and within ± 5% weight variation. The minimum weight variation was observed in IBU-8 (0.51% RSD). The length of tablets varied from 10.51 mm (IBU-1) to 17.12 mm (IBU-3) with %RSD 0.007 (IBU-8) to 0.182% (IBU-9). The allowed deviation for tablets of a diameter of more than 12.5 mm is 3 mm (USP-NF, 2019) and all studied brands were within the limits. Tablet friability was lower than the reference range of 0.5% to 1% (USP-NF, 2019). The tablet breaking force of the studied brands of tablets was measured and the minimum force (5.95 kg-f) was required to break IBU-4 and a maximum of 10.14 kg-f was required for breaking IBU-1. All the brands were within the limits of ≤ 10 kg-f (USP-NF, 2019). The recorded disintegration time for all the studied brands was in between 3.83 minutes (IBU-6) and 6 minutes (IBU-2). The recorded physical parameters of the studied products are shown in Table 1.
Identification of ibuprofen
Ibuprofen standard exhibited UV absorption maxima at 221 nm (λmax) and it was used for identification of ibuprofen present within the tablets. The retention time of ibuprofen standard was 3.273 ± 0.0134 minutes (n = 5) with 0.41% RSD. The retention times of ibuprofen from the studied brands are shown in Figure 1.
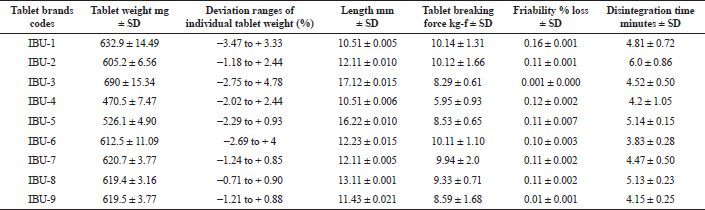 | Table 1. Physical quality control parameters of the nine studied brands of ibuprofen tablets. [Click here to view] |
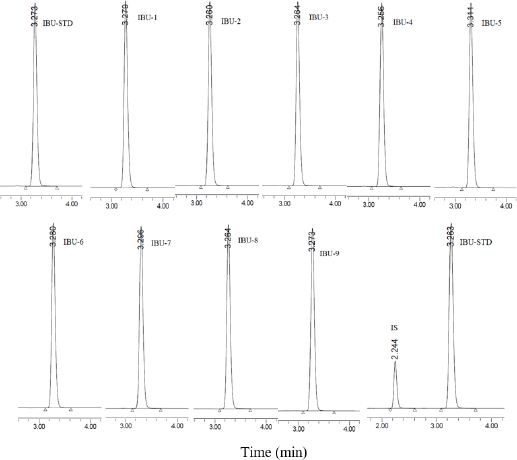 | Figure 1. RP-HPLC chromatogram of ibuprofen standard (IBU-STD, 100 μg/ml), studied brands of IBU-1–IBU-9 (100 μg/ml ibuprofen equivalent sample), and mixture of ibuprofen standard (IBU-STD, 400 μg/ml) + IS (15 μg/ml naproxen). [Click here to view] |
Detector linearity, system suitability, accuracy, and intraday and day-to-day precision
The detector of the HPLC system was linear from 0.25 to 1,000 μg/ml of ibuprofen standard solution and the correlation coefficient of the regression line was R² = 0.9996 constructed from nine data points. The LOQ for ibuprofen was 0.01 μg/ml, whereas the LOD was 0.0005 μg/ml under the same experimental conditions. The suitability of the RP-HPLC system analysis showed less than 1% RSD in retention times and peak areas. The ibuprofen peak asymmetry (tailing factor) was 1.2, and the calculated theoretical plate number (N) was 9,723 with plate height (H) 0.015 mm (ICH, 2005; USP-NF, 2019). The resolution of the ibuprofen peak with correspondence to the IS (naproxen) was 4.28 (Fig. 1). The developed method was precise with the %RSD for intraday variation for ibuprofen from 0.26% to 0.91% and the %RSD for 6 days variation was ranged from 1.68% to 3.26%. The accuracy of the analytical method was determined using recovery studies. The recovery of ibuprofen was 99.86% to 100.55% with RSD less than 2%. The validation parameters study data are presented in Table 2.
Quantitative analysis of commercial ibuprofen tablets
The IS calibration curve with the regression equation y = 0.0119 × + 0.0971 (R² = 0.9999) was utilized for quantitative analysis of ibuprofen present within the tablets. The highest concentration (107.58%) was recorded in IBU-8, a product of Switzerland, and the lowest concentration (97.46%) was in IBU-9, a product of the UAE. In the overall results of the quantitative analysis of the ibuprofen products, the % ibuprofen contents decreased in the order of IBU-8 > IBU-5 > IBU-1 > IBU-4 > IBU-6 > IBU-7 > IBU-2 > IBU-3 > IBU-9. However, there were no statistically significant (p < 0.05) differences amongst the mean values of IBU-1, IBU-2, IBU-3, IBU-4, IBU-6, and IBU-7 and the mean values of IBU-1, IBU-4, IBU-5, and IBU-8, respectively. The studied products complied with the USP official monograph reference ranges (90% to 110%) (USP-NF, 2019) of drug contents for ibuprofen tablets, and the results are presented in Table 3.
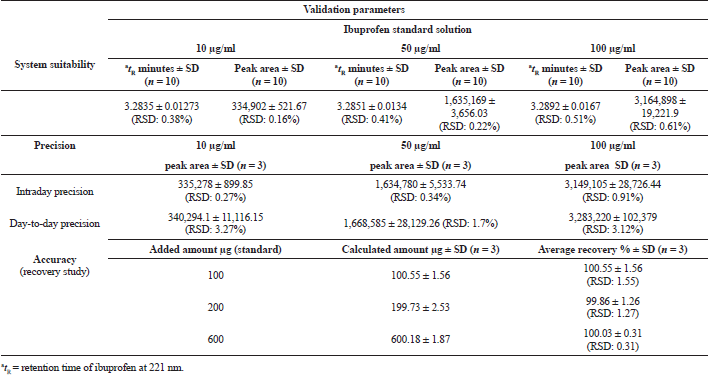 | Table 2. System suitability, precision, and recovery study of the RP-HPLC system used for quantitative analysis of ibuprofen. [Click here to view] |
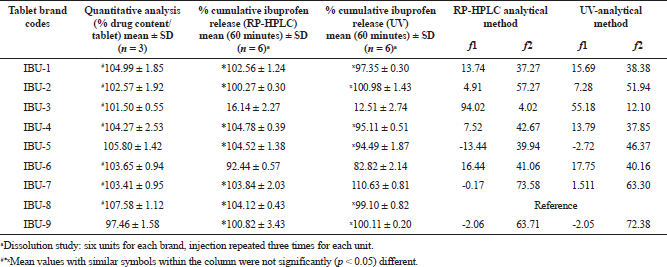 | Table 3. Assay, % cumulative release of ibuprofen at 60 minutes intervals, and calculated similarity (f2) factors and difference factors (f1) of the studied ibuprofen tablets. [Click here to view] |
In vitro dissolution study
Two different machine parameters, UV-VIS-spectrophotometry (USP-NF, 2019) and the developed RP-HLPC system, were used for the determination of % cumulative release of drug from nine brands of ibuprofen tablets. The dissolution profiles generated from the UV-analytical method are shown in Figure 2. It was observed that about 80% to 90% of the drug was released within 20 minutes from IBU-2, IBU-4, IBU-7, IBU-8, and IBU-9, respectively, whereas IBU-1 released 87% of the drug at 25 minutes, IBU-5 released 85% of the drug at 30 minutes, and IBU-6 released 82% of the drug at a 60 minutes interval. According to the USP42-NF37 monograph (USP-NF, 2019), at 60 minutes intervals, the tablet should release 80% of the ibuprofen; hence, the 60 minutes interval data of this study were tabulated in Table 3. Amongst the three local products, the highest % of the drug was released from IBU-7 and amongst the other imported products, the highest percentage of the drug was released from IBU-2, a product of Oman, and the lowest percentage of the drug was released from IBU-3, a product of Germany. The overall results of % cumulative drug release in 60 minutes from the nine brands of tablets decreased in the order of IBU-7 > IBU-2 > IBU-9 > IBU-8 > IBU-1 > IBU-4 > IBU-5 > IBU-6 > IBU-3. All the studied products complied with the USP42-NF37 (USP-NF, 2019) monograph except IBU-3. The results were compared statistically and there were no significant differences (p < 0.05) in the mean values of IBU-1, IBU-4, and IBU-5, respectively. In addition, there were no statistically significant (p < 0.05) differences in the mean values of IBU-1, IBU-8, and IBU-9 as well as in between IBU-2, IBU-8, and IBU-9, respectively.
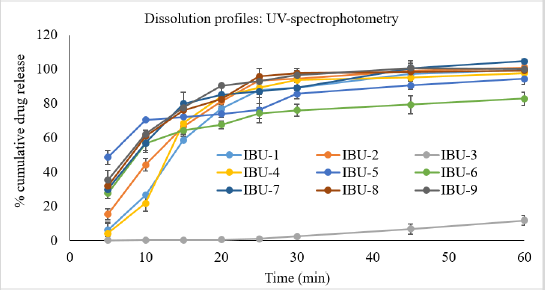 | Figure 2. Percent cumulative release of ibuprofen from nine brands of ibuprofen tablets that were analyzed using UV-spectrophotometry. [Click here to view] |
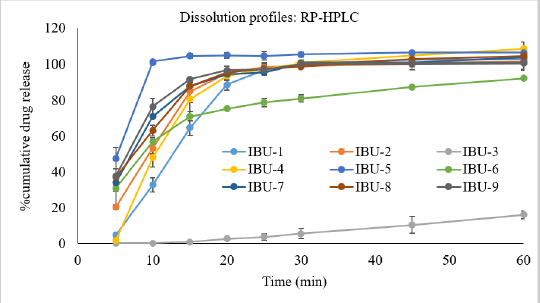 | Figure 3. Percent cumulative release of ibuprofen from nine brands of ibuprofen tablets that were analyzed using the developed and validated RP-HPLC system. [Click here to view] |
The developed and validated RP-HPLC method was used in the dissolution study and the dissolution profiles are shown in Figure 3. It was evident from Figure 3 that IBU-5 released 100% of the drug within 10 minutes and IBU-2, IBU-4, IBU-7, IBU-8, and IBU-9 released 80% to 85% of the drug within 15 minutes and only product IBU-3 released less than 1% of the drug within 15 minutes. Amongst the nine products, the highest % cumulative drug was released from IBU-4 (104.78%); however, statistically, it was not significantly (p < 0.05) different from the mean values of IBU-1, IBU-5, IBU-7, and IBU-8, respectively. The overall ranking of % cumulative drug release in 60 minutes (Table 1) from the studied products was decreased in the following order: IBU-4 > IBU-5 > IBU-8 > IBU-7 > IBU-1 > IBU-9 > IBU-2 > IBU-6 > IBU-3. In comparison between groups, there were no statistically significant (p < 0.05) differences in the mean values of IBU-1, IBU-2, IBU-7, and IBU-9. The results complied with the USP monograph (USP-NF, 2019) for ibuprofen tablets except for IBU-3. The dissolution study of IBU-3 was continued at 75, 90, 110, 150, 180, 200, 210, and 240 minutes intervals as shown in Figure 4 and it was revealed that about 80% of the drug was released at 200 minutes intervals.
Comparison of in vitro dissolution profiles
The dissolution profiles were compared and the similarity factor (f2) and difference factor (f1) were calculated using eight data sample points and the results are presented in Table 3. In the RP-HPLC analysis, the observed f1 values for ibuprofen were ranged from −13.44% to 94.02%. The f1 values in between two curves at each data point were within acceptable ranges (0–15) and were for IBU-1, IBU-2, and IBU-4, respectively, and the remaining products either exceeded 15% or were below 0%. The calculated f2 values for the studied brands were ranged from 4.01% to 73.58% and the three products IBU-2, IBU-7, and IBU-9 complied with the reference ranges (50–100), and hence three products were pharmaceutically equivalent to the reference product IBU-8.
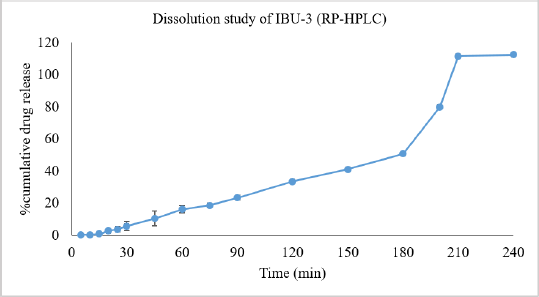 | Figure 4. Percent cumulative release of ibuprofen from the IBU-3 brand of ibuprofen tablets that were analyzed using the developed and validated RP-HPLC system. [Click here to view] |
In UV analysis, the f2 factor of IBU-2, IBU-7, and IBU-9 was within the reference ranges and was also pharmaceutically equivalent to the reference product. The percent difference f1 values at each data point between the test product and reference curves were within the limit for four products, IBU-1, IBU-2, IBU-4, and IBU-7, respectively, and the remaining products, IBU-5 and IBU-9, showed negative differences (−2.72% and −2.05%). Only product IBU-3 exhibited very high differences (55.18%) in comparison with the IBU-8.
DISCUSSION
The pharmaceutical equivalence of nine brands of ibuprofen tablets available in the UAE pharmaceutical markets was investigated and evaluated. In terms of physical parameters evaluation such as weight variation, friability, tablet length, tablet breaking force, and disintegration test, all the brands complied with the USP42-NF37 reference limits (USP-NF, 2019). The active content of the studied brands was more than 25 mg. Hence a weight variation test was used to check their active content uniformity (USP-NF, 2019). The studied brands were in different sizes and shapes. Hence, weight varied from 470.5 mg (IBU-4) to 690 mg (IBU-3). Tablet breaking force is a very important quality control parameter, and it affects disintegration time and friability (Chowhan et al., 1982; Saleem et al., 2014). It is also related to the mechanical strength of the tablets that helps in proper manufacturing, packaging handing, and transportation process (Gupta and Saini, 2009). The disintegration test is correlated with the bioavailability and dissolution rate of the drug. Lower disintegration values ensure better absorption, perhaps a better therapeutic action (Srinivas et al., 2010). Lower friability (<0.5%) and disintegration time (3.83 to 6.0 minutes) and acceptable ranges of tablet breaking force (within 10 kg-f) of the studied brands indicated that all the studied products were in compliance with USP42-NF37 limits (USP-NF, 2019) and were quality products with regard to physical quality control parameters.
A simple, precise, and accurate RP-HPLC method was developed and validated for the quantitation of ibuprofen present within tablets and applied in the dissolution study. The retention times of the ibuprofen standard and the studied products at 221 nm were identical at ? 3.3 minutes and the studied products contained 97% to 107% ibuprofen, complying with the USP-NF (2019) limits. The developed RP-HPLC method was applied for the in vitro dissolution study along with the USP-NF (2019) analytical method. The dissolution study is an important test to evaluate the quality of generic medicine and this test can be correlated with the bioequivalence study during post approval changes of certain pharmaceutical products (Anand et al., 2011; Siewert et al., 2003). The USP official monograph (USP-NF, 2019) uses two λmax at 266 and 280 nm for a gelatin-coated ibuprofen tablet, and the subtracted value is considered the net absorbance for the ibuprofen. In this study, it was revealed that there was a limitation of quantification of ibuprofen with acceptable precision and accuracy in the UV-photometric analysis, and the maximum quantification limit was 50 μg/ml. Hence, the dissolution sample needed 10- to 50-fold dilution for fitting within the constructed calibration curve. On the contrary, in the RP-HPLC study, dilution was not needed as the detector was linear up to 1,000 μg/ml of ibuprofen. Based on the dissolution profiles comparison of the two analytical methods, it was observed that % cumulative release of the drug was slightly higher in the RP-HPLC analysis than its corresponding UV-analytical results at certain sampling data points. However, all the studied samples passed the dissolution test limits of the USP monograph (?80% drug release at 60 minutes) except IBU-3 irrespective of the machine parameters used.
The calculation of in vitro dissolution similarity factor f2 using the model-independent method (Moore and Flanner, 1996) of the test products in comparison with the reference product can be correlated or substituted for the in vivo bioequivalence study (Costa, 2001; FDA, 2000) and the f2 values close to 100 indicate that the two products are identical. Based on the reference values (50%–100%), two local (IBU-7, IBU-9) and one imported (IBU-2, Oman) products were > 50% identical to the reference product (IBU-8, Switzerland). However, Xie et al. (2015) suggested that f2 ≥ 50% is not critical and can be lowered to an appropriate value as they found there was a consistency between in vitro dissolution similarity factor f2 ≥ 35% of selective drugs and their in vivo bioequivalence criteria. In this instance, seven out of the eight studied ibuprofen products showed f2 ≥ 35% in comparison of dissolution profiles between test and reference products. In addition, based on the calculated difference factors f1 (Moore and Flanner, 1996) of the eight test products, six products complied with the reference ranges whereas one product (IBU-6) showed slightly higher differences (17%) in comparison to dissolution profiles. The f1 and f2 values of IBU-3 generated from both analytical methods did not comply with the reference ranges. Hence, this study result suggests that the developed RP-HPLC method was suitable for the quantification of ibuprofen from the dissolution media.
CONCLUSION
The developed RP-HPLC method was simple, accurate, and precise for the qualitative and quantitative analysis of ibuprofen present within the tablets. In addition, the RP-HPLC method was applicable for the quantification of dissolute drugs without further dilution. The studied ibuprofen tablets that are available in the UAE pharmaceutical markets were quality products based on physical parameters, assay, and dissolution test except for an imported product that released 80% of the drug at 200 minutes in the dissolution study. Based on in vitro dissolution similarity factor f2 ≥ 50%, two local and one imported product were considered pharmaceutical equivalents to the reference product.
AUTHOR CONTRIBUTIONS
All authors made substantial contributions to conception and design, acquisition of data, or analysis and interpretation of data; took part in drafting the article or revising it critically for important intellectual content; agreed to submit to the current journal; gave final approval of the version to be published; and agree to be accountable for all aspects of the work. All the authors are eligible to be an author as per the international committee of medical journal editors (ICMJE) requirements/guidelines.
FUNDING
There is no funding to report.
CONFLICTS OF INTEREST
The authors report no financial or any other conflicts of interest in this work.
ETHICAL APPROVALS
This study does not involve experiments on animals or human subjects.
PUBLISHER’S NOTE
This journal remains neutral with regard to jurisdictional claims in published institutional affiliation.
REFERENCES
Abdulmajed A, Ali A, Ali K. Comparative evaluation quality of different brands of ibuprofen 400 mg tablets available in Yemeni’s Market. Chron Pharm Sci, 2018; 3(1):730–42.
Anand O, Lawrence X, Conner D, Davit B. Dissolution testing for generic drugs: an FDA perspective. AAPS J, 2011; 13(3):328–35. CrossRef
Balasubramanian J, Radhika N, Adinarayana G, Nandhini G, Jothi K, Sugathri S. Regulatory prerequisite for pharmaceutical products as per UAE guidelines. World J Pharm Pharm Sci, 2015; 4(10):487–507.
Borahan T, Unutkan T, ?ahin A, Bak?rdere S. A rapid and sensitive reversed phase-HPLC method for simultaneous determination of ibuprofen and paracetamol in drug samples and their behaviors in simulated gastric conditions. J Sep Sci, 2019; 42(3):678–83. CrossRef
Chowhan Z, Yang I, Amaro A, HuaChi L. Effect of moisture and crushing strength on tablet friability and in vitro dissolution. J Pharm Sci, 1982; 71(12):1371–5. CrossRef
Costa P. An alternative method to the evaluation of similarity factor in dissolution testing. Int J Pharm, 2001; 220:77–83. CrossRef
El-Fatatry H, Mabrouk M, Hammad S, El-malla S. A validated enantioselective HPLC method for determination of ibuprofen enantiomers in bulk and tablet dosage form. J AOAC Int, 2016; 99(3):604–11. CrossRef
Eraga S, Mathew I, Rosemary N, Magnus A. A comparative UV−HPLC analysis of ten brands of ibuprofen tablets. Asian Pac J Trop Biomed, 2015; 5(10):880–4. CrossRef
FDA. Food and Drug Administration, 2005. Available via https://www.fda.gov/ohrms/dockets/ac/05/briefing/2005-4137B1_07_Nomenclature.pdf (Accessed 18 April 2021)
FDA. Guidance for industry: waiver of in vivo bioavailability and bioequivalence studies for immediate-release solid oral dosage forms based on a biopharmaceutics classification system. Food and Drug Administration, Rockville, MD, 2000.
Gupta M, Saini T. Preformulation parameters characterization to design, development and formulation of vancomycin hydrochloride tablets for Pseudomembranous colitis. Int J Pharm Res Dev, 2009; 1:1–7.
Gwaziwa N, Dzomba P, Mupa M. A quality control study of ibuprofen tablets available in the formal and informal market in Harare, Zimbabwe. Afr J Pharmacy Pharmacol, 2017; 11(16):195–203.
Hassan R, Sher H, Khokhar R, Hussain R. Pharmaceutical policy in the UAE. In: Pharmaceutical policy in countries with developing healthcare systems, Babar ZUD (eds.). Springer International Publishing, New York, NY, pp 365–79, 2017.
ICH. International conference on harmonization of technical requirements for registration of pharmaceuticals for human use Q2A guidelines. ICH, 2005. Available via https://database.ich.org/sites/default/files/Q2_R1__Guideline.pdf (Accessed 18 April 2021)
Kumar V, Supriya T, Sivagami B, Sireesha R, Kumar R, Babu M. Development and validation of new analytical method for the simultaneous estimation of ibuprofen and diphenhydramine in bulk and pharmaceutical dosage form by RP-HPLC. Int J Pharm Chem Anal, 2018; 1(1):13–7. CrossRef
Kumar SA, Debnath M, Rao JVLNS, Sankar DG. A new RP-HPLC stability indicating method development and validation for simultaneous estimation of ibuprofen & famotidine in bulk as well in pharmaceutical dosages form by using PDA detector. Int J Pharm Sci Res, 2014; 5(9):3829–39. CrossRef
Krishnaveni G, Sathyannarayana P. Simultaneous determination of famotidine and ibuprofen in combined pharmaceutical dosage form by RP-HPLC method. Int J Pharma Bio Sci, 2013; 4(3):655–62.
Lakka N, Goswami N, Balakrishna P. Development and validation of a RP-HPLC for simultaneous determination of ibuprofen and paracetamol in solid dosage forms: application to dissolution studies. Int J Res Pharm Sci, 2011; 2(3):331–7.
Lewis JR. Evaluation of ibuprofen (Motrin). A new antirheumatic agent. JAMA, 1975; 233(4):364–5. CrossRef
Moore WJ, Flanner HH. Mathematical comparison of dissolution profiles. Pharm Technol, 1996; 20(6):64–74.
Okunlola A, Adegoke O, Odeku O. Generic versus innovator: analysis of the pharmaceutical qualities of paracetamol and ibuprofen. East Cent Afr J Pharm Sci, 2009; 12(3):55–64.
Pateriya S, Janodia M, Deshpande P, Ligade V, Talole K, Kulshrestha T, Kamariya Y, Musmade P, Udupa N. Regulatory aspects of pharmaceuticals exports in gulf cooperation council countries. J Young Pharmacist, 2011; 3(2):155–62. CrossRef
Saleem M, Shahin M, Srinivas B and Begum A. Evaluation of tablets by friability apparatus. Int J Res Pharm Chem, 2014; 4(4):837–40.
Siewert M, Dressman J, Brown C, Shah V. FIP/AAPS guidelines for dissolution/in vitro release testing of novel/special dosage forms. Dissolution Technologies, 2003. Available via https://www.fip.org/files/fip/BPS/Dissolution/FIP_AAPS_Guidelines%20for%20Dissolution.pdf (Accessed 18 April 2021) CrossRef
Srinivas D, Debnath S, Chowdary T, Manjunath S. Formulation and evaluation of valsartan film coated tablets. J Chem Pharm Res, 2010; 2(5):534–40.
Sunaric S, Petkovic M, Denic M, Mitic S, Pavlovic A. Determination of ibuprofen in combined dosage forms and cream by direct UV spectrophotometry after solid-phase extraction. Acta Poloniae Pharm, 2013; 70(3):403–11.
USP-NF. The United States pharmacopeia 42, national formulary 37. United States Pharmacopeial Convention, Rockville, MD, 2019.
Xie F, Ji S, Cheng Z. In vitro dissolution similarity factor (f2) and in vivo bioequivalence criteria, how and when do they match? Using a BCS class II drug as a simulation example. Eu J Pharm Sci, 2015; 66:163–72. CrossRef