INTRODUCTION
Various fatty acids and their derivatives extracted from animal fats are used as emulsifiers and major ingredients in numerous cosmeceutical and pharmaceutical products (Alvarez and Rodríguez, 2000). Tallow is an extracted animal fat obtained from double boiling or rendering animal carcasses and fat wastes. Generally, tallow is derived from fats of beef, mutton, and lamb which are mainly composed of triglycerides. The fatty acid composition of beef tallow is established by a blend of saturated fatty acids (SFAs) including palmitic acid and stearic acid and unsaturated fatty acids (USFAs) categorized in accordance with the number of double bonds as monounsaturated fatty acids, especially palmitoleic acid and oleic acid, or polyunsaturated fatty acids, namely, linoleic acid (Rezaei et al., 2013). Oleic acid is employed as a penetration enhancer in topical and transdermal pharmaceutical preparations while linoleic and linolenic acids are employed as emollients in skincare products (Lodén, 2003). Thus, fatty acid composition affects the quality of beef tallow.
Various rendering methods apply heat to let the fat out of the adipocytes. Rendering methods are typically divided into dry processing and wet processing depending upon the water requirement. Dry rendering is an uncomplicated process in which water in fat tissues is expelled by heat. This process is ordinarily performed at a high temperature in excess of 150°C. Fatty acids and bioactive components in rendered fat can be degraded under an excessive heat condition for a long period of time. Accordingly, the method development in fat extraction is required for improving the quality of tallow. Double boiling is a method for rendering fat from adipose tissues using a double boiler at low heat. Dry rendering is a system usually using a low-temperature (LT), continuous heating process to remove fat from fat trimmings (Lin and Tan, 2017). Microwave (MW) rendering using MW oven appliances refers to the oscillating electric field resulting molecular frictions of dipole water molecules and then the temperature of adipose tissues increases rapidly. Thus, microwaving is employed for extracting fat from adipocytes under high-temperature conditions (Zhang et al., 2013).
Rancidification is a degradation process of fats in the presence of oxygen, light, water, or bacterial enzymes occurring through lipid oxidation and/or hydrolysis. These reactions not only bring about rancid flavor and unpleasant taste but also deteriorate the quality of fats. It is well known that lower-quality tallow is used in soap manufacturing (Chizoo et al., 2017) but higher-quality and bioactive tallow can be utilized as a cosmetic active ingredient. In order to efficiently exploit waste fat generated from beef cattle, it is inevitable to develop a proper dry rendering process for tallow extraction. The most suitable process can improve the quality and increase the value of tallow.
As mentioned previously, qualified beef tallow with biological activity can be formulated as a lotion bar for improving skin disorders such as aging skin, dermatitis, and psoriasis. Generally, lotion bars are composed of wax, butter, oil, and some additives. Qualified beef tallow was selected as a bioactive ingredient due to its fatty acid composition and antioxidant activity. Therefore, the purpose of this study was to extract beef tallow from fresh beef adipose tissues by using various rendering methods. Tallow was assessed for yield, physicochemical property, fatty acid composition, and antioxidant activity. Then the selected tallow was prepared as lotion bars for skincare. Hardness, homogeneity, color, microbial loads, and heavy metal contents of the final lotion bars were evaluated using standard methods.
MATERIALS AND METHODS
Beef tallow
A sample of 20 kg of frozen beef adipose tissues (carcass fat) obtained from Minapat Co. Ltd., Nakhon Pathom, Thailand, was randomly collected from the storage containers on different production days. Samples were trimmed and washed with distilled water. The fat trimmings were separated into hard fat (HF) and soft fat (SF). Each fat was cut into small cubes (1 × 1 × 1 cm), thoroughly mingled, separately weighed, and rendered using three methods. The dry rendering process including double-boiling (DB), LT, and MW rendering methods was used to render HF and SF giving six kinds of tallow samples (DBHF, DBSF, LTHF, LTSF, MWHF, and MWSF, respectively) as shown in Table 1 and Figure 1.
For the DB method, beef fat (100 g) was placed in a stainless double boiler and was warmed at 90°C ± 1°C for 60 minutes. In the case of the LT method, beef fat (100 g) was put in a nonstick frying pan and was rendered on an electric hot plate at 80°C ± 1°C for 10 minutes and constantly stirred. For the MW method, beef fat (100 g) was put in a porcelain bowl and was heated at a power level of 900 W (135°C ± 1°C) for 5 minutes using a MW oven (GE107Y, Samsung, Thailand) and stirred every 2 minutes.
After the obtained hot liquid was filtered through a double-layer muslin cloth, anhydrous sodium sulfate was gradually added to the filtrate for eliminating traces of water until the drying agent no longer lumped together. All tallow samples were individually kept in tight-seal amber glass containers at −20°C.
Physicochemical properties
All tallow samples were determined for their saponification values (SV), iodine values (IV), acid values (AV), peroxide values (PV), color intensities, moisture contents, refractive indexes, and heavy metal contents as stated in our previous report (Ponphaiboon et al., 2018). Potassium hydroxide, potassium iodide, sodium thiosulfate, and Wijs solution were procured from Sigma-Aldrich Chemical Corporation (St. Louis, MO). An autotitrator model 848 Titrino plus (Metrohm, Herisau, Switzerland) was used in titrations. The yellow intensities of tallow samples were measured using an UV-Vis spectrophotometer model Hitachi U-2900 (Hitachi High-Technologies Corporation, Tokyo, Japan) with solvent adaptation. Thirty milligrams of each sample was dissolved in 3 ml of ethyl acetate and then its absorbance recorded at 425 nm. Six samples were conducted in triplicate and averaged. A Karl Fischer moisture titrator model 848 Titrino plus (Metrohm, Herisau, Switzerland), Karl Fischer reagent HYDRANAL-Composite 5 (Sigma-Aldrich, St. Louis, MO), and absolute methanol (Merck KGaA, Darmstadt, Germany) were used for determining water contents in tallow samples. The refractive indexes of the samples were determined using a digital refractometer model NAR-1T Liquid (Atago Co. Ltd., Tokyo, Japan) at 40°C ± 0.1°C.
 | Table 1. Code of tallow samples showing types of fats and extraction methods. [Click here to view] |
Method development for determination of fatty acid composition
The aim of this section was to develop and validate a simple method for the simultaneous analysis of fatty acid composition in tallow samples.
Standards and solvents
Methyl heptadecanoate (C17:0) (Lot No. N-17M-A8-X) and fatty acid standards such as capric acid (C10:0) (Lot No. N-10A), lauric acid (C12:0) (Lot No. N-12A-S8-T), myristic acid (C14:0) (Lot No. N-14A-M), palmitic acid (C16:0) (Lot No. N-16A), palmitoleic acid (C16:1) (Lot No. U-40A), stearic acid (C18:0) (Lot No. N-18A), oleic acid (C18:1) (Lot No. U-46A-MA14-W), linoleic acid (C18:2) (Lot No. U-59A-M), and linolenic acid (C18:3) (Lot No. U-62A-M) were acquired from Nu-Chek Prep, Inc., Elysian, MN. Methanol, sulfuric acid, and chloroform were of analytical reagent grade from Merck KGaA, Darmstadt, Germany.
Chromatographic analysis
The chromatographic separation involved the employment of a capillary fused silica column HP-INNOWax 19091N-113 (30 m × 0.32 mm × 0.25 μm film of polyethylene glycol) equipped with a gas chromatography-flame ionization detector (GC-FID) model 6890N (Agilent Technologies, Santa Clara, CA) at a flow rate of 1.5 ml/min. The inlet and detector temperatures were set as 250°C and 300°C, respectively. The oven temperature program providing high resolution and symmetrical peaks was held at 180°C for 12 minutes, subsequently increased to 240°C at the rate of 5°C/min, and then held for 12 minutes. The head pressure was set to establish the flow rates of hydrogen, air, and makeup nitrogen gas at 30, 300, and 30 ml/min, respectively. The split ratio was selected at 80:1 and the injection volume of sample solution was 1.0 μl. Fatty acids were recognized by comparing retention times and peak areas of fatty acid methyl esters (FAMEs) in tallow samples with those obtained from the FAME standard mixture.
Preparation of solutions
Methyl heptadecanoate was dissolved in chloroform to obtain an internal standard solution of 5,000 μg/ml. Each fatty acid standard was weighed differently (12.5–225 mg) into a 50 ml volumetric flask and then individually diluted with a reagent solution of methanol:sulfuric acid:chloroform (17:3:20 v/v/v) to attain standard stock solutions with a concentration range of 250–4,500 μg/ml. Standard stock solutions were mixed and then diluted by adding a reagent solution to obtain fatty acid mixture solutions with an estimated concentration range of 40–3,750 μg/ml. Each tallow sample (500 mg) placed into a 5 ml volumetric flask was diluted in a reagent solution to achieve 100 and 20 mg/ml sample solutions, respectively.
Preparation of FAMEs
FAMEs were prepared by a single-step extraction and transesterification conforming to our previous report (Ponphaiboon et al., 2018) with some adjustments. Three milliliters of the analyte solution was pipetted into a 10 ml glass test tube with a screw cap and then the acid-catalyzed esterification was executed in an AccuBlock™ Digital Dry Bath (Labnet International, Inc., Edison, NJ) at 90°C for 30 minutes. After cooling down to 25°C–28°C, ultrapure water (1,000 μl) and internal standard solution (500 μl) were poured into the reaction mixture and then vortexed for 1 minutes. The aqueous layer was tossed out and the organic layer was dried with anhydrous sodium sulfate (1 g). The resulting solution was promptly analyzed in triplicate using a developed GC-FID method.
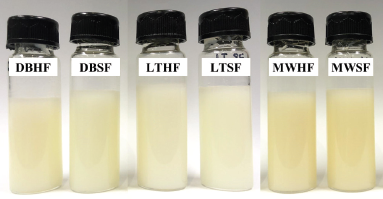 | Figure 1. Tallow samples obtained from HF and SF using DB, LT, and MW rendering methods, respectively. [Click here to view] |
Method validation
The method was validated in consonance with the International Conference on Harmonization guidelines Q2 (R1) (European Medicines Agency, 1995) and Official Methods of Analysis (AOAC) guidelines (AOAC International, 2019). Selectivity was determined by investigating the complete separation of all analyzed FAMEs on a GC chromatogram. The FAME standard mixture in a concentration range of 125–2,250 μg/ml was analyzed in six replicates to evaluate the system suitability parameters.
The six serial dilutions covering the concentrations of each FAME component assay level in the ranges of 0.01–0.25 mg/ml (methyl esters of capric acid, lauric acid, myristic acid, and palmitoleic acid), 0.30–4.50 mg/ml (methyl ester of palmitic acid), 0.18–2.50 mg/ml (methyl ester of stearic acid), 0.18–2.05 mg/ml (methyl ester of oleic acid), 0.08–0.98 mg/ml (methyl ester of linoleic acid), and 0.03–0.49 mg/ml (methyl ester of linolenic acid) were used to investigate the linearity. The injection of each dilution was managed in six replicates and then the linearity was approximated from the calibration curves. For constructing calibration curves, the standard solutions were examined in triplicate.
The method of spike recovery was employed to evaluate the accuracy of the method. Three concentrations at 50%, 100%, and 150% of each FAME standard were added to the tallow samples using a reagent solution as a diluent. All recovery solutions were prepared in triplicate. After synthesis of FAMEs and addition of internal standard, the resulting solutions were individually analyzed by GC-FID and the average recoveries subsequently calculated.
The precision of the method was evaluated by repeatability (n = 10) and intermediate precision (n = 10) of six preparations at a single concentration obtained on the same day and different days, respectively, and expressed as the percent relative standard deviation (RSD) and percent difference.
The limits of detection (LODs) and limits of quantitation (LOQs) were assessed by preparing a serial dilution from a stock standard solution with the concentration ranges of 0.0103–0.2700 mg/ml (methyl esters of capric acid, lauric acid, myristic acid, and palmitoleic acid), 0.1874–4.4980 mg/ml (methyl ester of palmitic acid), 0.1041–2.4980 mg/ml (methyl ester of stearic acid), 0.0851–2.0420 mg/ml (methyl ester of oleic acid), 0.0420–1.0080 mg/ml (methyl ester of linoleic acid), and 0.0208–0.4980 mg/ml (methyl ester of linolenic acid). LODs and LOQs were then calculated depending on the standard deviation (SD) of the response (σ) and the slope of the calibration curve (S) as follows: LOD = 3.3 σ/S, LOQ = 10 σ/S.
Robustness was studied by changing the gas flow rate and detector temperature. The robustness testing was performed in five replicates and evaluated by the percent difference.
Antioxidant activity
2,2-Diphenyl-1-picrylhydrazyl (DPPH), ferrous chloride, 6-hydroxy-2,5,7,8-tetramethyl chroman-2-carboxylic acid (trolox), linoleic acid (Nu-Chek Prep, Inc., Elysian, MN), ammonium thiocyanate (Ajax Finechem, Hindmarsh, Australia), and an UV-Vis spectrophotometer model Hitachi U-2900 (Hitachi High-Technologies Corporation, Tokyo, Japan) were used to determine antioxidant activities of tallow samples. Free radical scavenging activity and lipid peroxidation inhibition were evaluated based on the procedure published in our previous paper (Ponphaiboon et al., 2018) with minor modifications and trolox was used as a standard compound.
Heavy metal analysis
Inductively coupled plasma (ICP) multielement standard solution XIII was purchased from Agilent Technologies (Santa Clara, CA). The sample digested with a 60% v/v nitric acid solution using a MW digester model ETHOS ONE (Milestone Corporation, Sorisole, Italy) was analyzed by inductively coupled plasma-mass spectrometer (ICP-MS) model 7500ce (Agilent Technologies, Santa Clara, CA) as in our previous report (Ponphaiboon et al., 2018).
Microbial contamination test
All microbiological tests of tallow samples were accomplished according to the United States Pharmacopeia 42 (The United States Pharmacopeial Convention, 2019a) for pharmaceutical microbiology testing including microbial enumeration tests and tests for specified microorganisms. Acceptance criteria are based upon the total aerobic microbial count (TAMC), the total combined yeasts and molds count (TYMC), and individual results of Staphylococcus aureus, Pseudomonas aeruginosa, Clostridium spp., and Candida albicans.
Formulation and evaluation of lotion bars
All formulations were prepared by mixing the ingredients including qualified tallow, shea butter (Lot No. K3ET0G, MySkinRecipes, Bangkok, Thailand), and bee wax (Lot No. 2108117, P.C. Drug Center, Bangkok, Thailand). A ternary phase diagram was used to determine the amount of each component. Accurate weights of tallow, shea butter, and bee wax were taken in a beaker. The mixture was heated on a temperature-controlled water bath at a temperature of 75°C until the components were homogeneous. After cooling down to 50°C, butylated hydroxytoluene (BHT) (Lot No. 0114812, Jebsen & Jessen, Bangkok, Thailand) was added to the liquid at the concentration of 0.1% w/w. Stirring was continued until a smooth and consistent liquid was obtained. The resulting liquid was slowly poured into each mold and then left to harden at room temperature.
Hardness values of lotion bars were measured by a texture analyzer model TA. XTPlus (Stable Micro Systems Ltd., Godalming, UK) with conical probe Perspex (Part code: P/45C). Parameters employed for the test were pretest speed 1.00 mm/s, test speed 1.00 mm/s, posttest speed 10 mm/s, and distance of 5 mm. All measurements were conducted at 25°C ± 2°C in triplicate. Homogeneity was analyzed by visual inspection. The Commission Internationale de l'Eclairage L*a*b* was used to explain the precise 3D location of color. In this color system, L* is employed to explicate the relative lightness while a* and b* designate redness-greenness and yellowness-blueness, respectively. The L*, a*, and b* parameters were analyzed by a colorimeter model WF30 (Shenzhen Wave Optoelectronics Technology Co., Ltd., Shenzhen, China). Microbiological contamination and heavy metal concentrations in the formulations were also determined.
Physical stability tests
Physical stability tests were performed under six cycles of heating-cooling stages between refrigerator temperatures 4°C ± 1°C and 40°C ± 1°C/65% ± 2% relative humidity for 24 hours at each temperature. Parameters evaluated were hardness, homogeneity, and color. At the end of stability testing, a microbial contamination test was conducted on all formulations.
Statistical analysis
All measurements were expressed as mean ± SD. Linear regression and SD were conducted using Microsoft Excel 2010. LODs and LOQs were calculated based on the SD of the response and slope using the STEYX function in Microsoft Excel. Data was analyzed using the one-way analysis of variance for determining the differences among yields and physicochemical properties and an independent t-test for comparing fatty acid contents between HF and SF in Statistical Package for the Social Sciences Statistics 16.0 with a 5% level of significance.
RESULTS AND DISCUSSION
Extraction yield
As shown in Table 2, there were no significant differences between extraction yields in DBHF, DBSF, LTHF, LTSF, and MWSF while MWHF exhibited the highest yield. In the case of using the same type of fat, the extraction yield increased with increasing the temperature of rendering according to a previous report (Zhang et al., 2013) while, in terms of the extraction method applied, the extraction yields of HF were higher than those of SF. The results revealed that the high-temperature MW method was a high-yield method for tallow extraction and HF was a high-yield source of tallow.
Physicochemical properties
As illustrated in Figure 1 and Table 2, all tallow samples were off-white to pale yellow. Samples obtained from the MW method had more yellow intensity than those from the DB and LT methods. Within the high-temperature MW method, MWHF, and MWSF were of a darker yellow indicating that high temperature exacerbated the Maillard browning, accelerating oxidation, and demolishing of pigments (Zamora and Hidalgo, 2011) in tallow samples.
Traces of water can cause hydrolytic rancidity and bacterial contamination in tallow. Thus, it is necessary to remove moisture from tallow. As can be seen in Table 2, moisture contents of all tallow samples ranged from 0.08% to 0.10% which was less than the acceptable limit (< 0.2%) (Sharma et al., 2013).
The experimentally determined values and the allowable limits of edible tallow set by Codex Standard for Named Animal Fats (CODEX-STAN 211-1999) for refractive index, SV, IV, AV, PV, and heavy metal concentration are presented in Table 2. The refractive index is a value used to identify tallow and determine its purity and identity (Zamora and Hidalgo, 2011). The refractive indexes of all samples were fairly similar, in the range 1.4551–1.4592 with regard to the acceptable limit (1.448–1.460). In addition, tallow samples obtained from SF tended to have relatively high average refractive indexes suggesting that SF has a high proportion of USFAs (Devi and Khatkar, 2017).
SV is a measurement of the average molecular weight of fatty acids in triglycerides found in fats. Fatty acids with higher molecular weight (lower SV) presented in fats have a smaller number of carboxylic groups per unit mass of fat as compared to those with lower molecular weight (higher SV). In this study, the SV of all tallow samples were remarkably close to each other (192.38–192.74 mg KOH/g fat) and met the acceptable limit (190–202 mg KOH/g fat) as shown in Table 2. All tallow samples exhibited high SV which suggested that they had strong potentials for application in cosmetic formulations (Mikulcová et al., 2017).
IV is a criterion used to determine the degree of unsaturation of fatty acids present in fats. Fats with high IV are prone to oxidative degradation during storage. As seen in Table 2, there were no statistically significant differences in any of the IV (28.26-30.01 g I2/100 g fat) and all of them were lower than the permissible limit of IV (40-53 g I2/100 g fat). Tallow samples obtained from SF (DBSF, LTSF, and MWSF) showed higher IV than those from HF (DBHF, LTHF, and MWHF) indicating that SF has greater percentages of USFA. Animal fats with high IV will become less stable and more vulnerable to oxidation in relation to their high degree of unsaturation (Shin et al., 2019). Although IV values of all tallow samples were below the permissible limit for human consumption, they have a low chance of going rancid. Therefore, the obtained tallow samples were suitable for use in cosmetics.
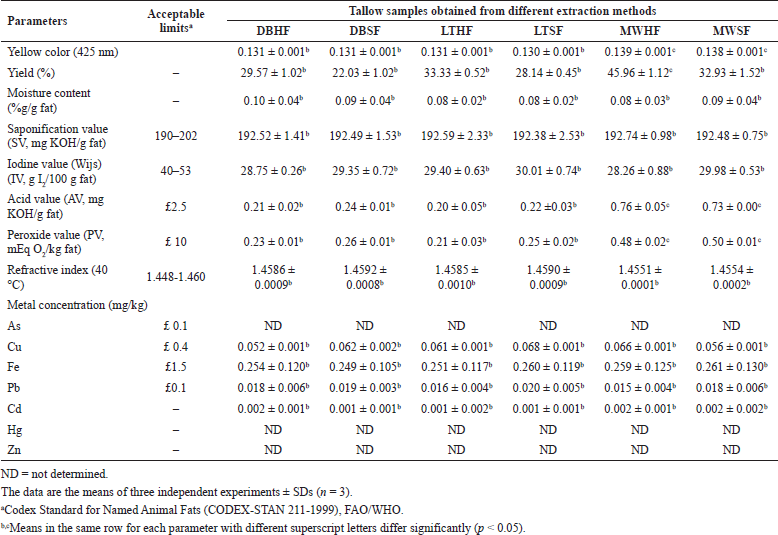 | Table 2. Color, yields, and physicochemical properties of tallow samples. [Click here to view] |
AV is routinely used to measure the content of free fatty acids resulting from the hydrolysis of triglycerides. As presented in Table 2, AV of all samples (0.20-0.76 mg KOH/g fat) were lower than the permissible limit (≤ 2.5 mg KOH/g fat). The AV of MWHF and MWSF were significantly higher than those of DBHF, DBSF, LTHF, and LTSF. The increment of AV in tallow samples prepared using the MW method indicates high rates of triglyceride hydrolysis while the decrement of AV in tallow samples obtained using the LT and DB methods indicates good chemical stability.
PV is used to evaluate the amount of peroxides occurring from lipid oxidation. As seen in Table 2, the PV of all samples (0.21-0.45 mEq O2/kg fat) were lower than the permissible limit (≤ 10 mEq O2/kg fat) whereas the PV of MWHF and MWSF were about two times greater than those of DBHF, DBSF, LTHF, and LTSF. The results of high AV and PV represented that the high-temperature MW method in a noticeably short period of time could increase hydrolysis and lipid oxidation.
Determination of fatty acid composition in beef tallow
For optimization of the GC-FID condition, there was no effect on peak areas and thermal stability of analytes and internal standard when the detector temperature was fixed at 300°C. As shown in Figure 2, all standard FAMEs separated within 24 minutes presented sharp, symmetrical peaks with high resolution values (>4). The retention time increases in the following order: methyl caprate < methyl laurate < methyl myristate < methyl palmitate < methyl palmitoleate < methyl stearate < methyl oleate < methyl linoleate < methyl linolenate.
Figure 3 shows a GC-FID chromatogram of FAMEs in the sample solution at the concentration of 20 mg/ml. All FAME components were properly separated with selectivity factors larger than 1 (1.10–1.69) demonstrating good selectivity. The retention times of nine FAMEs in tallow samples were compared with those achieved from each coinjection of the FAME standard mixture in the presence of the internal standard. The corresponding retention times of all FAME analytes and no interfering peaks found at the retention times of analytes in tallow samples indicate the adequate selectivity of the method.
The results of system suitability used to verify the appropriate chromatographic system for all analytes were as follows: RSD of peak area ratio was < 2.0 (0.0561–1.0411), resolution of each peak was > 1.5 (4.1083–38.2367), tailing factor was < 1.5 (0.7277–0.9833), capacity factor was ≥ 2.0 (3.5142-14.2063), and theoretical plate number was > 10,000 (24,837–222,496). The linearity was obtained from six concentration levels covering the ranges of quantitation limit of each component assay level. The regression equations and the correlation coefficient (r) values were summarized in Table 3. The data demonstrated that nine FAMEs of standards had good linearity because the r values of the regression lines ranged from 0.9993 to 0.9998.
Table 3 shows the average recoveries calculated from three independent assays for three levels of each standard. The method revealed good accuracy with the overall recoveries ranged from 93.83% to 112.51% with RSD(n = 9) from 0.72 to 2.25. For method precision, the repeatability was evaluated using the results of nine FAME standards. The RSDs of all standards were found to be 2.12%–3.56%. The intermediate precision was determined by results analyzed on different days. The percent difference between 2 days ranged from −0.12% to 3.10%.
As indicated in Table 3, the lowest and the highest LODs were found to be 0.0040 mg/ml for myristic acid and 0.0955 mg/ml for palmitic acid, respectively. Similarly, the LOQs of myristic acid and lauric acid (0.0135 mg/ml) and palmitic acid (0.3182 mg/ml) were found to have the same tendency as the lowest and the highest values, respectively.
Robustness of the method was determined by varying the gas flow rate (± 0.01 ml/min) and detector temperature (± 1°C) but using the same column and sample. The results showed that the percent differences of each fatty acid content found in the spiked sample under each of the altered conditions and the experimental condition were within ± 0.05% of that found in the experimental condition. These small absolute changes indicate that the proposed method is robust (Zhang et al., 2015).
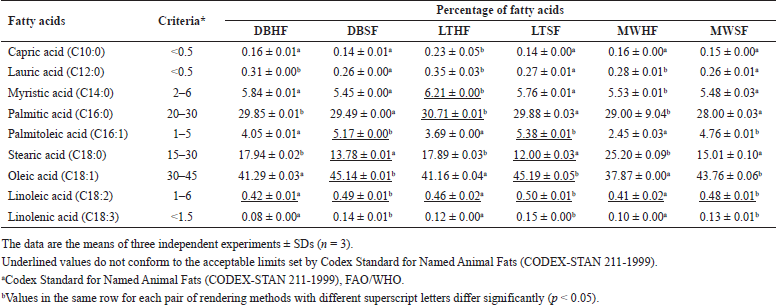
The obtained results from method validation were agreeable to the acceptance criteria (ICH, 1995; ICH, 1997). Thus, the developed GC-FID method is valid for quantitative analysis of fatty acids in tallow samples. Table 4 presents the fatty acid compositions of samples obtained from HF and SF using three different rendering methods. The results revealed that the three highest fatty acid contents in all samples were oleic acid, palmitic acid, and stearic acid followed by myristic acid, palmitoleic acid, linoleic acid, lauric acid, capric acid, and linolenic acid. The considerable fatty acids of all samples were relatively consistent with those from other studies (Rezaei et al., 2013; Lisitsyn et al., 2013). However, the fatty acid contents (underlined values in Table 4) of some samples do not conform to the acceptance criteria (Codex Alimentarius, 1999). The contents of linoleic acid in all samples were also less than the acceptable limit.
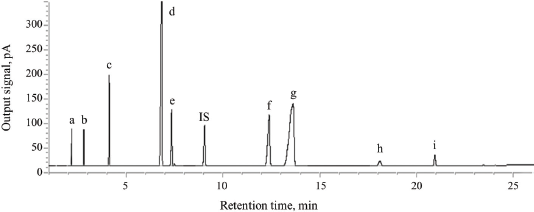 | Figure 2. GC chromatogram of standard FAMEs [(a) methyl caprate; (b) methyl laurate; (c) methyl myristate; (d) methyl palmitate; (e) methyl palmitoleate; (f) methyl stearate; (g) methyl oleate; (h) methyl linoleate; (i) methyl linolenate) and IS = internal standard (methyl heptadecanoate). [Click here to view] |
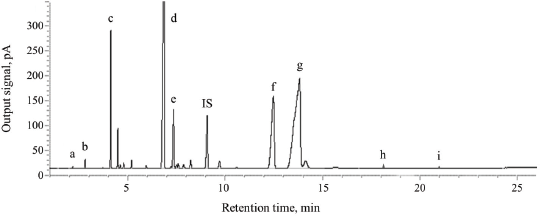 | Figure 3. GC chromatogram of FAMEs in 20 mg/ml tallow sample [(a) methyl caprate; (b) methyl laurate; (c) methyl myristate; (d) methyl palmitate; (e) methyl palmitoleate; (f) methyl stearate; (g) methyl oleate; (h), methyl linoleate; (i) methyl linolenate] and IS = internal standard (methyl heptadecanoate). [Click here to view] |
 | Table 3. Results of linearity, accuracy, LODs, and LOQs. [Click here to view] |
As mentioned in the previous report (Lisitsyn et al., 2013), the fatty acid composition of tallow can be manipulated by many factors such as sex, age, health status, genetic type, diet, and freshness. Animal wastes were considered valuable resources for the manufacturing of value-added materials and chemicals. In this study, beef tallow was rendered from waste fats to increase value and reduce waste. Although the fatty acid composition of each tallow sample did not meet the standards of edible tallow, they contained predominant fatty acids such as oleic acid, palmitic acid, and stearic acid that should be sufficient for moisturizing normal human skin and preventing water loss from the skin surface (Lodén, 2003; Rezaei et al., 2013; Ahmad and Ahsan, 2020).
In terms of the same rendering method applied, the tallow sample obtained from SF had significantly higher concentrations of USFAs but lower SFA content, as compared with those from HF, and vice versa (Table 4). In the case of the LT method, LTSF showed the highest contents of USFAs while LTHF exhibited the highest contents of SFAs except for stearic acid. Although the LT method did not accomplish the highest extraction yield (Table 2), it was considered a good alternative method because it was a simple and efficient method for extraction of USFAs and SFAs from SF and HF, respectively (Table 4).
Antioxidant activity of beef tallow
Antioxidant activities of tallow samples were evaluated in terms of SC50 values of DPPH and percentage inhibition of linoleic acid oxidation as evidenced in Table 5. The SC50 values of the samples ranged from 27.12 ± 2.65 to 32.12 ± 2.26 mg/ml while the SC50 of trolox was 0.13 ± 0.01 mg/ml. The DPPH radical scavenging activities can be arranged in the following order: trolox > LTSF > LTHF > DBSF > DBHF > MWSF > MWHF. The MWSF and MWHF showed the lowest antioxidant activities even though they were not significantly different (p > 0.05) from LTSF, LTHF, DBSF, and DBHF. These results suggest that high temperature from the MW method could cause undesirable degradation of antioxidants in MWSF and MWHF in consonance with previous research (Singh et al., 2020).
At the concentration of 4.0 mg/ml in the reaction mixture, all incubated samples inhibited linoleic acid peroxidation from 30.15 ± 3.05 to 32.45% ± 4.12% after 7 days of incubation as indicated in Table 5. There were no statistically significant differences (p > 0.05) in these percentages while they were significantly lower (p < 0.05) than that of trolox (52.27% ± 3.59%). The percentage inhibition of all samples decreased in the order trolox > LTSF > LTHF > DBSF > DBHF > MWSF > MWHF. The results revealed that the antioxidant potencies determined by the assay of linoleic acid peroxidation follow the same trend as those obtained by the DPPH method. Therefore, tallow samples (LTSF and LTHF) that possessed higher antioxidant activity were obtained from the LT method. As seen from Tables 4 and 5, the samples with high concentrations of USFAs obtained especially from SF appeared to have strong antioxidant activity.
Natural antioxidants have preventive effects in several oxidative stress conditions (Adwas et al., 2019). Accordingly, antioxidants found in tallow samples might prevent oxidative stress in aging human skin. Thus, tallow with antioxidant activity could be used as an excipient in skincare products.
Heavy metal contents in beef tallow
All tallow samples were analyzed for arsenic (As), copper (Cu), iron (Fe), lead (Pb), cadmium (Cd), mercury (Hg), and zinc (Zn) using ICP-MS. The concentrations of Cu, Fe, Pb, and Cd were in the ranges of 0.052–0.068, 0.249–0.261, 0.015–0.020, and 0.001–0.002 mg/kg, respectively, whereas As, Hg, and Zn were not detected in tallow samples as demonstrated in Table 2. Heavy metal concentrations in all samples were within the permissible limits (Codex Alimentarius, 1999).
Microbial loads in beef tallow
The results from the microbial limit test and pathogen determination revealed that all tallow samples had no TAMC and TYMC. In addition, the contamination of S. aureus, P. aeruginosa, Clostridium spp., and C. albicans was undetected in 1 g of any samples. All samples complied with the microbiological criteria set in USP42 (The United States Pharmacopeial Convention, 2019b).
Formulation and evaluation of lotion bars containing qualified beef tallow
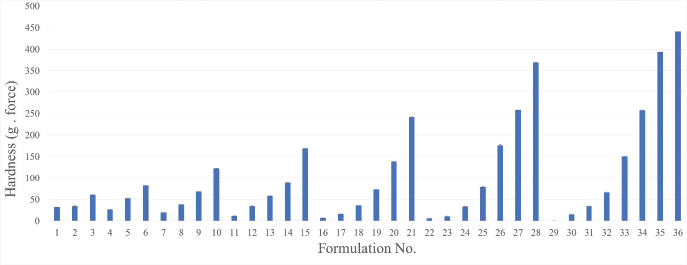
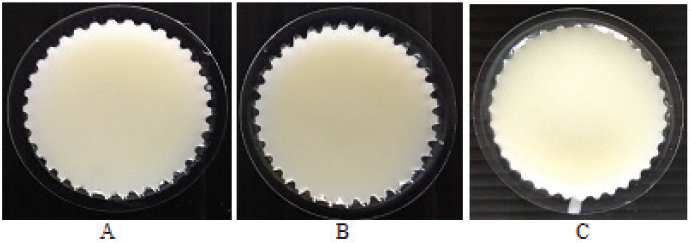
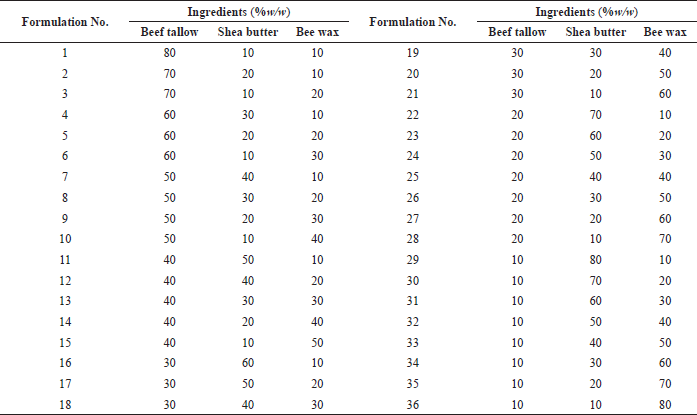
Based on the above analysis, LTSF showed the highest content of USFAs and antioxidant activity (Tables 4 and 5). Moreover, microbial loads and heavy metal contents of LTSF were within acceptable limits (Codex Alimentarius, 1999). LTSF was consequently chosen as an active ingredient of lotion bars. Thirty-six formulations of lotion bars were prepared with the composition as given in Table 6. BHT was used as a preservative and antioxidant to prevent microbial growth and inhibit lipid oxidation, respectively. As shown in Figure 4, increasing the ratio of bee wax tended to increase the hardness of lotion bars. This result is consistent with a previously published study (Kasparaviciene et al., 2016). Figure 5 and Table 6 show that formulations No. 3, No. 13, and No. 19 having beef tallow: shea butter: bee wax in the ratios of 70:10:20, 40:30:30, and 30:30:40 were found to be more stable with good homogeneity and appropriate hardness (60.80 ± 2.29 g. force, 58.23 ± 2.70 g. force, and 73.23 ± 2.79 g. force, respectively) proving incredibly attractive. Oleic acid, the main mono-unsaturated fatty acid (MUFA) of beef tallow, had good penetration ability through the skin for topical and transdermal formulations (Kaur and Garg, 2017). Consequently, formulated lotion bars containing beef tallow with antioxidant activity could be used for normal human skin to improve skin health. Compared with others, formulation No. 13 was easy to apply on the skin surface and was of a nongreasy nature. It was therefore subjected to a stability study.
 | Table 4. Fatty acid composition of tallow samples. [Click here to view] |
 | Table 5. Antioxidant activities of tallow samples. [Click here to view] |
 | Figure 4. Hardness values (g. force) of 36 formulations of lotion bars. *Hardness value of formulation No. 29 was not determined because it did not harden well. [Click here to view] |
 | Figure 5. Physical appearances of lotion bar formulations No. 3 (A), No. 13 (B), and No. 19 (C). [Click here to view] |
Stability
Stability testing was carried out for formulation No. 13 by heating/cooling for six cycles. No phase separation was found in the samples during stability testing. However, the hardness was partially reduced from 58.23 ± 2.70 g. force to 52.23 ± 2.70 g. force. Nevertheless, the formulations kept under two different conditions were found to return to the beginning characteristics after being placed at room temperature for 2 hours. The color difference (Δ E*) before and after the stability test was low (0.58) and the color parameters were similar. Results obtained revealed that formulation No. 13 was considered physically stable.
Formulation No. 13 possessed 0.025 ± 0.002 mg/kg of Cu, 0.098 ± 0.025 mg/kg of Fe, and 0.008 ± 0.004 mg/kg of Pb, while no Cd, As, Hg, and Zn contents were detected. It also exhibited TAMC and TYMC less than 10 colony-forming units per gram (CFU/g) and free from specified microorganisms including S. aureus, P. aeruginosa, Clostridium spp., and C. albicans. The results conformed to the acceptance criteria in USP42 (The United States Pharmacopeial Convention, 2019b).
CONCLUSION
All tallow samples obtained from various rendering methods of HF and SF were within the permissible limits of SV, AV, PV, refractive index, heavy metal content, and microbial contamination. However, LTSF produced by the LT rendering method of SF was the weakest yellow, exhibited the greatest antioxidant activity, and showed the highest content of USFAs. Consequently, the LT rendering method at 80oC in a short period of time should be the most appropriate method for the extraction of tallow and the SF might be a good source of USFAs and antioxidants. For these reasons, LTSF was the most suitable for formulation of lotion bars. The 36 formulations were prepared by varying the composition of tallow, shea butter, and bee wax and then they were evaluated for their physicochemical properties. The study showed that nongreasy formulation No. 13 containing 40% w/w beef tallow, 30% w/w shea butter, and 30% w/w bee wax was found to be safe and stable. The formulated lotion bars composed of antioxidants and USFAs including palmitoleic acid, oleic acid, linoleic acid, and linolenic acid were believed to promote healthy skin. This specific formulation should continue to be tested for clinical trials.
 | Table 6. Composition of various lotion bar formulations. [Click here to view] |
AUTHOR CONTRIBUTIONS
All authors made substantial contributions to conception and design, acquisition of data, or analysis and interpretation of data; took part in drafting the article or revising it critically for important intellectual content; agreed to submit to the current journal; gave final approval of the version to be published; and agree to be accountable for all aspects of the work. All the authors are eligible to be an author as per the international committee of medical journal editors (ICMJE) requirements/guidelines.
FUNDING
This study was supported by the Faculty of Pharmacy, Silpakorn University and the Product Development Project under Innovative House by the Thailand Science Research and Innovation (TSRI) and the National Science and Technology Development Agency (NSTDA) (grant number RDG6150054).
CONFLICTS OF INTEREST
The authors report no financial or any other conflicts of interest in this work.
ETHICAL APPROVALS
This study does not involve experiments on animals or human subjects.
PUBLISHER’S NOTE
This journal remains neutral with regard to jurisdictional claims in published institutional affiliation.
REFERENCES
Adwas AA, Elsayed ASI, Azab AE, Quwaydir FA. Oxidative stress and antioxidant mechanisms in human body. J Appl Biotechnol Bioeng, 2019; 6(1):43–7.
Ahmad A, Ahsan H. Lipid-based formulations in cosmeceuticals and biopharmaceuticals. Biomed Dermatol, 2020; 4:12; doi:10.1186/s41702-020-00062-9. CrossRef
Alvarez AMR, Rodríguez MLG. Lipids in pharmaceutical and cosmetic preparations. Grasas y Aceites, 2000; 51(1-2):74-96. CrossRef
AOAC International. Official methods of analysis. Association of Official Analytical Chemist. Washington DC, 2019.
Chizoo E, Sunday UC, Chimankpam EM, Nwoye OV, Uwaoma OA. Extraction of Nigerian beef tallow by wet rendering process and its characterization. WNOFNS, 2017; 15:129–38.
Codex Alimentarius. Codex standard for named animal fats (CODEX-STAN 211-1999). Section 3. Codex standard for fats and oils from animal sources. 1999. Avialable via: http://www.fao.org/3/y2774e/y2774e05.htm (Accessed 10 June 2021)
Devi A, Khatkar BS. Relationship of physical properties of fats and oils with quality characteristics of cookie. Int J Innov Res Sci Eng Technol, 2017; 6(8):1567–72.
European Medicines Agency. ICH Q2 (R1) Validation of analytical procedures: text and methodology. CPMP/ICH/381/95, London, United Kingdom, 1995.
ICH Q2A. International Conference on Harmonization: Guideline for Industry: Text on the Validation of Analytical Procedures, Availability. Federal Register, 1995; 60(40):11260-2.
ICH Q2B. International Conference on Harmonization: Guidance for Industry Q2B Validation of Analytical Procedures: Methodology, Availability. Federal Register, 1997; 62(96):27463-7.
Kasparaviciene G, Savickas A, Kalveniene Z, Velziene S, Kubiliene L, Bernatoniene J. Evaluation of beeswax influence on physical properties of lipstick using instrumental and sensory methods. Evid-Based Complementary Altern Med, 2016;2016(8):1–8; doi:10.1155/2016/3816460 CrossRef
Kaur N, Garg R. Optimization and evaluation of oleic acid based unsaturated fatty acid liposomes gel. J Bioequiv Availab, 2017; 9(3):424–9.
Lin L, Tan F. Influence of rendering methods on yield and quality of chicken fat recovered from broiler skin. Asian-Australas J Anim Sci, 2017; 30:872–7. CrossRef
Lisitsyn AB, Chernukha IM, Ivankin AN. Comparative study of fatty acid composition of meat material from various animal species. Sci J Anim Sci, 2013; 2(5):124–31.
Lodén M. Role of topical emollients and moisturizers in the treatment of dry skin barrier disorders. Am J Clin Dermatol, 2003; 4(11):771–8. CrossRef
Mikulcová V, Kašpárková V, HumpolíÄek P, Buňková L. Formulation, characterization and properties of hemp seed oil and its emulsions. Molecules, 2017; 22(5):700; doi:10.3390/molecules22050700. CrossRef
Ponphaiboon J, Limmatvapirat S, Chaidedgumjorn A, Limmatvapirat C. Physicochemical properties, fatty acid profiles, and antioxidant activities of ostrich oils as affected by different rendering methods. LWT-Food Sci Technol, 2018; 93:45–50. CrossRef
Rezaei F, Gharachorloo M, Azizinejad R. Fractionation of Iranian beef tallow – chemical and physical evaluations of the fractions. J Food Biosci Technol, 2013; 3:37–40.
Sharma H, Giriprasad R, Goswami M. Animal fat-processing and its quality control. J Food Process Technol, 2013; 4:8; doi:10.4172/2157-7110.1000252
Shin D, Kim DH, Yune JH, Kwon HC, Kim HJ, Seo HG, Han SG. Oxidative stability and quality characteristics of duck, chicken, swine and bovine skin fats extracted by pressurized hot water extraction. Food Sci Anim Resour, 2019; 39(3):446–58. CrossRef
Singh AP, Fathordoobady F, Guo Y, Singh A, Kitts DD. Antioxidants help favorably regulate the kinetics of lipid peroxidation, polyunsaturated fatty acids degradation and acidic cannabinoids decarboxylation in hempseed oil. Sci Rep, 2020; 10:10567; doi.org/10.1038/s41598-020-67267-0. CrossRef
The United States Pharmacopeial Convention. <1111> Microbiological examination of nonsterile products: Acceptance criteria for pharmaceutical preparations and substances for pharmaceutical use. 37th edition, The United States Pharmacopeia, 42nd rev., and the national formulary. Rockville, MD, 2019b.
The United States Pharmacopeial Convention. 61 Microbiological examination of nonsterile products: microbial enumeration tests. 37th edition, The United States Pharmacopeia, 42nd rev., and the national formulary. Rockville, MD, 2019a.
Zamora R, Hidalgo FJ. The maillard reaction and lipid oxidation. Lipid Technol, 2011; 23(3):59–62. CrossRef
Zhang H, Wang Z, Liu O. Development and validation of a GC–FID method for quantitative analysis of oleic acid and related fatty acids. J Pharm Anal, 2015; 5:223–30. CrossRef
Zhang L, Yin B, Rui H. Effects of microwave rendering on the yield and characteristics of chicken fat from broiler abdominal fat tissue. J Food Sci Technol, 2013; 50(6):1151–7. CrossRef