
INTRODUCTION
Pexidartinib is an anticancer drug targeting the tyrosine kinase inhibition by blocking colony stimulating factor 1 or its receptor path (Giustini et al., 2018). This drug is mainly used to treat symptomatic 10 synovial giant cell tumors (TGCT) in adults, which are accompanied with critical morbidness or functional limits and are not controlled to development with surgery. These tumors are non-malignant tumors which induce the tendon sheath and synoviums to overgrow and thicken, leading to damage of adjacent joint tissues. This drug also acts by inhibiting the immune response which is activated in the TGCT. While surgery is a current standard of care for TGCT, some of the tumors are clinically not effective and there is a high risk for lifetime relapse (Espinosa et al., 2009; Hume and MacDonald, 2012). This drug acts by inhibiting immune reactions that are triggered in the TGCT. As per the clinical trials, data on pexidartinib show that in TGCT patients there is a development in functional outcomes and symptoms of the patient. In the market, it is available as an oral formulation, under the brand name of Turalio. Chemically, pexidartinib is designated as 5-[(5-Chloro-1H-pyrrolo [2,3-b] pyridin-3-yl) methyl]-N-{[6-(trifluoromethyl)-3-pyridinyl]methyl}-2-pyridinamine with a molecular weight and formula of 417.82 and C20H15ClF3N5, respectively (Fig. 1) (Cannarile et al., 2017; FDA, 2019).
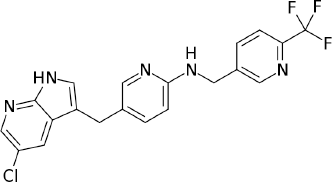 | Figure 1. Structure of pexidartinib. [Click here to view] |
Literature on pexidartinib revealed that no analytical procedure for the quantification of drugs in bulk and formulations is described. The development of a high throughput technique like LC–MS/MS is highly essential for the quantitation of pexidartinib in biological matrices. Furthermore, we aimed at applying the developed method to study the pharmacokinetics in healthy rabbits.
MATERIALS AND METHODS
Reagents and chemicals
Ledipasvir (IS) was acquired from MSN Labs, Ahmedabad, India. Pexidartinib was procured from Sreeni Labs Pvt Ltd., Hyderabad. Water used was collected from water purification systems (MilliQ, USA) mounted in the lab. Formic acid of analytical grade and acetonitrile of liquid chromatography (LC) grade were provided by JT Baker, Hyderabad, India. The study was approved by the Institutional Ethical Committee with no. 1292/ac/09/CPCSEA/17-49/A.
Apparatus and software
A modular LC system (Shimadzu, Japan) comprising an LC 20AD pump, DGU-30A4 solvent degasser, efficiency SIL-HTC autosampler, and CTO-AS-column thermostat was utilized for the work. A triple quadrupole mass spectrometer (API-4000) was furnished with a turbo ion–spray interface. Analyst 1.5 software was utilized for data monitoring.
Calibration standards
A stock solution of 1 mg/ml of pexidartinib was processed freshly by solubilizing 10 mg of the drug in 10 ml methanol of 70% v/v. Eight different calibration standards were processed by spiking blank plasma with the pexidartinib standard solution to get concentration levels of 72.45, 150.0, 325.0, 650.0, 1,020.0, 1,420.0, 1,780.0, and 2,173.5 ng/ml.
Quality control standards
These solutions were prepared at three different levels of lowest quality control (LQC), medium quality control (MQC), and high quality control (HQC) standards. These quality control (QC) solutions were processed according to calibration standards to get concentrations of 150, 1,449, and 2,173.5 ng/ml for LQC, MQC, and HQC, respectively. Prepared solutions were store at −20°C until the samples were analyzed.
Chromatography parameters
Isocratic LC elution was achieved on a ZorbaxSB-C18 column (250 × 4.6 mm × 5 μm) with formic acid (0.1% v/v) and acetonitrile in the proportion of 20:80 as mobile phase. The LC system was operated at 0.90 ml/minutes flow rate with a single runtime of 6.5 minutes. The column and autosampler temperatures were monitored at 40.0°C and 5.0°C, respectively, with a 0.9 ml/minutes infusion flow rate.
Mass system parameters
The mass instrument was operated in the positive ionization mode. The specific optimized mass instrument settings for pexidartinib and IS were curtain gas 25 psi, ion source gas 1 (ISG) 50 psi, ISG2 50 psi, ion spray voltage 4,500 V, and turbo spray temperature 550°C. Quantitative analysis was carried out by multiple reaction monitoring of the pairs of transitions m/z 418.10→242.02 for pexidartinib and 889.4→130.0 for ledipasvir, with 100 ms per transition as well as time. Pexidartinib and IS precursor ions were formed by declustering potential of 150 and 155 V, respectively, and precursor ions of pexidartinib and IS were converted into fragments at collision energies of 20 and 20 eV with nitrogen (N2) gas at a pressure of 5 arbitrary units (Chen and Hsu, 2013; Patel et al., 2017; Shaha et al., 2017)
Sample preparation method
The sample solution was prepared by transferring 250 μl of plasma and 50 μl of ledipasvir (1 μg/ml) into a polypropylene tube and vortexed for 2 minutes. Pexidartinib and IS were extracted with 4 ml of ethyl acetate as solvent and were subjected to centrifugation at 5,000 rpm for 25 minutes at 5.0°C. After centrifugation, the organic phase was separated and it was dried using lyophilizer. The resulting product was made to solubilize in 250 μl of the mobile phase and then it was transferred into pre-labeled vials. The vials were kept in an autosampler and infused into the LC system.
Validation
The developed technique was subjected to validation for specificity, selectivity, linearity, stability, matrix effect, carryover effect, recovery, precision, and accuracy (ICH, 2005; US FDA, 2001).
Selectivity and specificity
The interfering endogenous components with analytes were identified by close analysis of six batches of blank human plasma samples from variable sources. Blank and lower limit of quantification (LLOQ) (72.45 ng/ml) samples were prepared from each batch and infused into the LC–MS/MS system and results were analyzed. To measure the interference between IS and analytes, blank samples were spiked with analyte and IS separately and the results were evaluated. The peak response of interfering compound should less than 20% in the response of LLOQQC (Rana et al., 2008).
Linearity
Calibration standards (non-zero) of eight different concentrations of 72.45, 150.0, 325.0, 650.0, 1,020.0, 1,420.0, 1,780.0, and 2,173.5 ng/ml were freshly prepared and quantified in three separate runs. Calibration curves (peak area ratio of analyte and IS peaks vs. nominal concentration) were plotted by least squares linear regression and reciprocal of the squared concentration (1/x2) used as a weighting factor. Deviation should be within ± 20% for LLOQ and +15% for remaining concentrations (Patel et al., 2017).
Recovery studies
Recovery of pexidartinib was assessed by equating the average peak response of extracted samples against the unextracted samples at the concentration level of LQC, MQC, and HQC standards. The overall mean percentage recovery was calculated from percentage recovery at each concentration level (Shaha et al., 2017).
% Recovery of analyte = Mean analyte peak response in extracted samples / Mean analyte peak response in unextracted sample × 100
Accuracy and precision
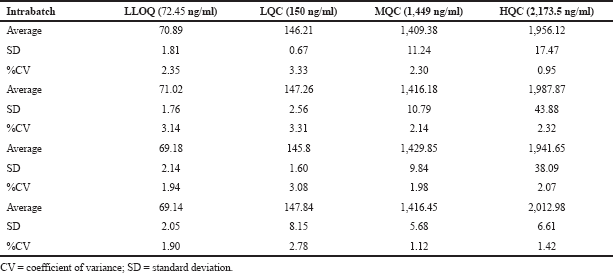
These parameters were measured in terms of intraday and interday. Intraday accuracy and precision were assessed by injecting QC samples (150, 1,449, and 2,173.5 ng/ml) and LLOQ (72.45 ng/ml) in five duplicates a day arbitrarily. Interday accuracy and precision were measured from the examination of every QC standard (150, 1,449, and 2,173.5 ng/ml) solutions and LLOQ QC standard (72.45 ng/ml) once a day for five dissimilar days.
Matrix effect
Prepare one sample each of LQC and HQC after extraction in six different blank matrix lots (postextraction spiked samples). Simultaneously, prepare six replicates of equivalent aqueous / neat QC samples and analyze. Evaluate the matrix factor for analyte and IS in each lot using the following formula:
Matrix Factor = Peak response in presence of matrix ions / Average peak response in aqueous samples
Carryover test
Carryover test was assessed by infusing a solution at upper limit of quantification (ULQC) (2,898 ng/ml) and two blank plasma samples immediately after ULQC infusion. The peak response of the initial blank sample at retention time (RT) of pexidartinib should be <20% of the peak response of an LLOQ sample.
Stability studies
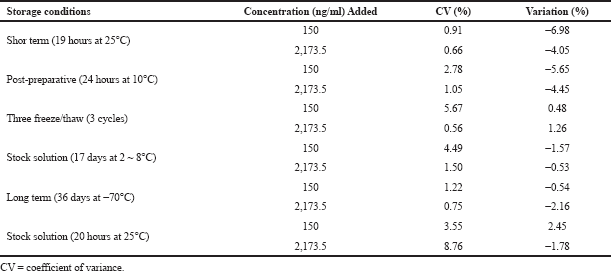
Three sets of samples were processed without the presence of any residue extracted from blank plasma by directly spiking the analyte into the reconstitution sample. In the post-preparative stability study, three aliquot HQC and LQC samples were kept at 10.0°C in an autosampler for 24 hours and examined; the resulting data were equated with those original findings. Three aliquot samples of every HQC and LQC were stored in a deep freezer (at −70.0°C) for 36 days. The solutions were assessed and the resulting concentrations were equated with the actual values of control standard sample solutions to estimate the long-term stability of analytes. Three aliquot sample solutions each of HQC and LQC levels were monitored at 25°C for 19 hours in order to found the short-term stability of the analyte. The freeze and thaw stability of analytes was estimated after three freeze–thaw cycles at LQC and HQC samples. During the freeze cycle, the samples were kept at −70°C for 24 hours and during the thaw cycle, the samples were kept at room temperature. After three freeze–thaw levels, the concentration of standard samples was determined. Separate standard working solutions containing pexidartinib and IS were prepared and kept at 25°C and 2~8°C for 20 hours and 17 days (Titier et al., 1997; Yen and Kuang, 2013).
In-vivo bioavailability studies
Six male rabbits of about 2–3 kg were opted for pharmacokinetics. Rabbits were fasted 12 hours before drug administration till 48 hours post-dosing. Water was provided for animals during the examination. A dose of 25 mg of drugs was administered to rabbits and 0.60 ml blood samples were taken through the ear vein of animals earlier to drug administration and during the time being of 0.50, 1.00, 1.50, 2.00, 2.50, 3.00, 4.00, 5.00, 6.00, 8.00, 12.00, 16.00, 24.00, 36.00, and 48.00 hours. Consequential solutions were kept in a centrifuge to operate at 5,000 rpm for 20 minutes and the separated plasma samples were relocated into a polypropylene prelabeled tubes at −20°C (Patel et al., 2011; Shashidhar et al., 2011; Wozniakiewicz et al., 2014). The in-vivo animal bioavailability protocol was accepted by the institutional animal ethical committee with reference no. 1292/ac/09/CPCSEA/17-49/A.
RESULTS AND DISCUSSION
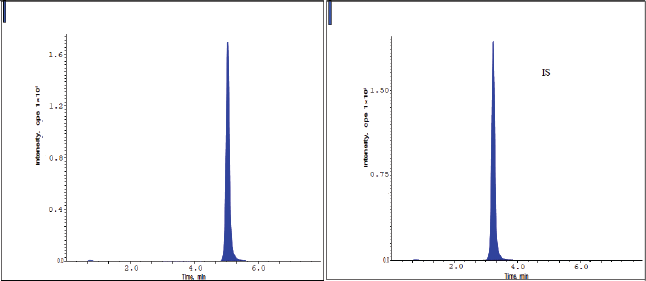
The chromatograms of blank, HQC, MQC, and LQC samples are shown from Figures 2–5. The developed research technique validated for the parameters linearity, specificity, sensitivity, carryover, accuracy, precision, and stability studies. The results for the validation parameters are given in the following paragraphs.
Specificity
From the typical chromatograms shown in Figures 2 and 3, no interference peaks from matrix components were detected at the retaining times of drug samples and IS. The RT of pexidartinib and IS were 5.12 and 3.31 minutes. The total elution time for pexidartinib was 6.5 minutes.
Linearity
The calibration graphs are plotted between the 72.45 and 2,173.5 ng/ml concentration range with eight calibration standards for the analysis of linear regression. The linear regression line equation was found to be y = 0.994x + 2.662 with r2 = 0.999. The coefficient of variance (%CV) measured for the calibration graph was found to be ≤3.73 for pexidartinib. The results are presented in Table 1.
Recovery and matrix effect
The average percentage recovery of pexidartinib at LQC, MQC, and HQC samples was found to be 90.70%, 86.49%, and 85.86%, respectively, and the results are tabulated in Table 2. This parameter was calculated by determining the %CV values for HQC and LQC samples and was found to be 1.64% and 0.70%, respectively. The findings are shown in Table 3.
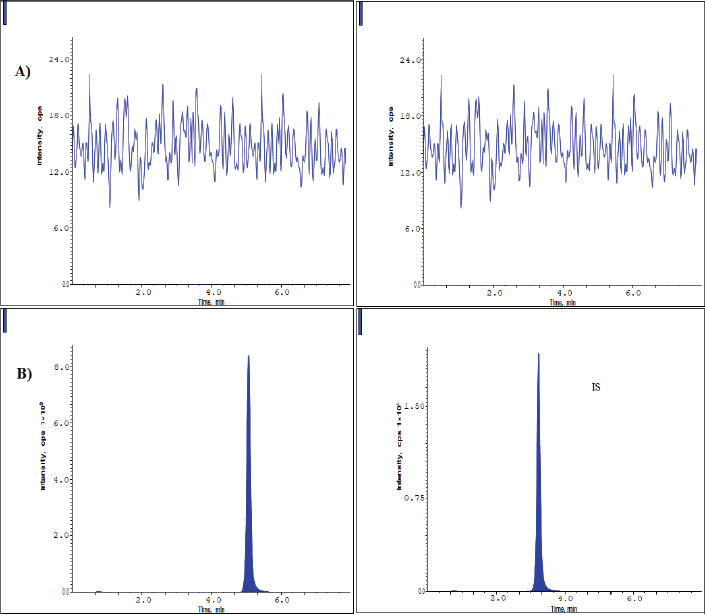 | Figure 2. Chromatograms of blank plasma (A) and LLOQ (B) samples. [Click here to view] |
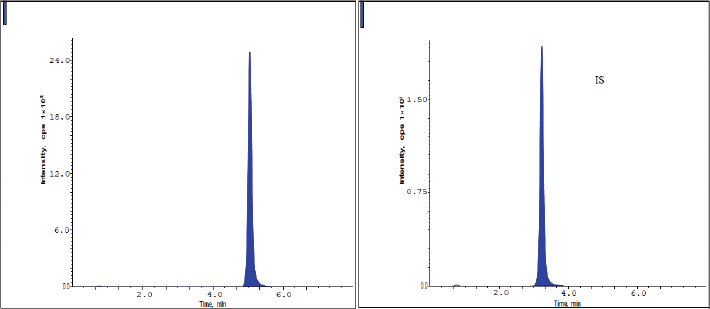 | Figure 3. Chromatograms of pexidartinib at the LQC level. [Click here to view] |
 | Figure 4. Chromatograms of pexidartinib at the MQC level. [Click here to view] |
 | Figure 5. Chromatograms of pexidartinib at the HQC level. [Click here to view] |
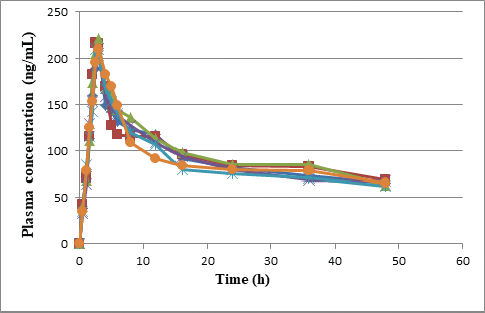 | Figure 6. Plasma concentration time profile curves of six rabbits. [Click here to view] |
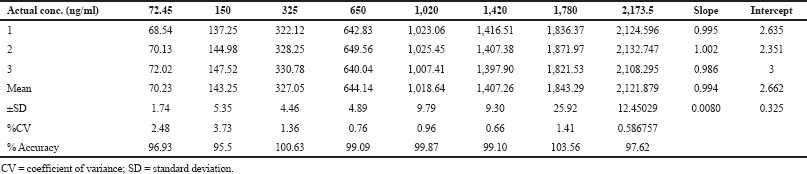 | Table 1. Linearity of pexidartinib. [Click here to view] |
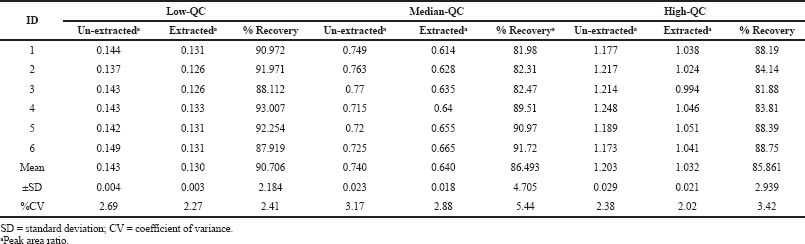 | Table 2. %Mean Recovery of pexidartinib. [Click here to view] |
 | Table 3. Matrix effect results for pexidartinib. [Click here to view] |
Accuracy and precision
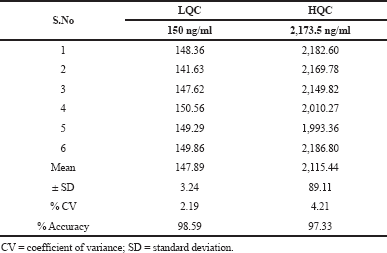
Accuracy and precision were assessed by determining the average intraday and interday precisions of the analytical technique at the QC samples. All the findings were within the acceptance limit of precision, i.e., 15%. The findings for precision and accuracy are presented in Table 4.
Stability studies
From the result of stability studies, there was no degradation of analyte that occurred during the chromatographic technique; extraction and sample storage of pexidertinib occurred during the chromatographic technique and extraction and also sample storage of pexidartinib plasma samples at different storage conditions. Results of the stability data are presented in Table 5.
Application of pharmacokinetic study
The pharmacokinetic parameters of pexidartinib were calculated from the graph obtained by taking time on X-axis and plasma sample concentrations on Y-axis using PKSolver software. In this study, trapezoidal rule was considered for the calculation of area under the curve from 0 to 48 hours (AUC0-48). Pexidartinib showed a Tmax of 3.09 ± 0.14; and mean Cmax and AUC0→last for test formulation were 211.63 ± 11.045 and 4,448.8 ± 257.892, respectively. The findings are shown in Tables 5, and 6 and Figure 6.
 | Table 4. Intraday and interday QC samples for pexidartinib. [Click here to view] |
 | Table 5. Stability of pexidartinib in human plasma. [Click here to view] |
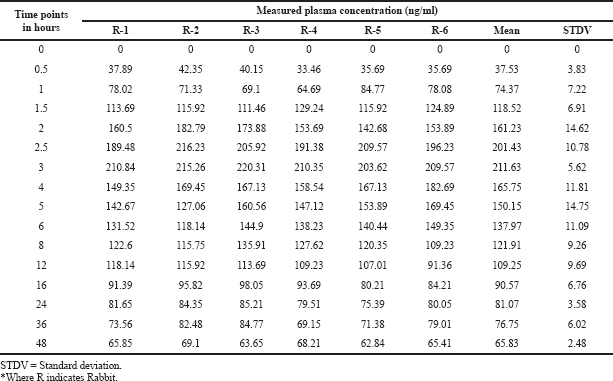 | Table 6. Plasma concentrations at different timings. [Click here to view] |
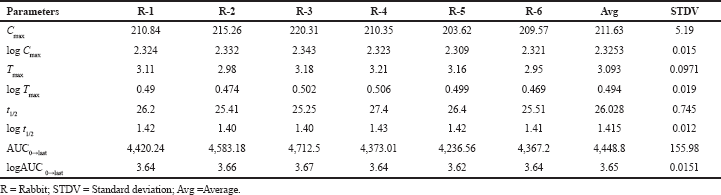 | Table 7. Test animals pk parameters’ mean values. [Click here to view] |
CONCLUSION
A simple and specific validated LC–MS/MS technique was established for the quantification of Pexidartinib, which provided high sensitivity with the liquid–liquid extraction method. The developed technique was subjected to validation with respect to the parameters of specificity, sensitivity, carryover, recovery, precision, matrix effect, accuracy, and stability. The drug and IS were eluted within 6.5 minutes on ZorbaxSB-C18 column (250 × 4.6 mm x 5 μm) with acetonitrile and 0.1% v/v formic acid in water in the ratio of 80:20 as mobile phase with 0.9 ml/minutes infusion flow rate. This analytical method also applied successfully to study bioavailability studies in healthy rabbits. Pexidartinib showed Tmax of 3.09 ± 0.14; and mean Cmax and AUC0→last for test formulation were 211.63 ± 11.045 and 4,448.8 ± 257.892, respectively.
ACKNOWLEDGMENTS
Declared none.
AUTHOR CONTRIBUTIONS
All authors made substantial contributions to conception and design, acquisition of data, or analysis and interpretation of data; took part in drafting the article or revising it critically for important intellectual content; agreed to submit to the current journal; gave final approval of the version to be published; and agree to be accountable for all aspects of the work. All the authors are eligible to be an author as per the international committee of medical journal editors (ICMJE) requirements/guidelines.
FUNDING
There is no funding to report.
CONFLICTS OF INTEREST
The authors report no financial or any other conflicts of interest in this work.
ETHICAL APPROVALS
This study does not involve experiments on animals or human subjects.
PUBLISHER’S NOTE
This journal remains neutral with regard to jurisdictional claims in published institutional affiliation.
REFERENCES
Cannarile MA, Weisser M, Jacob W, Jegg AM, Ries CH, Ruttinger D. Colony-stimulating factor 1 receptor (CSF1R) inhibitors in cancer therapy. J Immunother Cancer, 2017; 5(1):53. CrossRef
Chen YA, Hsu KY. Development of a LC-MS/MS-based method for determining metolazone concentrations in human plasma: application to a pharmacokinetic study. J Food Drug Anal, 2013; 21:154–9. CrossRef
Espinosa I, Beck AH, Lee CH, Zhu S, Montgomery KD, Marinelli RJ, Ganjoo KN, Nielsen TO, Gilks CB, West RB, van de Rijn M. Coordinate expression of colony-stimulating factor-1 and colony-stimulating factor-1-related proteins is associated with poor prognosis in gynecological and nongynecological leiomyosarcoma. Am J Pathol, 2009; 174(6):2347–56. CrossRef
FDA. Available via https://www.accessdata.fda.gov/drugsatfda_docs/label/2019/211810s000lbl.pdf (Accessed December 2019a).
FDA. Available via https://www.fda.gov/media/124893/download (Accessed December 2019b).
FDA. Available via https://www.fda.gov/news-events/press-announcements/fda-approves-first-therapy-rare-joint-tumor (Accessed December 2019c).
Fidman B, Nogid A. Role of tapentadol immediate release (Nucynta)in the management of moderate-to-severe pain. Pharm Ther, 2010; 35(6):330–57.
Giustini N, Bernthal NM, Bukata SV, Singh AS. Tenosynovial giant cell tumor: case report of a patient effectively treated with pexidartinib (PLX3397) and review of the literature. Clin Sarcoma Res, 2018; 10(8):14. CrossRef
Hume DA, MacDonald KP. Therapeutic applications of macrophage colony-stimulating factor-1 (CSF-1) and antagonists of CSF-1 receptor (CSF-1R) signaling. Blood, 2012; 119(8):1810–20. CrossRef
ICH. Guidelines for validation of analytical procedures: text and methodology. Q2(R1) ICH, Geneva, Switzerland, 2005; pp 1–14.
Patel DS, Sharma N, Patel MC. Development and validation of a selective and sensitive LC–MS/MS method for determination of cycloserine in human plasma: application to bioequivalence study. J Chromatogr B, 2011; 879:2265–73. CrossRef
Patel NP, Sanyal M, Sharma N, Patel DS, Shrivastav PS, Patela BN. Highly sensitive LC–MS/MS technique to estimate doxepin and its metabolite nordoxepinin human plasma fora bioequivalencestudy Highly sensitive LC–MS/MS method toestimate doxepin and itsmetabolite nordoxepin in human plasma for a bioequivalence study. J Pharm Anal, 2017; 6:145–50. CrossRef
Rana S, Uralets VP, Ross W. A new method for simultaneous determination of cyclic antidepressants and their metabolites in urine using enzymatic hydrolysis and fast GC-MS, J Anal Toxicol, 2008; 32:355–63. CrossRef
Shaha JV, Shah PA, Shah PV, Sanyal M, Shrivastav PS. Fast and sensitive LC–MS/MS method for the simultaneous determination of hydrochlorothiazide and lisinopril in plasma sample. J Pharm Anal, 2017; 7:163–9. CrossRef
Shashidhar Reddy D, Rao P, Devaraj VC. A highly sensitive LC-Ms/Ms method for determination of desvenlafaxine in Rabbit plasma and its application to Rabbit pharmacokinetic study. J Anal Bioanal Tech, 2011; 2(5):2–6. CrossRef
Titier K, Castaing N, Le-Deodic M. Quantification of tricyclic antidepressants and monoamine oxidase inhibitors by high-performance liquid chromatography-tandem mass spectrometry in whole blood. J Anal Toxicol, 1997; 21:200–7. CrossRef
US FDA. Guidance for industry bioanalytical method validation, Food and Drug Administration. Center for Drug Evaluation and Research (CDER), Rockville, MD, 2001.
Wozniakiewicz M, Wietecha-PosÅ‚uszny R, Moos A. Development of micro extraction by packed sorbent for toxicological analysis of tricyclic antidepressant drugs in human oral fluid. J Chromatogr A, 2014; 1337:9–16. CrossRef