
INTRODUCTION
Drug–drug interaction (DDI) resulted from alteration of pharmacological effect of a drug by activity of another drug which may lead to decrease drug efficacy, delayed drug absorption, and harmful adverse effect (Lu et al., 2017). Apart from polypharmacy, which is the use of multiple drugs concurrently, potential interactions between medications with herbal medicinal products and dietary supplements could also increase the risk of adverse drug events (Agbabiaka et al., 2018).
Pharmacokinetic interactions may occur during administration, absorption, distribution, metabolism, or elimination of a drug. In addition to the activation of prodrugs, the metabolism process also deactivates many drugs, creating more polar metabolites suitable for excretion. Phase I metabolism takes place in the endoplasmic reticulum of hepatocytes, often utilizing the cytochrome P450 (CYP450) enzyme system (Corrie and Hardman, 2011). The CYP450 enzymes are membrane-bound hemoproteins that play important roles in the detoxification of xenobiotics, cellular metabolism, and homeostasis. Induction or inhibition of CYP enzymes, especially CYP3A4 that is responsible for biotransformation of over 50% of therapeutic drugs, is a major underlying mechanism of DDIs (Manikandan and Nagini, 2018).
In the field of drug discovery, it is worth considering how well a drug’s safety by in vitro screening of potential DDI could arise clinically. The development of a reliable in vitro model for screening of DDI such as CYP450 inhibition is crucial to reduce the number of animals used in preclinical experiments (Costa et al., 2013). Martignoni (2006) reported that various CYP3A isoforms are species-dependent in terms of substrate and inhibitor specificities, making the extrapolation from animal to human quite risky. There are many in vitro models that have been established to investigate CYP450 inhibitory activities of known and new drug compounds. Primary human hepatocytes are considered the "gold standard" for in vitro evaluation of hepatic metabolism and toxicity of drugs as the primary cell culture maintains normal cellular physiology and intercellular contacts (LeCluyse et al., 2005). However, genetic polymorphism of the donor and limited lifespan of primary hepatocyte culture may impair reproducibility.
Human liver microsome (HLM), the subcellular fractions derived from the endoplasmic reticulum of hepatocytes, is one of the best characterized in vitro models for drug metabolism study (Asha and Vidyavathi, 2009). Despite its simplicity in use and easy storage, HLM is prone to degradation due to the freeze-thaw cycle and it has low specificity for single enzyme inhibition study due to its vast range of phase 1 and phase 2 metabolism enzymes. Hepatocyte cell lines are also used in metabolism studies as they are easy to be maintained and have an unlimited lifespan. The limitation of hepatocyte cell lines such as HepG2 (human liver carcinoma) is that the expression and activity of CYP3A4 are low and the cell responded weakly towards various inducers (Gerets et al., 2012). Another human hepatic cell line, WRL-68, preserves the activity and characteristic of specific liver enzymes, produces alpha-fetoprotein and albumin, and exhibits a cytokeratin pattern similar to other hepatic cultures (Gutiérrez-Ruiz et al., 1994). In addition, findings from a previous study indicated that WRL-68 cells are able to undergo differentiation in vitro and exhibit an antigenic profile that highly resembles human liver cells (Cízková et al., 2005). This cell line however is understudied for its potential to be developed further as an in vitro tool for CYP450 metabolic activities evaluations.
In this study, three different hepatic cell lines known as WRL-68 (fetal normal liver), HepG2 (liver carcinoma), and Chang liver (normal liver) were evaluated for hepatic marker genes expressions in order to determine the best cell line to be developed as metabolism-based cell model with CYP3A4 overexpression. WRL-68 was used for the first time in this study as a host of cDNA overexpression of CYP3A4 and developed as an in vitro model for CYP3A4 inhibition study. This model was characterized for its CYP3A4, cytochrome P450 reductase (POR), and cytochrome b5 (CB5) expression, 6b-hydroxylation activity, and inhibition by luconazole.
MATERIALS AND METHODS
Cell culture
Normal hepatocyte cell line WRL-68 (ATCC® CL-48™) was a gift from Pharmaco-Toxicology Laboratory, Faculty of Pharmacy, Universiti Teknologi MARA. The cell was cultured in DMEM supplemented with 10% FBS and 1% penicillin-streptomycin at 37°C in an incubator supplied with 5% CO2. Cells between passages 10 and 20 were used for assay (Chen et al., 2018).
Transfection
A modified transient transfection protocol described by Longo et al. (2013) was used. 3 × 10⁵ cells were seeded in each well of a 6-well plate. After 24-hour incubation in a humidified atmosphere of 95% air plus 5% CO2 in a 37°C incubator, media were replaced with DMEM without serum. A mixture of 140 µl Polyethylenimine (1 mg/ml) (Polysciences, Warrington, PA), 140 µl of NaCl (150mM), and 3 µg of cDNA containing CYP3A4 gene, pCMV-CYP3A4-green fluorescent protein (GFP) Spark®, or control vector, pCMV-C-GFP Spark® (Sinobiological, China), was incubated at room temperature for 10 minutes before being added to well. The plate was incubated for 4 hours before the media were replaced with DMEM supplemented with 10% FBS and 1% penicillin-streptomycin.
Western blot analysis
A protocol described by Casabar et al. (2010) was used with modifications for Western blot analysis. Cell lysate total protein was quantified using nanodrop A280 prior to separation by SDS-PAGE for 120 minutes at 120 V and transferred onto 0.2 µm PVDF membranes (Merck, Kenilworth, New Jersey) using wet transfer technique. The blots were blocked for 1 hour in Tris-buffered saline (TBS) containing 0.01% Tween 20 and 5% BSA at RT. The blots were then incubated with primary antibodies (1:1,000 dilution) of CYP3A4, POR, CB5, or β-actin (loading control) for 1 hour at room temperature. Then, the blots were washed with TBS containing 0.01% Tween 20 before incubation for 1 hour with horseradish-peroxidase-conjugated secondary antibody (1:10,000 dilutions). After further washing with TBS containing 0.01% Tween 20, blots were incubated in chemiluminescence reagents (Azure Biosystems, Dublin, CA). Finally, Molecular Imaging System (Amersham, Kingsport, TN) was used to detect band intensities.
qRT-PCR
mRNA extraction from the transfected cell was done using NucleoSpin® RNA Kit (Macherey-Nagel, Düren, Germany) according to the manufacturer’s protocol. Template DNA was produced from mRNA using ReverTra Ace® qPCR RT Kit (Toyobo, Japan). qRT-PCR reactions were performed using THUNDERBIRD® SYBR® qPCR Mix (Toyobo, Japan). Each reaction was performed in a total volume of 20 µl, containing 5 µl template DNA, 10 µl sterile RNase free water, 0.3 µM final concentration of each forward and reverse primer, 2 µl THUNDERBIRD® SYBR® qPCR Mix, and 0.4 µl 50× ROX reference dye. The temperature profile entailed the following steps: predenaturation (1 minute at 95°C), followed by 40 cycles of 15 seconds at 95°C and 1 minute at 60°C. Two control genes (β-actin and GAPDH) were included for each run (Feckler et al., 2017). Primers sequence were as follows: CYP3A4 fwd: 5′-CCGAGTGGATTTCCTTCAGC-3′, CYP3A4 rev: 5′-AGGTGGGTGGTGCCTTATTG-3′, POR fwd: 5′-TCTACGACATCGTGGGTGAG-3′, CYP2C9 fwd: 5′-TCCTATCATTGATTACTTCCCG-3′, CYP2C9 rev: 5′-AACTGCAGTGTTTTCCAAGC-3′, POR fwd: 5′-TCTACGACATCGTGGGTGAG-3′, POR rev: 5′-CCAAACACACCCAGGAGACT-3′, CB5 fwd: 5′-CCCTCGCCTTGATGTATCG-3′, GAPDH fwd: 5′-GTCTCCTCTGACTTCAACAGCG-3′, GAPDH rev: 5′-ACCACCCTGTTGCTGTAGCCAA-3′, BACTIN fwd: 5′-CACCATTG GCAATGAGCGGTTC-3′, BACTIN rev: 5′-AGGTCTTTGCGGATGTCCACGT-3′, ALB fwd: 5′- GATGACAGGGCGGACCTTGCC -3′, ALB rev: 5′- GGCAAGGTCCGCCCTGTCATC -3′, Alpha-fetoprotein (AFP) fwd: 5′- ACACAAAAAGCCCACTCCAG -3′, AFP rev: 5′- GGTGCATACAGGAAGGGATG -3′, HNF4A fwd: 5′- TGTCCCGACAGATCACCTC -3′, HNF4A rev: 5′- CACTCAACGAGAACCAGCAG -3′, HPV18E6 fwd: 5′- CACAACATAGCTGGGCACT -3′, HPV18E6 rev: 5′- CTTGTGTTTCTCTGCGTCGT -3′, CYP3A7 fwd: 5′- AAGGGCTATTGGACGTTTGACA -3′, CYP3A7 rev: 5′- ATCCCACTGGCCCGAAAG -3′, CYP2A6 fwd: 5′- AAGATCAGTGAGCGCTTGG -3′, CYP2A6 rev: 5′- TGAATACCACGCCATAGCCT -3′.
6β-Hydroxylation assay
Transiently transfected cells in a 6-well plate with 80% confluency were treated with various concentrations of substrate testosterone (25–200 µM). After incubation of 150 minutes, the media were collected and processed using an optimized method to extract the metabolite 6β-hydroxytestosterone. 250 µl of media was added with 1 ml methanol before vigorous shaking for 5 minutes and then was centrifuged at 14,000 rpm for 15 minutes at 4°C. The supernatant was evaporated to dryness. Samples were dissolved in 150 µl of 5% methanol prior to injection into the HPLC system. For inhibition study, various concentrations of fluconazole were incubated together with testosterone. Total protein was quantified using BCA Protein Assay Kit (Thermofisher, Waltham, MA). Maximum velocity (Vmax) of 6β-hydroxylation, Km of testosterone, IC50, inhibition constant (Ki), and mode of inhibition for fluconazole were determined.
HPLC analysis
The HPLC equipment used for quantifying the metabolite is Dionex Ultimate 3000 UHPLC systems equipped with Diode Array Detector (Thermo Fisher Scientific Inc., Waltham, MA). Separations were performed on Thermo Scientific HypersilTM ODS C18 (150 × 4.6 mm i.d., 3.5 µm particle size) HPLC column (Thermo Fisher Scientific Inc., Waltham, MA). HPLC conditions were adapted from the previously validated method with slight modifications (Purdon and Lehman-McKeeman, 1997). The separation was operated at a column oven temperature of 28°C at a flow rate of 0.7 ml/minutes. The mobile phases “A” and “B” consist of a mixture of water and methanol, respectively. A 50 µl injection volume was injected and the elution gradient for the separation is as follows: initial 5% B (1.25 minutes), 5%–95% B (23.75 minutes), 95% B (5 minutes) 95–5% B (3 minutes), and 5% B (5 minutes). Detection was set at a wavelength of 242 nm. All the standard and sample solutions were injected in triplicate. A 6-point concentration (0.156–5.000 ppm) standard curve of 6β-hydroxytestosterone (R2 = 0.9941) was constructed. The limit of detection and limit of quantification of 6β-hydroxytestosterone are 0.104 ppm and 0.109 ppm, respectively.
RESULTS AND DISCUSSION
Ability to express the majority of drug-metabolizing enzymes, sensitivity to enzyme inducers, and producing similar in vitro metabolic profile as in vivo making primary human hepatocytes a reference cellular model in drug metabolism studies. However, due to its phenotypic instability and difficulty in accessibility, various alternatives have been explored in the previous years to overcome the limitations of the gold standard tool (Castell et al., 2006). While hepatocytes cell lines have advantages in lifespan and stability, one thing that makes them unable to represent in vivo hepatocytes is lacking major CYP450 enzyme activities (Turpeinen et al., 2009). Human hepatoma Huh7 cells have significantly lower CYP450 gene expression and activity in comparison to primary hepatocytes but can be improved with 1 month of confluent culturing; however, this method has never been validated (Bulutoglu et al., 2020). Better hepatic cellular models such as HepaRG cells have also been developed to overcome the problem of low metabolic profiles observed in HepG2 cells (Gerets et al., 2012). However, this application is lacking specificity in studying different CYP450 isozymes activities. For example, the widely accepted probe for phenotyping CYP3A activity, midazolam, acts as a substrate for both CYP3A4 and CYP3A5 (Eap et al., 2004). It is impossible to study the independent activity of both isozymes in metabolizing the same substrate using the HepaRG cell line due to its nonspecific expression of CYP450 enzymes.
One of the methods to overcome these limitations is cell lines with specific recombinant CYP450 enzyme overexpression and HepG2; a hepatocellular carcinoma cell line has been a popular host for the system. In this study, three different hepatic cell lines known as WRL-68, HepG2, and Chang were evaluated for hepatic marker gene expression to find the best host for the overexpression cell model. WRL-68 cell line is an embryonic or fetal normal liver cell which is known as a derivative of HeLa, a cervical carcinoma cell (Wong and Abdul Kadir, 2011). HepG2 was derived from a liver biopsy of a 15-year-old Caucasian male with a differentiated hepatocellular carcinoma and widely used in pharmaco-toxicological research (Donato et al., 2014). Chang cell line established in 1954 was widely used as a human normal hepatocyte model in various studies and was found to have HeLa cell contamination based on isoenzyme analysis, HeLa marker chromosomes, and DNA fingerprinting (Gao et al., 2011).
In choosing the most suitable cell line in this study, expression of several hepatic marker genes as well as CYP450 isozymes genes was evaluated in order to find out whether the fetal liver WRL-68 has differentiated exhibiting adult liver marker genes expression as well as whether the HeLa contaminated liver cell lines possess more hepatic characteristics or indistinguishable from HeLa. This study also aims to find out whether the mentioned cell lines have any better potential to be developed into a metabolism-based cell model with CYP3A4 overexpression in comparison to HepG2, the cell line popularly and widely used in studying CYP450 metabolism. Figure 1 illustrates relative expression of hepatic marker genes as well as CYP450 genes normalized to housekeeping genes (GAPDH and β-actin) in WRL-68, HepG2, and Chang liver as well as HeLa as a control comparison. Figures 1A and B show that HepG2 has a significantly high expression of major CYP450 isozymes in hepatocytes which are CYP3A4 and CYP2C9, respectively. This is supported by a previous study which reported that transcripts of CYP450 isozymes including CYP3A4 and CYP2C9 were present in both cryopreserved hepatocytes and HepG2 cells (Westerink and Schoonen, 2011). However, the cell line that is expressing the lowest basal CYP450 isozymes expression, in this case WRL-68, is more favorable for the overexpression cell model because the enzyme activity has to be specific from exogenous CYP3A4 to avoid significant biotransformation by other basal CYP isozymes. This is because a single drug can be a substrate for different CYP450 isozymes. For instance, although CYP3A4 is the major enzyme responsible for ketamine N-demethylation in HLMs, CYP2B6 and CYP2C9 have also shown a minor contribution in its biotransformation (Hijazi and Boulieu, 2002).
A previous study reported that none of the CYP2A isozymes which include CYP2A6, CYP2A7, and CYP2A13 appear to be expressed in fetal liver and it was suggested that the expression would continue to increase after birth (Kodidela et al., 2017). Figure 1C shows the highest expression of CYP2A6 in HepG2 and is detected in Chang cell line. This is expected as both cell lines are not derived from fetal hepatocytes tissues. Interestingly, WRL-68 has the second highest expression of CYP2A6 suggesting that it has differentiated exhibiting adult liver characteristics. Accounting for 30%–50% of the total fetal CYP450 and 87%–100% of total fetal hepatic CYP3A content, CYP3A7 is known as the most dominant CYP450 isozyme expressed in the human fetal liver (Pang et al., 2012). AFP is a plasma protein produced by the embryonic yolk sac and the fetal liver (Tomasi, 1977). Figures 1D and E illustrate that the expression of CYP3A7 and AFP, respectively, in both WRL-68 and Chang is lower than that of HepG2. AFP also serves as a tumor marker in hepatocellular carcinoma (Murugavel et al., 2008). Usually, mature hepatocytes in adults lose the ability to synthesize AFP; however, after undergoing malignant transformation, the liver cancer cells can regain the ability to synthesize AFP (Wang and Wang, 2018).
HNF4α is a transcriptional regulator which controls the expression of hepatic genes serves as one of the earliest markers associated with the differentiated function of the liver (Gonzalez, 2008). Hepatocytes are responsible for the synthesis of many extracellular proteins and albumin is the most prominent one (WiÅ›niewski et al., 2016). Figures 1F and G show relative expression of HNF4α and albumin. Expression of HNF4α in WRL-68 is the highest among all cell lines and this suggests that the fetal liver cells have undergone differentiation. However, albumin expression is higher in HepG2 cell line. As shown in Figure 1H, Chang cell line has the highest expression of HPV18/E6 gene among all liver cell lines. The human papillomavirus type 18 (HPV 18) E6 and E7 proteins are continuously expressed in cervical carcinoma cells such as HeLa and seem to play a role in tumor development and the maintenance of the malignant phenotype (Goodwin et al., 2000). Chang cell line has the lowest expression of both hepatocyte marker genes among all cell lines and showed a similar expression profile with HeLa cells, which supports the fact that the cell line is HeLa derivative and should not be used for the overexpression cell model.
In addition, the expression of two important CYP450 redox partners known as POR and CB5 was evaluated in the liver cell lines. Figures 1I and J show the highest expression of CB5 in HepG2 and the highest expression of POR in WRL-68, respectively. CYP450 redox partners can be limiting factors in their catalytic reactions. Therefore, it is important to choose the cell line with the optimum expression of CYP450 redox partners as the host for the CYP3A4 overexpression cell model. With a cell line that is readily expressing POR and CB5, no cotransfection with such electron carriers is needed for the enzymatic CYP450 function (Steinbrecht et al., 2019). Although the two electrons required for CYP450 catalytic activity can be provided by POR, the second electron can also be shuttled by CB5 (Pearl et al., 2016). Thus, lower expression of POR in HepG2 could potentially be a rate-limiting factor. Therefore, after evaluating the relative expression of the mentioned genes, WRL-68 is chosen to be developed for the CYP3A4 overexpression cell-based model.
WRL-68 has never been studied for its potential ability as a host for recombinant CYP3A4 overexpression despite its well-characterized hepatic features and morphology. In this study, the WRL-68 cell line was successfully developed into an in vitro metabolism-based assay specifically for CYP3A4 inhibition studies. The overexpressed CYP3A4 is tagged with a GFP at its C-terminal for visualization of transfection efficiency. Time-dependent transfection efficiency and CYP3A4 expression were evaluated at 24, 48, and 72 hours after transfection as illustrated in Figure 2. It was observed that transfection efficiency is optimum (~80%) at 48 hours after transfection and started to decline after 72 hours. Cobblestone-like morphology and doubling time of the transfected cells remain similar to parent cells as shown in Figure 3. No significant cell death or abnormal physical characteristic of the transfected cells has been observed.
Transfected cells at 24, 48, and 72 hours after transfection were further analyzed for CYP3A4 mRNA and protein expression using qRT-PCR and Western blot analysis, respectively, and the results are illustrated in Figure 4. mRNA expression was shown at the highest fold of expression (>2,000-fold) at 48 hours after transfection compared to control cells and supported with a significant band of overexpressed exogenous protein CYP3A4-GFP (84 kDa). This shows that the significantly high mRNA and CYP3A4 expression is indeed due to transcription and translation of cDNA. There is a situation reported by Nowakowski et al. (2017); although exogenous gene is successfully transfected into cells, translation was a major roadblock to exogenous protein expression. In this case, WRL-68 was able to uptake cDNA as well as translate exogenous CYP3A4 resulting in overexpression, thus making WRL-68 an efficient host for CYP3A4 overexpression.
To investigate its ability in performing CYP3A4 metabolism reactions, WRL-68 overexpressing CYP3A4 at 48 hours after transfection was further evaluated for its endogenous POR and CB5 expression. POR is located on the endoplasmic reticulum and an essential electron transfer protein that plays a vital role inet alCYP450 drug metabolism (Porter, 2012). CB5 is a small hemoprotein involved in many biochemical reactions such as fatty acid desaturation process, fatty acid elongation, and cholesterol biosynthesis and also interacts with CYP450 enzymes, taking part in the monohydroxylation process (Bhatt et al., 2017).
CYP450 requires two electrons provided by its redox partners POR and CB5, where the catalytic activities involving substrate binding and metabolite release occur in the membrane landscape (Barnaba et al., 2017). During the catalytic activity of CYP450, CB5 could increase the coupling efficiency of NADPH oxidation and product formation (Porter, 2002). This reduces the chance of the uncoupling process where hydrogen peroxide is produced instead of metabolite due to delayed transfer of the second electron to complete the reduction cycle (Grinkova et al., 2013). This explains the ability of CB5 to enhance rates of metabolism and the importance to evaluate both endogenous POR and CB5 in WRL-68 to ensure that the catalytic activity in the system is efficient.
In Figure 5, Western blot analysis shows that both endogenous POR and CB5 expressions are stable with and without transfection. Therefore, the transfection process and overexpression of exogenous CYP3A4 did not affect the endogenous expression of these two enzymes negatively. CB5 is observed to form multimer and complexes in the system and it is normal as CB5 interaction domain with other redox partners has been reported extensively in the literature (Samhan-Arias et al., 2018). This information regarding the expression of CYP450 redox partners in this cell model emphasized that there is no cotransfection with such electron carriers needed for functional CYP3A4 catalytic activity.
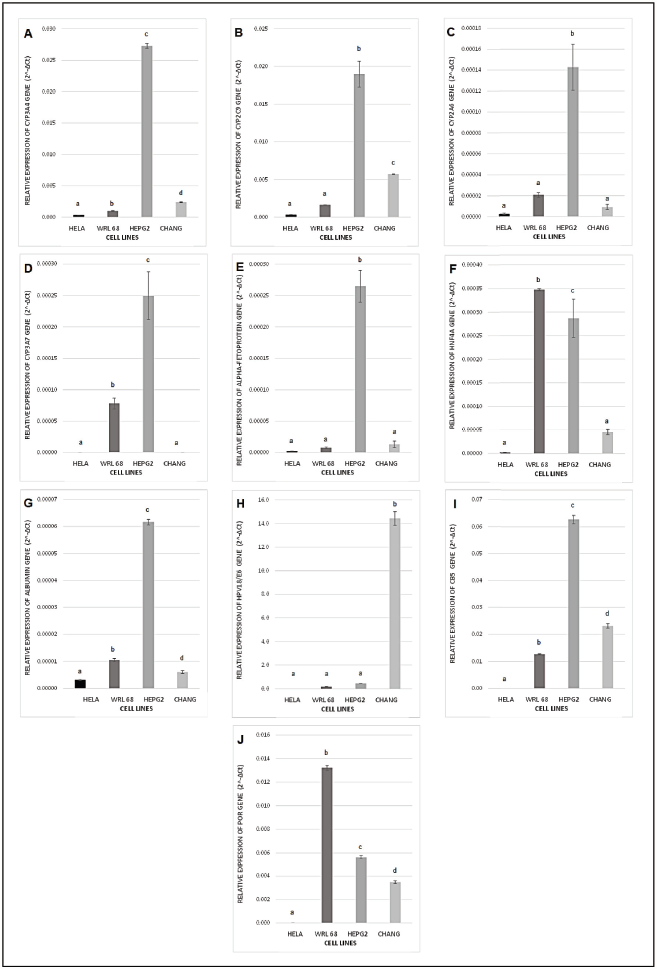 | Figure 1. (A) CYP3A4, (B) CYP2C9, (C) CYP2A6, (D) CYP3A7, (E) AFP, (F) HNF4A, (G) ALB, (H) HPV18/E6, (I) CB5, and (J) POR gene expression levels in HeLa, WRL-68, HepG2, and Chang cell lines, normalized to housekeeping genes (GAPDH and β-actin) and expressed as 2−ΔCT values. Bars represent the mean values (± SEM) of 2−ΔCT with different letters denoting significant difference (p < 0.05, ANOVA post hoc Tukey). [Click here to view] |
 | Figure 2. WRL-68 cells untransfected and transfected with control vector and transfected with PCMV–CYP3A4–GFP cDNA at different time points (24, 48, and 72 hours) after transfection. Expression of GFP allowed visualization of transfection efficiency following different incubation periods. Scale bar: 500 µm, magnification 40×, grayscale. [Click here to view] |
 | Figure 3. Morphology of cells (B) transfected with control vector and (C) transfected with PCMV–CYP3A4–GFP 48 hours after transfection is not different from (A) untransfected WRL-68. 40× magnification, greyscale. [Click here to view] |
WRL-68–CYP3A4 model was optimized for 6β-hydroxylation activity as well as inhibition by fluconazole. A well-characterized CYP3A4 selective substrate is required to probe the activity of CYP3A4 and testosterone hydroxylation, including 6β-hydroxylation which is one of the most commonly used metabolism assays for the assessment of CYP3A4 activity in human and other species (Usmani and Tang, 2004). While testosterone is used in this study to evaluate specific binding of substrate to the active site of the exogenous CYP3A4, fluconazole was selected to demonstrate binding of the inhibitor to the allosteric site of the enzyme. Fluconazole is a moderate inhibitor of CYP3A4 and has been proven to inhibit the enzyme noncompetitively in vitro as well as clinically (Yang et al., 2012).
Quantification of metabolite after 150 minutes incubation with various optimized concentrations of substrate and inhibitor was performed using UHPLC-UV at maximum absorption of 242 nm (tR 6β-hydroxytestosterone = 24.8 minutes) and the chromatograms illustrated in Figure 6. Lineweaver–Burk plot was used as a tool to evaluate the maximum velocity (Vmax) of 6β-hydroxylation, Km of testosterone, IC50, inhibition constant (Ki), and mode of inhibition for fluconazole in WRL-68–CYP3A4 system and the results summarized in Table 1. Km of testosterone (20.6 µM) is comparable to previously reported values in reconstituted enzyme system and HLMs 6β-hydroxylation activity which are 29.3 µM and 23.2 µM, respectively (Taguchi et al., 2001). In noncompetitive inhibition, an increase in the y-intercept is seen before and after inhibition. The x-intercept remains unchanged, as the apparent substrate affinity to the enzyme (Km) is unchanged. The changes in Vmax, constant Km, and their graphical illustration on the Lineweaver–Burk plot are the primary way to recognize noncompetitive inhibition.
 | Figure 4. (A) Real-time RT-PCR and (B) Western blot analyses for endogenous and exogenous CYP3A4 expression after different posttransfection periods (24, 48, and 72 hours). Consistent with the mRNA changes, transfection is time-dependently an upregulated exogenous CYP3A4 protein expression and is at optimum after 48 hours. β-actin was used as an internal control. Bars with different letters denote significant difference (p < 0.05, ANOVA and Tukey’s post hoc Tukey). [Click here to view] |
 | Figure 5. (A) Real-time RT-PCR and (B) Western blot analyses for endogenous cytochrome NADPH POR) and CB5 after 48 hours after transfection. U: untransfected, C: transfected with control vector, O: CYP3A4. β-actin was used as an internal control. [Click here to view] |
 | Figure 6. UV-HPLC chromatogram of testosterone 6β-hydroxylation by WRL-68-CYP3A4 model, monitoring at A242. (A) Testosterone standard shown at tR = 27.1 minute, (B) 6β-hydroxytestosterone standard shown at tR = 24.8 minute, (C) control incubation medium spiked with testosterone and 6β-hydroxytestosterone standards, and (D) product 6β-hydroxytestosterone after 150 minutes incubation with testosterone (200 µM). [Click here to view] |
 | Figure 7. (A) Lineweaver–Burk plots of inhibition of CYP3A4-catalyzed testosterone 6β-hydroxylase by fluconazole and (B) the secondary plot using the slopes of the primary Lineweaver–Burk plot versus the concentrations of fluconazole. [Click here to view] |
 | Table 1. Maximum velocity (Vmax) of 6β-hydroxylation, Km of testosterone, IC50, inhibition constant (Ki), and mode of inhibition for fluconazole on overexpressed CYP3A4. [Click here to view] |
This pattern is observed as shown in Figure 7 proving that the fluconazole mode of inhibition in this system is noncompetitive. The secondary plot constructed from the slopes of the primary plots against inhibitor concentration provides information on the inhibitor constant (Ki). For a noncompetitive inhibitor, Ki value is similar to that of IC50 of the inhibitor (Cer et al., 2009). In this study, Ki and IC50 values of fluconazole are 438.82 ± 16.64 µM and 476.92 ± 9.01 µM, respectively, which is considerably alike.
Cell culture model such as WRL-68–CYP3A4 can never completely replace animal models in drug studies. However, the WRL-68–CYP3A4 model can reduce the use of animals in the early stages of drug candidate screening for exclusion criteria. This approach will also reduce the burden of cost in conducting many in vivo studies for CYP3A4 inhibition screening purpose.
CONCLUSION
Despite having low basal CYP3A4 activity, WRL-68 is an efficient host harboring abundant functional redox partners suitable for overexpression of CYP450 enzymes in the development of a reliable tool for in vitro metabolism-based study. The established WRL-68–CYP3A4 model with overexpression of CYP3A4 protein is suitable for the in vitro evaluation of inhibition of that specific enzyme by various compounds or drugs. Inhibition assays using commercial purified CYP3A4 have the best specificity; however, it is costly and does not resemble in vivo cell physiological characteristics. WRL-68–CYP3A4 model provides a cost-effective and easy handling tool in studying in vitro CYP3A4 inhibition as DDI screening.
CONFLICT OF INTEREST
The authors report no financial or any other conflicts of interest in this work.
FUNDING
The authors acknowledge RMC UiTM, grant no. 600-IRMI/FRGS 5/3/ (065/2019) and Journal Support Fund, UiTM for funding this research.
AUTHOR CONTRIBUTIONS
All authors made substantial contributions to conception and design, acquisition of data, or analysis and interpretation of data; took part in drafting the article or revising it critically for important intellectual content; agreed to submit to the current journal; gave final approval of the version to be published; and agree to be accountable for all aspects of the work. All the authors are eligible to be an author as per the international committee of medical journal editors (ICMJE) requirements/guidelines.
ETHICAL APPROVAL
Not applicable.
PUBLISHER’S NOTE
This journal remains neutral with regard to jurisdictional claims in published institutional affiliation.
REFERENCES
Agbabiaka TB, Spencer NH, Khanom S, Goodman, C. Prevalence of drug-herb and drug-supplement interactions in older adults: a cross-sectional survey. Br J Gen Pract, 2018; 68(675):e711–7. CrossRef
Asha S, Vidyavathi M. Role of human liver microsomes in In vitro metabolism of drugs-a review. Appl Biochem Biotechnol, 2009; 160(6):1699–722. CrossRef
Barnaba C, Gentry K, Sumangala N, Ramamoorthy A. The catalytic function of cytochrome P450 is entwined with its membrane-boundnature. F1000Res, 2017; 6:662. CrossRef
Bhatt MR, Khatri Y, Rodgers RJ, Martin LL. Role of cytochrome b5 in the modulation of the enzymatic activities of cytochrome P450 17α-hydroxylase/17,20-lyase (P450 17A1). J Steroid Biochem Mol Biol, 2017; 170: 2–18. CrossRef
Bulutoglu B, Rey-Bedón C, Mert S, Tian L, Jang YY, Yarmush ML, Usta OB. A comparison of hepato-cellular in vitro platforms to study CYP3A4 induction. PLoS One, 2020; 15(2):e0229106. CrossRef
Casabar RCT, Das PC, Dekrey GK, Gardiner CS, Cao Y, Rose RL, Wallace AD. Endosulfan induces CYP2B6 and CYP3A4 by activating the pregnane X receptor. Toxicol Appl Pharmacol, 2010; 245(3):335–43. CrossRef
Castell JV, Jover R, Martnez-Jimnez CP, Gmez-Lechn MJ. Hepatocyte cell lines: their use, scope and limitations in drug metabolism studies. Expert Opin Drug Metab Toxicol, 2006; 2(2):183–212. CrossRef
Cer RZ, Mudunuri U, Stephens R, Lebeda FJ. IC50-to-Ki: a web-based tool for converting IC50 to Ki values for inhibitors of enzyme activity and ligand binding. Nucleic Acids Res, 2009; 37:W441–5; doi:10.1093/nar/gkp253 CrossRef
Chen KY, Lin JA, Yao HY, Hsu AC, Tai YT, Chen JT, Chen YP. Arctigenin protects against steatosis in WRL68 hepatocytes through activation of phosphoinositide 3-kinase/protein kinase B and AMP-activated protein kinase pathways. Nutr Res, 2018; 52:87–97. CrossRef
Cízková D, Morký J, Micuda S, Osterreicher J, Martínková J. Expression of MRP2 and MDR1 transporters and other hepatic markers in rat and human liver and in WRL 68 cell line. Physiol Res, 2005; 54(4):419–28. CrossRef
Corrie K, Hardman JG. Mechanisms of drug interactions: pharmacodynamics and pharmacokinetics. Anaesth Intensive Care Med, 2011; 12(4):156–9. CrossRef
Costa A, Sarmento B, Seabra V. An evaluation of the latestin vitrotools for drug metabolism studies. Expert Opin Drug Metab Toxicol, 2013; 10(1):103–19. CrossRef
Donato MT, Tolosa L, Gómez-Lechón MJ. Culture and functional characterization of human hepatoma HepG2 cells. Methods Mol Biol, 2014; 1250:77–93; doi:10.1007/978-1-4939-2074-7_5 CrossRef
Eap C, Buclin T, Hustert E, Bleiber G, Golay K, Aubert AC, Baumann P, Talenti A, Kerb R. Pharmacokinetics of midazolam in CYP3A4- and CYP3A5-genotyped subjects. Eur J Clin Pharmacol, 2004; 60(4):231–6. CrossRef
Feckler A, Schrimpf A, Bundschuh M, Bärlocher F, Baudy P, Cornut J, Schulz R. Quantitative real-time PCR as a promising tool for the detection and quantification of leaf-associated fungal species - a proof-of-concept using alatospora pulchella. PloS One, 2017; 12(4). CrossRef
Gao Q, Wang XY, Zhou J, Fan J. Cell line misidentification: the case of the chang liver cell line. Hepatology, 2011; 54(5):1894–5. CrossRef
Gerets HH, Tilmant K, Gerin B, Chanteux H, Depelchin BO, Dhalluin S, Atienzar FA. Characterization of primary human hepatocytes, HepG2 cells, and HepaRG cells at the mRNA level and CYP activity in response to inducers and their predictivity for the detection of human hepatotoxins. Cell Biol Toxicol, 2012; 28(2):69–87. CrossRef
Gonzalez FJ. Regulation of hepatocyte nuclear factor 4α-mediated transcription. Drug Metab Pharmacokinet, 2008; 23(1):2–7. CrossRef
Goodwin EC, Yang E, Lee CJ, Lee HW, Dimaio D, Hwang ES. Rapid induction of senescence in human cervical carcinoma cells. Proc Natl Acad Sci, 2000; 97(20):10978–83; doi:10.1073/pnas.97.20.10978 CrossRef
Grinkova YV, Denisov IG, McLean MA, Sligar SG. Oxidase uncoupling in heme monooxygenases: human cytochrome P450 CYP3A4 in nanodiscs. Biochem Biophys Res Commun, 2013; 430(4):1223–7. CrossRef
Gutiérrez-Ruiz MC, Bucio L, Souza V, Gómez JJ, Campos C, Cárabez A. Expression of some hepatocyte-like functional properties of WRL-68 cells in culture. In Vitro Cell Dev Biol, 1994; 30(6):366–71. CrossRef
Hijazi Y, Boulieu R. Contribution of CYP3A4, CYP2B6, and CYP2C9 Isoforms toN-demethylation of ketamine in human liver microsomes. Drug Metab Dispos, 2002; 30(7):853–8; doi:10.1124/dmd.30.7.853 CrossRef
Kodidela S, Kumar SS, Uppugunduri CR. Developmental pattern of hepatic drug-metabolizing enzymes in pediatric population and its role in optimal drug treatment. Arch Med Health Sci, 2017; 5:115–22.
LeCluyse EL, Alexandre E, Hamilton GA, Viollon-Abadie C, Coon DJ, Jolley S, Richert L. Isolation and culture of primary human hepatocytes. Basic Cell Cult Protoc, 2005; 207–30. CrossRef
Longo PA, Kavran JM, Kim MS, Leahy DJ. Transient mammalian cell transfection with polyethylenimine (PEI). Lab Methods Enzymol, 2013; 529:227–40. CrossRef
Lu Y, Figler B, Huang H, Tu YC, Wang J, Cheng F. Characterization of the mechanism of drug-drug interactions from PubMed using MeSH terms. PloS One, 2017; 12(4):e0173548. CrossRef
Manikandan P, Nagini S. Cytochrome P450 structure, function and clinical significance: a review. Curr Drug Targets, 2018; 19(1):38–54. CrossRef
Martignoni M, Groothuis GMM, de Kanter R. Species differences between mouse, rat, dog, monkey and human CYP-mediated drug metabolism, inhibition and induction. Expert Opin Drug Metab Toxicol, 2006; 2(6):875–94. CrossRef
Murugavel KG, Mathews S, Jayanthi V, Shankar EM, Hari R, Surendran R, Thyagarajan SP. Alpha-fetoprotein as a tumor marker in hepatocellular carcinoma: investigations in south Indian subjects with hepatotropic virus and aflatoxin etiologies. Int J Infect Dis, 2008; 12;71–6. CrossRef
Nowakowski A, Andrzejewska A, Boltze J. Translation, but not transfection limits clinically relevant, exogenous mRNA based induction of alpha-4 integrin expression on human mesenchymal stem cells. Sci Rep, 2017; 7:1103. CrossRef
Pang XY, Cheng J, Kim JH, Matsubara T, Krausz KW, Gonzalez FJ. Expression and regulation of human fetal-specific CYP3A7 in mice. Endocrinology, 2012; 153(3):1453–63; doi.org/10.1210/en.2011-1020 CrossRef
Pearl NM, Wilcoxen J, Im S, Kunz R, Darty J, Britt RD, Waskell L. Protonation of the hydroperoxo intermediate of cytochrome P450 2B4 is slower in the presence of cytochrome P450 reductase than in the presence of cytochrome b5. Biochemistry, 2016; 55(47):6558–67; doi:10.1021/acs.biochem.6b00996 CrossRef
Porter TD. New insights into the role of cytochrome P450 reductase (POR) in microsomal redox biology. Acta Pharm Sin B, 2012; 2(2):102–6. CrossRef
Porter TD. The roles of cytochromeb5 in cytochrome P450 reactions. J Biochem Mol Toxicol, 2002; 16(6):311–6. CrossRef
Purdon MP, Lehman-McKeeman LD. Improved high-performance liquid chromatographic procedure for the separation and quantification of hydroxytestosterone metabolites. J Pharmacol Toxicol Methods, 1997; 37(2):67–73. CrossRef
Samhan-Arias AK, Almeida RM, Ramos S, Cordas CM, Moura I, Gutierrez-Merino C, Moura JJG. Topography of human cytochrome b 5 /cytochrome b 5 reductase interacting domain and redox alterations upon complex formation. Biochim Biophys Acta Bioenerg, 2018; 1859(2):78–87. CrossRef
Steinbrecht S, Kammerer S, Küpper JH. HepG2 cells with recombinant cytochrome P450 enzyme overexpression: their use and limitation as in vitro liver model. J Cell Biotechnology, 2019; 5(1):55–64; doi:10.3233/jcb-189013 CrossRef
Taguchi M, Imaoka S, Yoshii K, Kobayashi, Katsuji, Hosokawa M, Shimada N, Funae Y, Chiba K. Kinetics of testosterone 6β-hydroxylation in the reconstituted system with similar ratios of purified CYP3A4, NADPH-cytochrome P450 oxidoreductase and cytochrome b5 to human liver microsomes. Res Commun Mol Pathol Pharmacol, 2001; 109:53–63.
Tomasi TB. Structure and function of alpha-fetoprotein. Annu Rev Med, 1977; 28(1):453–65; doi:10.1146/annurev.me.28.020177.002321 CrossRef
Turpeinen M, Tolonen A, Chesne C, Guillouzo A, Uusitalo J, Pelkonen O. Functional expression, inhibition and induction of CYP enzymes in HepaRG cells. Toxicol in vitro, 2009; 23(4):748–53. CrossRef
Usmani KA, Tang J. Human cytochrome P450: metabolism of testosterone by CYP3A4 and inhibition by ketoconazole. Curr Protoc Toxicol, 2004; Chapter 4:4.13.1–9. CrossRef
Wang X, Wang Q. Alpha-fetoprotein and hepatocellular carcinoma immunity. Can J Gastroenterol Hepatol, 2018; 2018:1–8; doi:10.1155/2018/9049252 CrossRef
Westerink WM, Schoonen WG. Cytochrome P450 enzyme levels in HepG2 cells and cryopreserved primary human hepatocytes and their induction in HepG2 cells. Toxicol in vitro, 2011; 21(8):1581–91; doi:10.1016/j.tiv.2007.05.014 CrossRef
WiÅ›niewski JR, Vildhede A, Norén A, Artursson P. In-depth quantitative analysis and comparison of the human hepatocyte and hepatoma cell line HepG2 proteomes. J Proteomics, 2016; 136:234–47; doi:10.1016/j.jprot.2016.01.016 CrossRef
Wong YH, Abdul Kadir H. Leea indica ethyl acetate fraction induces growth-inhibitory effect in various cancer cell lines and apoptosis in Ca Ski human cervical epidermoid carcinoma cells. Evid Based Complement Alternat Med, 2011; 2011:1–13; doi:10.1155/2011/293060 CrossRef
Yang J, Atkins WM, Isoherranen N, Paine MF, Thummel KE. Evidence of CYP3A allosterism in vivo: analysis of interaction between fluconazole and midazolam. Clin Pharmacol Ther, 2012; 91(3):442–49. CrossRef
GRAPHICAL ABSTRACT
 | [Click here to view] |