
INTRODUCTION
Terbinafine HCl (TFH) is a derivative of organic allylamine (Bhadoriya et al., 2019; Nussbaumer et al., 1995). It is an antifungal agent that works by inhibiting squalene epoxidase which inhibits ergosterol biosynthesis, which leads to the death of fungal cells (Kanakapura and Penmatsa, 2016; Moraes et al., 2017). Chemically, it is [(2E)-6-6-dimethyl hept 2-en-4-yn-1-yl] (methyl) (naphthalene-1-yl methyl) amine HCl (Fig. 1) with a MW of 327.9 g/ml (Mrutyunjayarao et al., 2012). TFH is freely soluble in methylene chloride and methanol, whereas it is soluble in ethanol and moderately soluble in water. It has a 204°C–208°C melting point. TFH tablets are used to treat fungal infections that damage fingernails and toenails, medically referred to as onychomycosis or Tinea unguium, which is likely caused by Trichophyton, Microsporum canis, and Epidermophyton floccosum. It works by stopping the growth of fungus (Matysova et al., 2016; Talaviya and Smita, 2016). Nail fungal infection often triggers an infectious or poor hygiene-related disease. In fact, in Western countries up to 10% of all adults have fungal nail infections. This figure rises to 20% of people 60 years of age or older. Much more common is toenail fungus than fingernail fungus. The FDA-labeled Terbinafine dosage is 250 mg per day which is to be continuously given to treat toenail infections for 12 weeks and for 6 weeks to treat fingernail infections (Amichai et al., 2010; Arunprasad et al., 2010). Studies have shown that toenail treatment results in a mycological cure rate of 71%–82% and a surgical cure rate of 60-70% (Darkes et al., 2003).
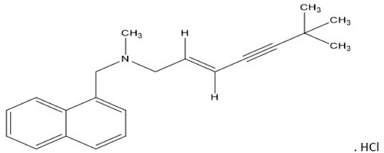 | Figure 1. Terbinafine hydrochloride. [Click here to view] |
The literature survey disclosed some of the HPLC methods for the estimation of TFH in which the C18 column, acetonitrile, and methanol (60:40) mobile phase with PDA detector set at 224 nm was used (Kassem and Almardini, 2013). In another Rp-C18, methanol–water (95:5) mobile phase with UV detection at 254 nm was reported (Tagliari et al., 2010). ODS column using a mixture of phosphate buffer and acetonitrile (60:40) with UV detection at 283 nm was described (Rani et al., 2006). Ion pair reverse-phase liquid phase chromatography was also carried out using sodium-1-heptanesulphonate as the ion-pairing reagent (Florea et al., 2009). However, most of the HPLC methods reported involve organic solvents, C18 column with UV detector, but HPLC with other detectors like fluorescence, MS, and electrochemistry are not yet reported (Kanakapura and Penmatsa, 2016). Titrimetric method had been reported in which TFH was estimated using anhydrous acetic acid titrated against perchloric acid with crystal violet indicator (Cardoso and Schapoval, 1999; BP 2012; EP 2011; USP 2012). Several other techniques like UV spectrophotometric method were reported for the assay of TFH in raw materials, tablets, and creams. Using visible spectrophotometry, TFH was found to be measured at 422 nm after forming an ion pair complex with methyl orange (1:1) by using pH 2.6 buffer (Elazazy et al., 2008); spectrofluorimetry has been reported based on native fluorescence of TFH in the water at 376 nm (Belal et al., 2013); an electrochemical method, such as capillary electrophoresis method, has also been reported for the determination of TFH in pharmaceutical preparation resulted with an RE of 0.64% for commercial tablets (Mikus et al., 2005). TFH was determined by the bioanalytical method using GC in cat hair, but all the parameters were not validated according to USFDA guidelines and degradation studies were also not carried out (Kuzner et al., 2001). Thus, gas chromatography has an advantage over the reported analytical techniques as minimal quantity of organic solvent and nature friendly gas as mobile phase are being used.
Gas chromatography is a unique and versatile technique which is used to separate and analyze compounds in analytical chemistry that can be vaporized without decomposition. Helium or nitrogen is commonly used as a mobile phase in GC. The typical use of GC involves measuring a particular substance’s purity and separating the various components of a mixture using green solvents and easy operation maintenance. Currently, there is no analytical method using gas chromatography reported till now for the estimation of TFH in pharmaceutical formulations. The drug had become volatile at its melting point and was detected using flame ionization detector (FID) and hence does not require any derivatizing reagent for analysis of TFH. This research work is directed toward the development of the GC method for the estimation of TFH in tablet dosage form, followed by degradation studies according to the ICH guidelines.
MATERIALS AND METHODS/EXPERIMENTAL
Materials and reagents
Terbinafine pure drug (API) was procured from RL Fines Chemicals, Bengaluru, India. HPLC analytical grade methanol was procured from specialties private limited, Mumbai, India. The formulation (TFH tablet) was purchased from a local pharmacy shop.
GC (analytical) instrumentation and chromatographic conditions
GC Shimadzu 2014 prototype with FID-operated GC solution software was used for the method development. A 10 μl syringe specimen applicator (Hamilton CO., Reno Nevada, USA) has been used. The product column of Zebron DB (length: 30 m, diameter: 0.25 mm, and film: 0.50 μm) with a −40°C–320°C (Max. 340°C) temperature range was used. The chromatographic conditions used to develop the method are shown in Table 1.
Preparation of TFH standard solutions
The stock solution of 100 μg/ml TFH was prepared using methanol as a diluent. In 100 ml volumetric flask, 10 mg of Terbinafine was weighed, transferred, and made up the volume using methanol to get 100 μg/ml concentration. From the prepared stock solution, 1, 2, 3, 4, 5, and 6 ml was pipetted out to six different 10 ml volumetric flasks and the volume was made up using methanol to get 10, 20, 30, 40, 50, and 60 μg/ml and were sonicated for 5 minutes to remove the entrapped air.
Preparation of sample solution
Ten tablets of TFH were weighed and powdered. The powdered formulation equivalent to 100 mg of Terbinafine was taken and transferred to a 100 ml volumetric flask and made up to the mark using methanol as a diluent (1,000 μg/ml). A stock solution was prepared by taking 10 ml which was pipetted into a 100 ml volumetric flask and made up with methanol to get 100 μg/ml concentration.
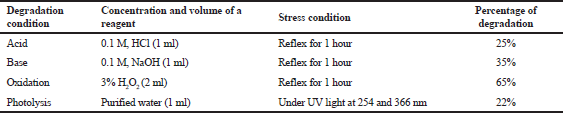
Force degradation studies
Force degradation studies was carried out by treating the drug samples of same concentrations (40 μg/ml) to various stress conditions like acidic (0.1 M hydrochloric acid for 30 minutes at 60°C and later neutralized with the same amount of base), basic (0.1 M sodium hydroxide for 30 minutes at 60° and neutralized using the same amount of acid), oxidation (treating the sample solution with 3% 2 ml of H2O2) and photolysis (keeping the sample in a UV chamber for 1 hours).
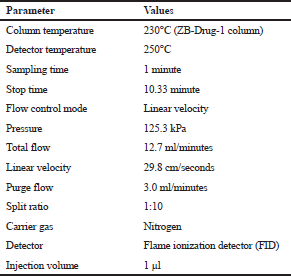 | Table 1. Chromatographic conditions. [Click here to view] |
RESULTS AND DISCUSSION
Method development
This study aimed to develop a simple, robust, and derivatization-free analytical technique to evaluate the TFH in tablet dosage forms in the presence of its degradation materials that is cost-effective. The developed GC-FID method could support the proposed results. The quality of the method was proved by satisfactory validation results within a good manufacturing environment (GMP) as per the ICH guidelines and the method was in accordance with the pharmacopoeial requirements. Various method development parameters were optimized during the initial screening of the technique.
Sample solvent selection
The sample solvent selection was based on the solubility of the drug in the chosen diluent. Initial trials were conducted in ethanol, but the drug was not effectively soluble in ethanol. Furthermore, the polarity of the diluent was reduced by using methanol as the diluent. Good peak shape was obtained using methanol for the sample preparation.
Selection of sample concentration
Experimental trials were conducted using 1 μg/ml. This injection showed a very low peak intensity. The sample concentration of 10 μg/ml could demonstrate effective results, thus being the initial concentration for the linearity curve. The sample with a concentration of 100 μg/ml showed good response, whereas 200 μg/ml resulted in carryover.
Column selection
The polarity of the column affects the peak shape and resolution. So, for effective separation, the column polarity should match the polarity of the chosen drug selected for the analysis. The different trials were conducted using nonpolar columns, i.e., the polydimethylsiloxane (OV-1), ZB drug-1 column and Zebron DB column. In the effective separation, without tailing in the chromatogram, the drug column did not provide a clear separation of TFH, whereas Zebron DB column was found to serve the purpose.
Temperature programming
TFH has a melting point of 204°C–208°C and the drug produced a peak without initial derivatization. The preliminary study was carried out by raising the temperature from 230°C to 240°C with a ramp rate of 5°C/minutes and retained for 2 minutes. Then, subsequently, the column temperature was raised to 250°C with a ramp rate of 3°C/minutes and retained the same temperature for 3 minute. The drug was eluted at 8.5 minutes and attained a total run time of 10.33 minutes.
Method validation
System suitability
After the method’s conditions were established as described, the method was validated as per the ICH guidelines for accuracy, precision, linearity, limit of detection, and limit of quantitation. The precision of the method was established by injecting 10 μg, 30 μg, and 60 μg concentrations six times intraday and inter-day. Accuracy, in terms of percentage recovery was established by spiking the formulation at 50%, 100%, and 150% (n = 3). Linearity was established by injecting a series of dilutions in increasing concentrations (n = 5). LOD and LOQ were established using the standard deviation and slope.
Based on the comparison of retention time of standard with formulation, the selectivity of the method has been evaluated, and quantitative analysis of TFH was carried out under the established conditions. The results of the system’s suitability are shown in Table 2.
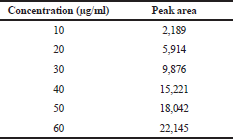
Linearity
Linearity is the ability to view “reports directly proportional to the sample analyte concentration.” For the analysis of the analyte’s concentration within a given range, linearity is significant for confirming the sensitivity of the system. Linearity was established by preparing a series of dilutions ranging from 10 to 60 μg/ml and each dilution was injected into the GC. The mean peak areas of each dilution were recorded and the calibration curve was constructed by plotting concentration on the x-axis and peak area on y-axis (Fig. 2). The linear regression equation for TFH is as follows: y = 407.27x – 2,671.5 (R² = 0.9805). The results of the linearity curve are shown in Table 3. Figures 3 and 4 show the blank and TFH overlay chromatograms, respectively.
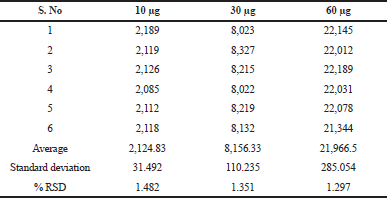
Precision
The precision of a measurement system, related to reproducibility and repeatability, is the degree to which repeated measurements under unchanged conditions show the same results. Precision was established by injecting 10, 30 and 60 μg concentrations six times into the GC on the intra-day and inter-day and %RSD was calculated. The results of the precision are shown in Tables 4 and 5, which are found to be highly precise and within the limits according to the ICH guidelines.
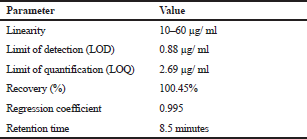 | Table 2. GC validation report for determination of TFH. [Click here to view] |
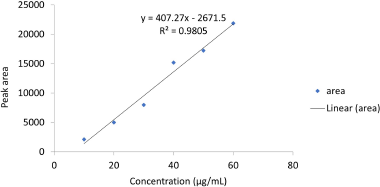 | Figure 2. Linearity curve for terbinafine HCl. [Click here to view] |
Accuracy
Accuracy indicates the closeness of the measured value to the true value. Accuracy was determined in terms of percentage recovery, which involves spiking of a known portion of stock solution to test samples and determining percentage recovery at three different concentration levels. The recovery study was carried out by preparing the standard drug solution and formulation solution at three different levels of concentrations, i.e., 50%, 100%, and 150% and then percentage recovery was calculated and found to be an accurate method (Table 6).
LOD and LOQ
LOD is the lowest concentration of an analyte that can be reliably detected but not generally quantified. The signal to noise ratio should be at least 3:1 for the limit of detection.
 | Table 3. Linearity of TFH. [Click here to view] |
LOQ is the lowest quantity of an analyte that can be quantitatively determined under the specified experimental conditions, with defined precision. The signal to noise ratio should be at least 10:1 for the limit of quantitation.
The equation for LOD and LOQ used is as follows: LOD = 3.3 μ/s and LOQ = 10 σ /s, where σ is the standard deviation and s is a slope. The results of the LOD and LOQ were found to be 0.88 μg/ml and 2.69 μg/ml for TFH, respectively.
Robustness
Robustness is the measure of an analytical process wherein the results obtained are found to be reliable or within the method’s specified tolerance limits, even after making deliberate changes. Robustness was carried out by slightly changing the parameters like split ratio, column flow, split ratio, and column temperature. The statistical data given in Table 7 show no significant changes in the given parameters and thus represents that the method is robust. The results of robustness are shown in Table 7.
 | Table 4. Intra-day precision of TFH. [Click here to view] |
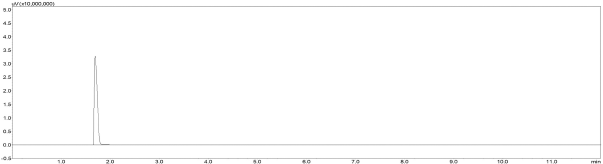 | Figure 3. Chromatograms for blank (Methanol). [Click here to view] |
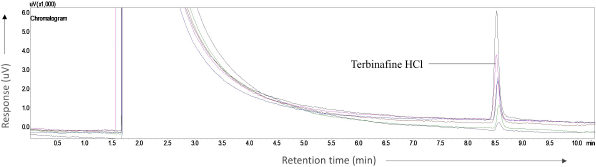 | Figure 4. Overlay chromatogram for terbinafine HCl. [Click here to view] |
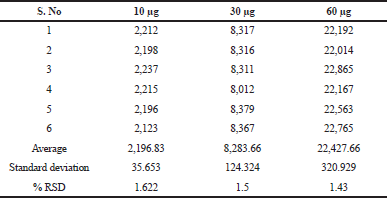 | Table 5. Inter-day precision of TFH. [Click here to view] |
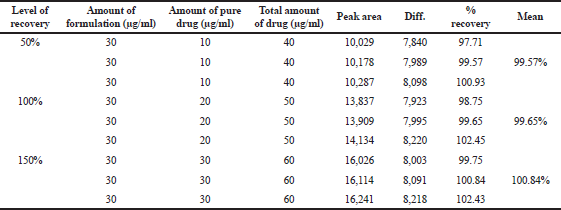 | Table 6. Accuracy of TFH. [Click here to view] |
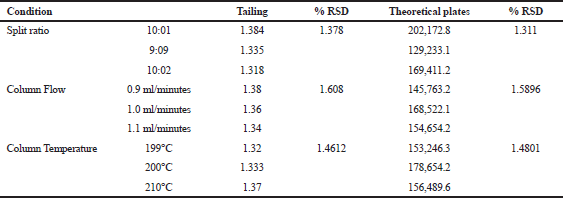 | Table 7. Robustness result for TFH. [Click here to view] |
 | Table 8. Recovery studies results for terbinafine hydrochloride after the stress conditions (% recovery of drug). [Click here to view] |
Forced degradation studies
Forced degradation studies were conducted using the GC method. The procedure and results obtained are described briefly in Table 8. The results showed that TFH has undergone more degradation, i.e., 65%, on oxidation with 2 ml of 3% hydrogen peroxide, as it showed a decline in the peak area in comparison to the standard drug peak area. However, 25% degradation occurred when reflexed with 1 ml of 0.1 M HCl for 1 hour , while 35% was degraded after reflexation with 1 ml of 0.1 M NaOH, whereas TFH exposure to UV light for 6 hours underwent lesser degradation (22%) compared to the other three stress conditions. Moreover, no additional peaks were found in any of the four stress conditions (Fig. 5).
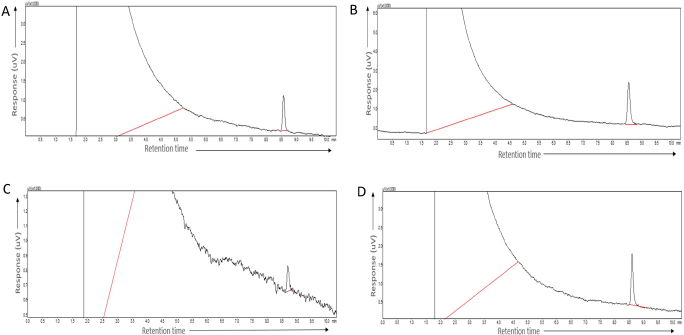 | Figure 5. Force degradation chromatograms of terbinafine HCl (A) Acid stress; (B) Basic stress; (c) Peroxide stress; (D) Photolytic stress. [Click here to view] |
CONCLUSION
For estimating TFH in tablet dosage form validated in compliance with ICH guidelines, the proposed green GC analytical method has been established. This method follows all validation requirements such as reliability, accuracy, device suitability and precision, linearity, and robustness. The method simultaneously meets the study of forced degradation requirements. Therefore, the established method can be used in drug quality control laboratories for regular consistency assessment.
ACKNOWLEDGEMENT
The authors thank the JSS Academy of Higher Education and Research (JSSAHER), Mysuru, India, for providing all the facilities required for the successful completion of research work.
AUTHOR CONTRIBUTIONS
All authors made substantial contributions to conception and design, acquisition of data, or analysis and interpretation of data; took part in drafting the article or revising it critically for important intellectual content; agreed to submit to the current journal; gave final approval of the version to be published; and agree to be accountable for all aspects of the work. All the authors are eligible to be an author as per the international committee of medical journal editors (ICMJE) requirements/guidelines.
FUNDING
There is no funding to report.
CONFLICTS OF INTEREST
The authors report no financial or any other conflicts of interest in this work.
ETHICAL APPROVALS
This study does not involve experiments on animals or human subjects.
PUBLISHER’S NOTE
This journal remains neutral with regard to jurisdictional claims in published institutional affiliation.
REFERENCES
Amichai B, Mosckovitz R, Trau H, Sholto O, Ben-Yaakov S, Royz M, Barak D, Nitzan B, Shemer A. Iontophoretic terbinafine HCl 1.0% delivery across porcine and human nails. Mycopathologia, 2010; 169:343–9. CrossRef
Arunprasad K, Narayanan N, Rajalakshmi G. Preparation and evaluation of solid dispersion of terbinafine hydrochloride. Int J Pharm Sci Rev Res, 2010; 3:130–4.
Belal F, El-Din MS, Eid MI, El-Gamal RM. Spectrofluorimetric determination of terbinafine hydrochloride and linezolid in their dosage forms and human plasma. J Fluoresc, 2013; 23:1077–87. CrossRef
Bhadoriya A, Shah PA, Shrivastav PS, Bharwad KD, Singhal P. Determination of terbinafine in human plasma using UPLC–MS/MS: application to a bioequivalence study in healthy subjects. Biomed Chromatogr, 2019; 33: e4543. CrossRef
British Pharmacopoeia. Her majesty’s. Stationery office Ltd, London, UK, 2012.
Cardoso SG, Schapoval EE. UV spectrophotometry and nonaqueous determination of terbinafine hydrochloride in dosage forms. J AOAC Int, 1999; 82:830–3. CrossRef
Darkes MJ, Scott LJ, Goa KL. Terbinafine. Am J Clin Dermatol, 2003; 4:39-65. CrossRef
Elazazy MS, El-Mammli M, Shalaby AB, Ayad MM. Application of certain ion-pairing reagents for extractive spectrophotometric determination of flunarizine hydrochloride, ramipril, and terbinafine hydrochloride. Biosci Biotechnol Res Asia, 2008; 5:107–14.
European Pharmacopoeia. EDQM. 7th edition. Council of Europe, Strasbourg, France, 2011.
Florea M, Arama CC, Monciu CM. Determination of terbinafine hydrochloride by ion-pair reversed phase liquid chromatography. Farmacia, 2009; 57:82–8.
Kanakapura B, Penmatsa VK. Analytical methods for determination of terbinafine hydrochloride in pharmaceuticals and biological materials. J Pharm Anal, 2016; 6:137–49. CrossRef
Kassem H, Almardini MA. High performance liquid chromatography method for the determination of Terbinafine hydrochloride in semi solids dosage form. Int J Pharm Sci Rev Res, 2013; 21:58–61.
Kuzner J, Kozuh Erzen N, Drobnic-Kosorok M. Determination of terbinafine hydrochloride in cat hair by two chromatographic methods. Biomed Chromatogr, 2001; 15:497–2. CrossRef
Matysová L, Solich P, Marek P, Havlikova L, Nováková L, Šícha J. Separation and determination of terbinafine and its four impurities of similar structure using simple RP-HPLC method. Talanta, 2006; 68:713–20. CrossRef
Mikus P, Valasková I, Havranek E. Determination of terbinafine in pharmaceuticals and dialyzates by capillary electrophoresis. Talanta, 2005; 65:1031–7. CrossRef
Moraes RC, Carvalho AR, Lana AJ, Kaiser S, Pippi B, Fuentefria AM, Ortega GG. In vitro synergism of a water insoluble fraction of Uncaria tomentosa combined with fluconazole and terbinafine against resistant non-Candida albicans isolates. Pharm Biol, 2017; 55:406–15. CrossRef
Mrutyunjayarao R, Naresh S, Pendem K, Rao PR, Sasttry CS, Prasad UV. Three simple spectrometric determination of terbinafine hydrochloride (TRB) in pure state and tablets. Proc Natl Acad Sci India A Phys Sci, 2012; 82:221–4. CrossRef
Nussbaumer P, Leitner I, Mraz K, Stuetz A. Synthesis and structure-activity relationships of side-chain-substituted analogs of the allylamine antimycotic terbinafine lacking the central amino function. J Med Chem, 1995; 38:1831-6. CrossRef
Rani BS, Reddy PV, Babu GS, Sankar GG, Rao S. Reverse phase HPLC determination of terbinafine hydrochloride in tablets. Asian J Chem, 2006; 18:3154–56.
Tagliari MP, Kuminek G, Borgmann SH, Bertol CD, Cardoso SG, Stulzer HK. Terbinafine: optimization of a LC method for quantitative analysis in pharmaceutical formulations and its application for a tablet dissolution test. Quim Nova, 2010; 33:1790–3. CrossRef
Talaviya, SM. Analytical method development and validation of antifungal agents. Hemchandracharya North Gujarat University, Patan, India, 2016. Available via http://hdl.handle.net/10603/211539
United States Pharmacopoeia. National formulary, 2012. USP Convention, Rockville MD.