
INTRODUCTION
The liver is the largest vital organ that protects the body from various metabolic diseases and toxic substances. Exposure to xenobiotics and therapeutic reagents results in liver inflammation, necrosis, cirrhosis, fibrosis, and functional weakening of the liver (Ashoush et al., 2013; Eidi et al., 2012; Sun and Karin, 2008). Liver cirrhosis is the 11th most common cause of death and liver cancer is the 16th major cause of death worldwide (Asrani et al., 2019). Therefore, there is a need to prevent hepatic fibrosis which is a basic pathological factor involved in cirrhosis and liver cancer (Jiao et al., 2009).
Increased oxidative stress in the liver is responsible for hepatic fibrosis. Management of oxidative stress is useful in protection against hepatic fibrosis (Nieto et al., 1999). Carbon tetrachloride (CCl4) is responsible for increasing oxidative stress in liver tissue and causes injury to the liver, and, therefore, is used as an animal model for evaluation of the effectiveness of drugs against liver fibrosis (Hernández-Muñoz et al., 1990; Neubauer et al., 1998; Poli, 2000; Reeves and Friedman, 2002). Probiotics have been considered to play an important role in the reduction in risk of diseases by restoring gut flora and improving liver enzymes, inhibition of harmful bacteria by alteration of the intestinal environment, synthesis of vitamins, and depleting cholesterol levels (Bang et al., 2014; Kirpich et al., 2008). Probiotics are also being considered as helpful adjuvant therapy in the treatment of liver disease caused due to different factors such as alcohol, viral infections, and disorders of metabolism (Cesaro et al., 2011; Loguercio et al., 2005; Rishi et al., 2009; Wang et al., 2011).
Prebiotics are nondigestible oligosaccharides that help to stimulate the growth of beneficial bacteria in gut flora. Among these, inulin, fructooligosaccharide (FOS), and lactulose are well-known prebiotics (Lu et al., 2018). Inulin is evaluated against CCl4-induced hepatotoxicity (Liu et al., 2015).
Synbiotics are a mixture of prebiotics and probiotics that help in the overall maintenance of beneficial gut flora along with better attachment and higher growth rate of the same. Synbiotics contribute to hepatic protection and better health management (Gibson and Roberfroid, 1995; Rishi et al., 2009).
The presented study was designed, conducted, and evaluated for the hepatoprotective activity of probiotic strains of lactic acid bacteria Lactococcus lactis subspecies cremoris and Pediococcus pentosaceus isolated from curd and fermented wheat, respectively, as well as some procured strains of lactic acid bacteria like Lactobacillus acidophilus and Lactobacillus plantarum and prebiotics such as inulin, FOS, lactulose alone, and their combination, that is, synbiotic.
This study attempted to make effective synbiotic formulation as hepatoprotective nutraceutical by combinations of different prebiotics with probiotic organisms in an optimum proportion.
MATERIALS AND METHODS
Chemicals
We used MRS (deMan, Rogosa, and Sharpe broth; HiMedia, India); inulin (HiMedia, India); FOS (HiMedia, India); lactulose (TIS, Japan); potassium phosphate; disodium phosphate; triton X-100; CCl4 (SRL, India); olive oil (SRL, India).
Microbial strains
The lactic acid bacteria Lactococcus lactis sp. cremoris (Ll) and Pediococcus pentosaceus (Pp) which were isolated from curd and fermented wheat, respectively, and isolated strains were identified at the Department of Microbiology, KEM Hospital, Pune, India.
The other two lactic acid bacteria used were Lactobacillus plantarum (Lp) National Centre for Industrial Microorganisms (NCIM) 2912, Lactobacillus acidophilus (La) NCIM 2285 which were procured from NCIM, National Chemical Laboratory, Pune, India.
Preparation of the microbial suspension
All the strains of lactic acid bacteria were grown in MRS broth (37°C, 18–24 hours). After incubation, cells were harvested by centrifugation (2,500 rpm, 15 minutes) with a serial wash of sterile saline and resuspended in 10 ml of sterile saline. The bacterial suspensions, for all the organisms, were freshly prepared.
Experimental animals
Adult Wistar rats (200–250 g) of both sexes were obtained from the National Toxicology Centre, Pune, in January 2016. Rats were randomized into different groups (n = 6) as follows. Animals were housed under standard environmental conditions of temperature 23 ± 2°C, relative humidity 55% ± 10%, and 12 hours of light and dark cycle. The animals had access to food and water ad libitum. This study protocol was approved by the Institutional Animal Ethical Committee through research project number RP10/1415 and conducted according to the guidelines of The Committee for the Purpose of Control and Supervision of Experiments on Animals (Ministry of Environment and Forests, Government of India).
Experimental design
Animals were divided into the following groups:
Group 1: normal control (NC).
Group 2: disease control (DC).
Group 3: Test 1 (1 × 10⁹ cfu/ml of Lactobacillus acidophilus).
Group 4: Test 2 (1 × 10⁹ cfu/ml of Lactobacillus plantarum).
Group 5: Test 3 (1 × 10⁹ cfu/ml of Lactococcus lactis subspecies cremoris).
Group 6: Test 4 (1 × 10⁹ cfu/ml of Pediococcus pentosaceus).
Group 7: Test 5 inulin (10 mg/ ml).
Group 8: Test 6 FOS (10 mg/ml).
Group 9: Test 7 lactulose (10 mg/ml).
Group 10: Test 8 synbiotic (1 × 10⁹ cfu/ml of Test 1 to Test 4; 10 mg/ml of Test 5–Test 7).
Group 11: standard 1, Silymarin (100 mg/kg).
Group 12: standard 2, Synbiotic 2000 (1 × 10⁹ cfu/ml).
In all treatments, microbial suspensions were orally fed for 28 days daily. On the 28th day, animals received a dose of CCl4 (1 ml/kg, i.p.) (Park et al., 2015). Animals were sacrificed after 24 hours of CCl4 injection.
Biochemical estimation from serum
Approximately 3 ml of blood samples were collected at the terminal sacrifice of animals (Parasuraman et al., 2010). The blood was allowed to clot at 37°C. The serum was separated by centrifugation at 2,500 Xg for 15 minutes. The serum was then subjected to measurement of serum glutamic pyruvic transaminase (SGPT), serum glutamic-oxaloacetic transaminase (SGOT), alkaline phosphatase (ALP), total bilirubin, total protein, lactate dehydrogenase, and urea using commercially available kits (Delta, India) provided by the manufacturer’s protocol.
Changes in organ weights
After sacrificing, animals were dissected and organs were collected. The liver, kidneys, and spleen were dissected and rinsed with ice-cold normal saline solution. The organs were weighed for their wet weights and stored in 10% formalin solution. The part of liver tissue was weighed and homogenized for evaluation of the oxidative markers. The relative organ weights were also recorded and calculated.
Biochemical estimation from tissues
Levels of catalase (CAT) and lipid peroxidation (LPO) were evaluated to determine the oxidative stress in various organs.
Preparation of tissue homogenate
Tissue samples were homogenized in 50 mM phosphate buffer (pH-7) in presence of 1% Triton X-100. The tissue homogenate prepared was 10% and used immediately for the evaluation of biochemical analysis.
Estimation of CAT
CAT levels were evaluated as described earlier (Aebi, 1984). Briefly, to the 2 ml of tissue homogenate, 1 ml of hydrogen peroxide was added to the homogenate. The change in absorbance of the resulting solution was measured at 240 nm for 30 seconds. The levels of CAT were calculated using the following formula:
Estimation of LPO
LPO was evaluated by the method described by earlier (Ohkawa et al., 1979). Briefly, to the 1 ml of tissue homogenate, 2 ml of trichloroacetic acid (TCA)-thiobarbituric acid-HCl reagent was added. Phosphate buffer served as blank instead of tissue homogenate. All tubes were then vortexed and kept in a water bath for 1 hour. Tubes were then allowed to cool down and centrifuged for 15 minutes. Supernatants were collected and absorbance was measured at 535 nm against the blank. LPO/gm of wet tissue was then calculated using the following formula:
nmoles of LPO / gm of tissue = Absorbance × 1.56 M−1cm−1
Estimation of reduced glutathione (GSH)
GSH levels were estimated as described by Ellman (Ellman, 1959; Moron et al., 1979). Briefly, the homogenate was prepared in TCA reagent. This homogenate was then centrifuged and the supernatant was collected. The supernatant was diluted with 2 ml of freshly prepared Ellman’s reagent (5′5 dithiobis[2nitrobenzoic acid] 10 mM, NaHCO3 15 mM) which was added. The absorbance of the resulting solution was measured at 412 nm. Standard GSH was run similarly. The standard calibration curve was plotted and the concentration of GSH from tissue was calculated based on the slope of the standard curve.
Estimation of total protein
Protein estimation was carried out by the earlier described method (Lowry et al., 1951). Tissue homogenates were centrifuged and the supernatant was collected. To these supernatants, 5 ml of an alkaline sodium carbonate solution was added. The resulting solution was then mixed with 0.5 ml of Folin’s reagent. The absorbance was recorded 30 minutes after the addition of Folin’s reagent at 680 nm. The concentration of protein was evaluated from the standard calibration curve obtained from different concentrations of bovine serum albumin (50–250 ¼g/ml).
Intestinal microflora identification by RTPCR
Microbial analysis was carried out using real-time polymerase chain reaction (RT-PCR). The intestine was collected in a sterile Petri plate containing 15 ml sterile normal saline and washed gently to remove the blood part and other possible contaminants. Again, the same organ was taken in another sterile Petri plate containing fresh 15 ml sterile saline and softly scrapped the upper layer with a sterile scalpel. The intestines of the same group were collected and washed with sterile saline as above and all the washed solution of the same group was pooled. This solution was collected in a sterile centrifuge tube and pellet down at 1,500 rpm for 10 minutes and stored at −20°C until further analysis. Compositional analysis of the intestinal microbiota was done by EzBioCloud’s Microbiome Taxonomic Profiling at Bioenergy group, at Agharkar Research Institute, Pune, India.
Histopathology
After completion of the dosing, schedule animals were sacrificed and dissected to harvest major organs such as the liver, kidneys, and intestine. The obtained tissues were fixed in formalin solutions and kept for fixing. After fixation, tissues were dehydrated and embedded in paraffin wax. The embedded tissues were then sectioned with a microtome (Ragavan and Krishnakumari, 2009). The sectioned tissues were stained by hematoxylin and eosin. The histological changes in tissues were then examined under a light microscope (Nikon). Liver tissues were observed for degeneration and necrosis of hepatocytes, infiltration of inflammatory cells, derangement of hepatic cords, and granular and vacuolar cytoplasmic changes. The case of intestine histopathological changes in mucosa and submucosa was observed along with necrotic and degenerative changes in enteric villi.
Statistical analysis
Results were expressed as mean ± SD. The data were analyzed by one-way followed by Tukey’s multiple comparisons or two-way analysis of variance (ANOVA) followed by Bonferroni post hoc tests. The results were considered as statistical significance at p < 0.05 in all the cases. The statistical test was performed by using GraphPad Prism 7.0.
RESULTS
Effect of treatments on change in body weight
Changes in body weight were recorded weekly. Two-way ANOVA revealed that the change in body weights was not significant on day 0 and day 7 of treatments. On day 14 onwards, there was a significant increase in body weight in group 4 (p < 0.01) and group 5 (p < 0.05) as compared to DC. A similar trend was observed on day 21 (group 4, p < 0.001; group 5, p < 0.001) and day 28 (group 4, p < 0.001; group 5, p < 0.01) of the experiment. Other groups showed increased body weight compared with the DC group (Fig. 1).
Effect of treatment on relative organ weight of liver, kidneys, and spleen
The relative organ weight of the liver, kidneys, and spleen was evaluated at the end of the study. Changes in relative organ weights were not statistically significant in comparison with DC animals and also with NC group animals (Fig. 2).
Effect of treatments on levels of SGPT
The levels of SGPT were estimated to determine the extent of liver damage after exposure of CCl4 administration in prebiotic, probiotic, and synbiotic pretreated rats. It was observed that the intraperitoneal injection of CCl4 leads to an increase in levels of SGPT significantly in DC (p < 0.001) in comparison with the NC group. Tukey’s multiple comparison test revealed that all test treatments have statistically significantly decreased SGPT levels as compared to DC (p < 0.001) (Table 1 and Fig. 3A).
Effect of treatments on levels of SGOT
One-way ANOVA revealed that there was a significant (p < 0.001) increase in SGOT levels after CCl4 administration in DC group animals as compared to the NC group, thereby confirming the induction of liver damage. SGOT levels in treatment groups, Test 1 (p < 0.001); Test 2 (p < 0.001); Test 3 (p < 0.05); Test 4 (p < 0.01); Test 5 (p < 0.001); Test 8 (p < 0.001); Silymarin (p < 0.001); Synbiotic 2000 (p < 0.01) were decreased significantly in comparison with DC animals (Table 1 and Fig. 3B).
 | Figure 1. Effect of treatments on change in body weight. [Click here to view] |
Effect of treatments on levels of ALP
The levels of ALP were found to be significantly elevated in the DC group in comparison with the NC group (p < 0.001), whereas the ALP levels were significantly decreased in all test groups in comparison with the DC group (p < 0.001) (Table 1 and Fig. 4A).
Effect of treatments on levels of total bilirubin
Total bilirubin levels were increased significantly (p < 0.001) in CCl4-injected groups as compared to the NC group. The bilirubin levels were decreased in all test groups in comparison with DC group (Test 1, p < 0.01; Test 2, p < 0.001; Test 3, p < 0.01; Test 4, p < 0.01; Test 5, p < 0.001; Test 6, p < 0.01; Test 7, p < 0.01; Test 8, p < 0.001; silymarin, p < 0.001, and Synbiotic 2000, p < 0.001) (Table 1 and Fig. 4B).
Effect of treatments on levels of serum and liver total protein
Total protein levels were significantly decreased in the DC group in comparison with the NC group (p < 0.001), whereas in all test groups, the total protein content was significantly increased when compared with the DC group (p < 0.001) (Table 1 and Fig. 5A and B).
 | Figure 2. Effect of treatment on relative organ weight of liver, kidney, and spleen. Each bar represents the mean ± SEM of six observations (one-way ANOVA followed by Tukey’s post hoc test). NC = normal control; DC = disease control, T1–T4 = probiotics, T5–T7 = prebiotics; T8 = synbiotic. [Click here to view] |
 | Table 1. Effect of treatments on serum biochemical parameters. [Click here to view] |
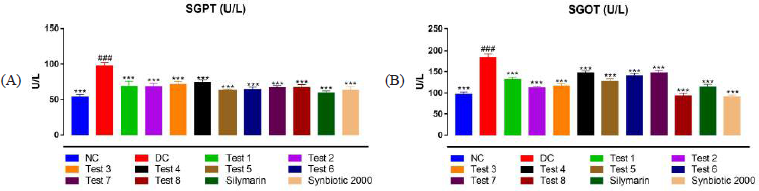 | Figure 3. Effect of treatments on levels of SGPT and SGOT. Each bar represents the mean ± SEM of six observations. (A) SGPT levels in serum and (B) SGOT levels in serum. #p < 0.001 versus NC group; ***p < 0.001 versus DC group (one-way ANOVA followed by Tukey’s post hoc test). NC = normal control; DC = disease control; T1–T4 = probiotics; T5–T7 = prebiotics; T8 = synbiotic. [Click here to view] |
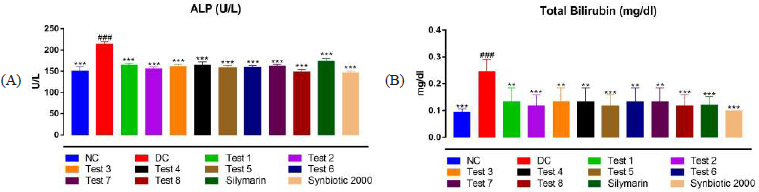 | Figure 4. Effect of treatments on levels of ALP and total bilirubin. Each bar represents the mean ± SEM of six observations. (A) SGPT levels in serum and (B) SGOT levels in serum. #p < 0.001 versus NC group; **p < 0.01 versus DC group; ***p < 0.001 versus DC group (one-way ANOVA followed by Tukey’s post hoc test). NC = normal control; DC = disease control; T1–T4 = probiotics; T5–T7 = prebiotics; T8 = synbiotic. [Click here to view] |
Effect of treatments on levels of lactate dehydrogenase
Lactate dehydrogenase (LDH) levels were significantly elevated in the DC group compared to the NC group (p < 0.001), whereas in all test groups, the lactate dehydrogenase levels were significantly decreased in comparison with the DC group (p < 0.001) (Table 1 and Fig. 6A).
Effect of treatments on levels of urea
Levels of urea were elevated significantly in DC (p < 0.001) as compared to NC. Test 1 (p < 0.01), Test 3 (p < 0.01), Test 5 (p < 0.001), Test 8 (p < 0.001), Silymarin (p < 0.05), and Synbiotic 2000 (p < 0.001) have shown a statistically significant decrease in the urea levels as compared to DC (Table 1 and Fig. 6B).
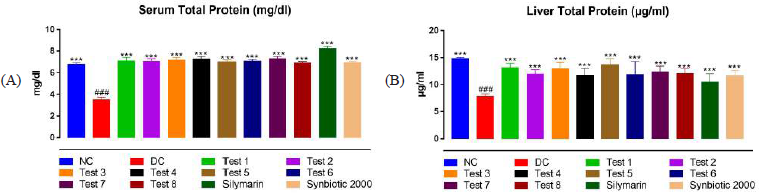 | Figure 5. Effect of treatments on levels of serum and liver total protein. Each bar represents the mean ± SEM of six observations. (A) SGPT levels in serum and (B) SGOT levels in serum. #p < 0.001 versus NC group; ***p < 0.001 versus DC group (one-way ANOVA followed by Tukey’s post hoc test). NC = normal control; DC = disease control; T1–T4 = probiotics; T5–T7 = prebiotics; T8 = synbiotic. [Click here to view] |
 | Figure 6. Effect of treatments on levels of lactate dehydrogenase and urea. Each bar represents the mean ± SEM of six observations. (A) SGPT levels in serum and (B) SGOT levels in serum. #p < 0.001 versus NC group; *p < 0.05 versus DC group; **p < 0.01 versus DC group; ***p < 0.001 versus DC group (one-way ANOVA followed by Tukey’s post hoc test). NC = normal control; DC = disease control; T1–T4 = probiotics; T5–T7 = prebiotics; T8 = synbiotic. [Click here to view] |
Effect of treatments on levels of CAT
The CAT levels were significantly decreased in the DC group as compared to the NC (p < 0.001). In test groups, there was significant increase in CAT as compared to DC groups (Test 1, p < 0.01; Test 2, p < 0.01; Test 3, p < 0.001; Test 4, p < 0.001; Test 5, p < 0.001; Test 6, p < 0.001; Test 7, p < 0.05; Test 8, p < 0.001; silymarin, p < 0.01, and Synbiotic 2000, p < 0.001) (Fig. 7A).
Effect of treatments on levels of GSH
The GSH levels were significantly reduced in the DC group in comparison with NC (p < 0.05). In test groups, there was a significant elevation in GSH as compared to DC groups in Test 1 (p < 0.05), Test 2 (p < 0.05), Test 3 (p < 0.05), Test 4 (p < 0.001), Test 5 (p < 0.001), Test 7 (p < 0.001), Test 8 (p < 0.01), Silymarin (p < 0.01), and Synbiotic 2000 (p < 0.001) (Fig. 7B).
Effect of treatments on levels of LPO
The LPO levels were significantly increased in the DC group as compared to the NC (p < 0.001). In test groups, there was a significant reduction in LPO as compared to DC groups in Test 1 (p < 0.001), Test 2 (p < 0.001), Test 3 (p < 0.001), Test 4 (p < 0.001), Test 5 (p < 0.001), Test 7 (p < 0.001), Test 8 (p < 0.05), Silymarin (p < 0.001), and Synbiotic 2000 (p < 0.001) (Fig. 8).
Effect of treatment on histopathology of liver
Liver histopathology of NC group rats showed normal liver parenchyma comprised of hepatocytes arranged in a cord-like pattern. Hepatocytes were in normal and uniform shape and size with normal morphology of the nucleus and cytoplasm. There was absenteeism of any inflammatory changes throughout the section. After the administration of CCl4 in rats, it was observed that there were moderate-to-severe pathological changes in hepatic tissue hepatocytes which showed degeneration and necrosis with cellular swelling and enlarged nucleus. Hepatic degeneration was with granular and vacuolar cytoplasmic changes and derangement of hepatic cords. All test treatment groups showed minimal pathological changes in hepatocytes. The focal basophilic areas of hepatocytes showed regeneration of histomorphological features of hepatic tissue. Hepatocytes showed focal areas of centrilobular degeneration with cellular swelling and enlarged nucleus (Fig. 9).
Effect of treatment on histopathology of kidney
Histopathology of kidney of normal rats showed intact renal parenchyma with renal tubules and glomeruli. The vascular tissue in the renal interstitial space, cortex, and medullar area was normal. The inflammatory or metabolic changes were absent throughout the section. After administration of CCl4, there were histopathological changes observed in renal tissues. Renal tubules showed the areas of degeneration and necrosis. Along with that cellular swelling and enlarged nucleus and formation of eosinophilic mass in tubular lumen was observed. The section showed focal areas of interstitial hemorrhages. All the treatment groups showed minimal histopathological changes in renal tissue, i.e. cortex and medulla. The mild degeneration of renal tubules in focal areas was observed. The focal areas of interstitial hemorrhages were observed (Fig. 10).
 | Figure 7. Effect of treatments on levels of CAT and GSH. Each bar represents the mean ± SEM of six observations. (A) SGPT levels in serum and (B) SGOT levels in serum. #p < 0.001 versus NC group; *p < 0.05 versus DC group; **p < 0.01 versus DC group; ***p < 0.001 versus DC group (one-way ANOVA followed by Tukey’s post hoc test). NC = normal control; DC = disease control; T1–T4 = probiotics; T5–T7 = prebiotics; T8 = synbiotic. [Click here to view] |
 | Figure 8. Effect of treatments on levels of LPO. Each bar represents the mean ± SEM of six observations. (A) SGPT levels in serum and (B) SGOT levels in serum. #p < 0.001 versus NC group; *p < 0.05 versus DC group; ***p < 0.001 versus DC group (one-way ANOVA followed by Tukey’s post hoc test). NC = normal control; DC = disease control; T1–T4 = probiotics; T5–T7 = prebiotics; T8 = synbiotic. [Click here to view] |
Effect of treatment on histopathology of intestine
Histopathology of intestine of normal rats showed normal histology of intestine with normal mucosa and submucosa. The mucosal epithelial tissue was intact and comprised of enterocytes and villi arrangement. The section was absent of any inflammatory and metabolic changes. The histopathology of DC rat showed severe pathological and metabolic changes in mucosa and submucosa in all the sections. There were diffused areas of degeneration and necrosis with the loss of enterocytes. The section was having multifocal areas of necrosis and degeneration with disarranged villi. The focal infiltration of inflammatory cells in mucosa and submucosa was observed.
All the treatment groups showed minimal histology changes of intestinal mucosa with occasional areas of degeneration of villi and necrosis with loss of villi. Hydropic changes of villi with increased goblet activity were observed minimally (Fig. 11).
Intestinal microflora identification by RTPCR
The highest number of amplicon sequence reads were obtained from the animal treated with inulin (1,25,833 amplicon reads), followed by animals treated with Lactobacillus acidophilus (1,04,069 amplicon reads). The least number of reads was obtained from the NC group which was not treated with any probiotic or prebiotic (5,783 amplicon reads). Taxonomic analysis of the V3 16S rRNA gene amplicon reads yielded a total of twelve major classifiable genera, two of which were dominant in the entire sample, namely, Enterococcus (1.81%–89.16%) and Staphylococcus (1.68–94.03). In the case of DC, the intestinal mucus harbored almost 94% of Staphylococcus, which was reduced to merely 4.6% by administration of Lactococcus lactis. This could be explained by the effective competitive displacement of Staphylococcus cells by Lactobacillus cells. The administration of prebiotic and FOSs also resulted in controlling the growth of Staphylococcus. Alpha diversities were calculated based on the formula suggested by Jost (2006), for Shannon diversity (Fig. 12).
DISCUSSION
This study was planned and conducted to evaluate the hepatoprotective activity of probiotics, prebiotics, and synbiotic isolated and identified at our lab. CCl4-induced acute liver injury in the rat is a widely used animal model to evaluate the hepatoprotective effect (Neubauer et al., 1998; Park et al., 2015). In the present study, we have evaluated the efficacy of probiotics Lactococcus lactis, Pediococcus pentosaceus, Lactobacillus acidophilus, and Lactobacillus plantarum (the first two were isolated from curd and fermented wheat, resp.) and prebiotics such as inulin, FOS, and lactulose alone as well as the synbiotic, that is, association of all above.
SGOT and SGPT are the hepatic metabolic enzymes that are released in the serum during the hepatic damage. These enzymes are considered to reflect the hepatic damage after the administration of hepatotoxic agents. It is widely accepted that CCl4 gets accumulated into hepatic parenchyma cells where it gets converted into CCl3 radical through cytochrome P450-dependent monooxygenase. This CCl3 radical attacks polyunsaturated fatty acids and produces lipid peroxides which ultimately leads to alteration of hepatic enzyme levels such as SGPT, SGOT, ALP, LDH, and total bilirubin (Bishayee et al., 1995; Braide, 1991; Dwivedi et al., 1991; Taïeb et al., 2005; Yadav et al., 2008). These enzyme markers are leaked from hepatocytes due to disturbance in transport function which is a result of hepatic injury and altered membrane permeability (Paul et al., 2018; Zimmerman, 1970).
 | Figure 9. Effect of treatment on histopathology (liver). Each image is histopathology of the liver of an animal from the respective group. (A) NC, (B) DC, (C) T1, (D) T2, (E) T3, (F) T4, (G) T5, (H) T6, (I) T7; (J) T8, (K) Silymarin, (L) Synbiotic 2000. NC = normal control; DC = disease control; T1– T4 = probiotics; T5–T7 = prebiotics; T8 = synbiotic. [Click here to view] |
 | Figure 10. Effect of treatment on histopathology (kidney). Each image is histopathology of the kidney of an animal from the respective group. (A) NC, (B) DC, (C) T1, (D) T2, (E) T3, (F) T4, (G) T5, (H) T6, (I) T7; (J) T8, (K) Silymarin, (L) Synbiotic 2000. NC = normal control; DC = disease control; T1–T4 = probiotics; T5–T7 = prebiotics; T8 = synbiotic. [Click here to view] |
In agreement with this, we have observed similar results in our study that, after the administration of CCl4 intraperitoneally, level of hepatic enzymes was elevated. This increase in levels of hepatic enzymes was prevented with the treatment of all the strains of probiotics used in this study, that is, Lactococcus lactis, Pediococcus pentosaceus, Lactobacillus acidophilus, and Lactobacillus plantarum. The same phenomenon was observed in prebiotics, inulin, FOS, and lactulose and also in the synbiotic (the combination of all four probiotics and three prebiotics). This indicates that these treatments are helpful in the prevention of changes in hepatic enzyme levels and the protection of the liver. Also, administration of these probiotics in the experimental animals did not showed any adverse events during the study. The preliminary experiments carried for toxicity have not showed any signs of toxicity.
 | Figure 11. Effect of treatment on histopathology (intestine). Each image is histopathology of the intestine of an animal from the respective group. (A) NC, (B) DC, (C) T1, (D) T2, (E) T3, (F) T4, (G) T5, (H) T6, (I) T7; (J) T8, (K) Silymarin, (L) Synbiotic 2000. NC = normal control; DC = disease control; T1–T4 = probiotics; T5–T7 = prebiotics; T8 = synbiotic. [Click here to view] |
As mentioned above, CCl3 radical generation alkylates hepatic cellular proteins and other macromolecules and contributes to the production of lipid peroxides through damaging polyunsaturated fatty acids and therefore causing hepatocellular necrosis (Bishayee et al., 1995; Brattin et al., 1985; Kouam et al., 2020; Taïeb et al., 2005). Also, the overproduction of reactive oxygen species causes necrosis of hepatocyte through damage to DNA, proteins, lipids, and carbohydrates (Ahmad et al., 2009). Increased levels of liver LPO are indicative of hepatic damage and unmanaged antioxidant defense mechanism against the generated free radicals (Silveira et al., 2016). Thus, inhibition of free radical generation or increasing the levels of cellular antioxidants plays an important role in hepatoprotection against CCl4-induced liver toxicity. In the present work, we have observed similar results; namely, administration of CCl4 caused increased levels of LPO and depleted levels of cellular antioxidants like CAT and GSH indicating increased oxidative stress at the cellular level and therefore hepatic necrosis pointing towards the induction of disease, that is, hepatotoxicity. The levels of cellular antioxidants were preserved due to the preadministration of probiotics, prebiotics, and synbiotics. Also, the levels of LPO were not much elevated in the preventive treatment indicating the management of free radicals. Thus, pretreatment with probiotics, prebiotics, and synbiotics is helpful in the management of oxidative stress produced due to free radical generation after induction of CCl4induced hepatotoxicity.
Previously, Lactobacillus Plantarum isolated from Chinese yogurt has shown the upregulated expressions of SOD, GSH, and CAT and prevented the d-galactose induced oxidative aging. In agreement with this, Lactobacillus plantarum, Lactococcus lactis, Pediococcus pentosaceus, and Lactobacillus acidophilus have also shown upregulated levels of GSH and CAT with downregulated levels of LPO. This indicates that the administration of these probiotics and prebiotics as well as the symbiotic association of both prevents the oxidative stress caused by free radicals produced after CCl4 administration and therefore prevents hepatic injury.
Also, in a similar context, it was demonstrated that probiotic (Lactobacillus, Bifidobacterium, Clostridium, and Saccharomyces species) administration improved the symptoms of CCl4-induced hepatic injury through the change in gut microbiota (Li et al., 2015; Liu et al., 2017). Our studies are in agreement with the above studies. Administration of probiotics and prebiotics causes displacement of Staphylococcus cells by Lactobacillus cells which was indicated through taxonomic analysis of the V3 16S rRNA gene amplicon reads.
Due to the failure of the gastric acid barrier, the gram-positive bacterial flora which mainly includes Streptococcus spp., Staphylococcus spp., Micrococcus spp., Lactobacillus spp., Neisseria spp., Veillonella spp., Streptococcus spp., Gemella spp., Corynebacterium spp., and Actinomyces spp. increases in the gastrointestinal tract. Along with this, the concentration of colonic flora (Enterobacteriaceae, Enterococcus, Pseudomonas, and Bacteroides) also increases due to lower small intestinal motility (Bauer et al., 2001). Furthermore, Bauer et al. (2002) demonstrated that the decreased small intestinal bacterial overgrowth and associated systemic endotoxemia are most common in liver cirrhosis. In a similar line, we have observed that Staphylococcus, one of the major parts of colonic flora responsible for endotoxemia, has been reduced and replaced by Lactobacillus and therefore helpful in attenuation of liver damage triggered due to CCl4.
 | Figure 12. Identification of intestinal microflora by RTPCR. [Click here to view] |
CONCLUSION
Our results suggest that the use of Lactococcus lactis subspecies cremoris, Pediococcus pentosaceus, Lactobacillus acidophilus, and Lactobacillus plantarum and prebiotics inulin, FOS, lactulose, and test synbiotic has a protective effect against CCl4-induced hepatotoxicity in rats. The hepatoprotective activity is demonstrated through the management of levels of hepatic enzymes, total bilirubin, urea, and total protein levels. This hepatoprotection may be due to the administration of all organisms that caused the prevention of hepatic damage that occurred due to increased oxidative stress in hepatic cells after CCl4 administration in rats as well as replacement of Staphylococcus by Lactobacillus.
As there were no adverse effects observed and no decrease in body weights and organ weights, blood chemistry parameters, oxidative stress parameters, and histologically showed improvement in the toxicity or damage induced by CCl4 when compared with the DC group. All observations have shown a protective effect after administration of test substance for 28 days. It can also be concluded that the prebiotics, probiotics, and synbiotics are safe for use.
The data of the study will aid in formulating the better and effective combination of prebiotics with probiotic organisms having maximum hepatoprotective activity.
ACKNOWLEDGEMENTS
This research was supported by the APT Research Foundation, Pune, India. The authors wish to thank the research team involved in the project for their contribution. The authors are thankful to Professor Stig Bengmark, Lund University, Sweden, for providing standard Synbiotic 2000.
AUTHOR CONTRIBUTIONS
All authors made substantial contributions to conception and design, acquisition of data, or analysis and interpretation of data; took part in drafting the article or revising it critically for important intellectual content; agreed to submit to the current journal; gave final approval of the version to be published; and agree to be accountable for all aspects of the work. All the authors are eligible to be an author as per the international committee of medical journal editors (ICMJE) requirements/guidelines.
CONFLICTS OF INTEREST
The authors report no financial or any other conflicts of interest in this work.
ETHICAL APPROVALS
This study protocol was approved by the Institutional Animal Ethical Committee through research project numberRP10/1415 and conducted according to the guidelines of The Committee for the Purpose of Control and Supervision of Experiments on Animals (Ministry of Environment and Forests, Government of India).
PUBLISHER’S NOTE
This journal remains neutral with regard to jurisdictional claims in published institutional affiliation.
FUNDING
This research did not receive any specific grant from funding agencies in the public, commercial, or not-for-profit sectors.
REFERENCES
Aebi H. Catalase in vitro. Methods Enzymol, 1984; 105:121–6. CrossRef
Ahmad P, Jaeel CA, Azooz MM, Nabi G. Generation of ROS and non-enzymatic antioxidants during abiotic stress in plants. Bot Res Int, 2009; 2(1):11–20.
Ashoush IS, El-Batawy OI, El-Shourbagy GA. Antioxidant activity and hepatoprotective effect of pomegranate peel and whey powders in rats. Ann Agric Sci, 2013; 58(1):27–32. CrossRef
Asrani SK, Devarbhavi H, Eaton J, Kamath PS. Burden of liver diseases in the world. J Hepatol, 2019; 70(1):151–71. CrossRef
Bang CS, Hong SH, Suk KT, Kim JB, Han SH, Sung H, Kim EJ, Kim MJ, Kim MY, Baik SK, Kim DJ. Effects of Korean Red Ginseng (Panax ginseng), urushiol (Rhus vernicifera Stokes), and probiotics (Lactobacillus rhamnosus R0011 and Lactobacillus acidophilus R0052) on the gut-liver axis of alcoholic liver disease. J Ginseng Res, 2014; 38(3):167–72. CrossRef
Bauer TM, Schwacha H, Steinbrückner B, Brinkmann FE, Ditzen AK, Aponte JJ, Pelz K, Berger D, Kist M, Blum HE. Small intestinal bacterial overgrowth in human cirrhosis is associated with systemic endotoxemia. Am J Gastroenterol, 2002; 97(9):2364–70. CrossRef
Bauer TM, Steinbrückner B, Brinkmann FE, Ditzen AK, Schwacha H, Aponte JJ, Pelz K, Kist M, Blum HE. Small intestinal bacterial overgrowth in patients with cirrhosis: prevalence and relation with spontaneous bacterial peritonitis. Am J Gastroenterol, 2001; 96(10):2962–7. CrossRef
Bishayee A, Sarkar A, Chatterjee M. Hepatoprotective activity of carrot (Daucus carota L.) against carbon tetrachloride intoxication in mouse liver. J Ethnopharmacol, 1995; 47(2):69–74. CrossRef
Braide VB. Antihepatotoxic biochemical effects of kolaviron, a biflavonoid ofGarcinia kola seeds. Phytother Res, 1991; 5(1):35–7. CrossRef
Brattin WJ, Glende EA, Recknagel RO. Pathological mechanisms in carbon tetrachloride hepatotoxicity. J Free Radic Biol Med, 1985; 1(1):27–38. CrossRef
Cesaro C, Tiso A, Del Prete A, Cariello R, Tuccillo C, Cotticelli G, Del Vecchio Blanco C, Loguercio C. Gut microbiota and probiotics in chronic liver diseases. Dig Liver Dis, 2011; 43(6):431–8. CrossRef
Dwivedi Y, Rastogi R, Garg NK, Dhawan BN. Prevention of paracetamol-induced hepatic damage in rats by picroliv, the standardized active fraction fromPicrorhiza kurroa. Phytother Res, 1991; 5(3):115–9. CrossRef
Eidi A, Mortazavi P, Tehrani ME, Rohani AH, Safi S. Hepatoprotective effects of pantothenic acid on carbon tetrachloride-induced toxicity in rats. EXCLI J, 2012; 11:748–59.
Ellman GL. Tissue sulfhydryl groups. Arch Biochem Biophys, 1959; 82(1):70–7.
Gibson GR, Roberfroid MB. Dietary modulation of the human colonic microbiota: introducing the concept of prebiotics. J Nutr, 1995; 125(6):1401–12. CrossRef
Hernández-Muñoz R, Díaz-Muñoz M, Suárez J, Chagoya de Sánchez V. Adenosine partially prevents cirrhosis induced by carbon tetrachloride in rats. Hepatology, 1990; 12(2):242–8. CrossRef
Jiao J, Friedman SL, Aloman C. Hepatic fibrosis. Curr Opin Gastroenterol, 2009;25(3):223–9. CrossRef
Jost L. Entropy and diversity. Oikos, 2006; 113(2):363–75. CrossRef
Kirpich IA, Solovieva NV, Leikhter SN, Shidakova NA, Lebedeva OV, Sidorov PI, Bazhukova TA, Soloviev AG, Barve SS, McClain CJ, Cave M. Probiotics restore bowel flora and improve liver enzymes in human alcohol-induced liver injury: a pilot study. Alcohol, 2008; 42(8):675–82. CrossRef
Kouam AF, Owona BA, Fifen R, Njayou FN, Moundipa PF. Inhibition of CYP2E1 and activation of Nrf2 signaling pathways by a fraction from Entada africana alleviate carbon tetrachloride-induced hepatotoxicity. Heliyon, 2020; 6(8):e04602. CrossRef
Li M, Zhu L, Xie A, Yuan J. Oral administration of Saccharomyces boulardii ameliorates carbon tetrachloride-induced liver fibrosis in rats via reducing intestinal permeability and modulating gut microbial composition. Inflammation, 2015; 38(1):170–9. CrossRef
Liu J, Fu Y, Zhang H, Wang J, Zhu J, Wang Y, Guo Y, Wang G, Xu T, Chu M, Wang F. The hepatoprotective effect of the probiotic clostridium butyricum against carbon tetrachloride-induced acute liver damage in mice. Food Funct, 2017; 8(11):4042–52. CrossRef
Liu J, Lu J, Wen X, Kan J, Jin C. Antioxidant and protective effect of inulin and catechin grafted inulin against CCl4-induced liver injury. Int J Biol Macromol, 2015; 72:1479–84. CrossRef
Loguercio C, Federico A, Tuccillo C, Terracciano F, D’Auria MV, De Simone C, Del Vecchio Blanco C. Beneficial effects of a probiotic VSL#3 on parameters of liver dysfunction in chronic liver diseases. J Clin Gastroenterol, 2005; 39(6):540–3. CrossRef
Lowry OH, Rosebrough NJ, Farr AL, Randall RJ. Protein measurement with the folin phenol reagent. J Biol Chem, 1951; 193(1):265–75. CrossRef
Lu E, Yeung M, Yeung CK. Comparative analysis of lactulose and fructooligosaccharide on growth kinetics, fermentation, and antioxidant activity of common probiotics. Food Nutr Sci, 2018; 09(03):161–78. CrossRef
Moron MS, Depierre JW, Mannervik B. Levels of glutathione, glutathione reductase and glutathione S-transferase activities in rat lung and liver. Biochim Biophys Acta, 1979; 582(1):67–78. CrossRef
Neubauer K, Eichhorst ST, Wilfling T, Buchenau M, Xia L, Ramadori G. Sinusoidal intercellular adhesion molecule-1 up-regulation precedes the accumulation of leukocyte function antigen-1-positive cells and tissue necrosis in a model of carbontetrachloride-induced acute rat liver injury. Lab Invest, 1998; 78(2):185–94.
Nieto N, Friedman SL, Greenwel P, Cederbaum AI. CYP2E1mediated oxidative stress induces collagen type I expression in rat hepatic stellate cells. Hepatology, 1999; 30(4):987–96. CrossRef
Ohkawa H, Ohishi N, Yagi K. Assay for lipid peroxides in animal tissues by thiobarbituric acid reaction. Anal Biochem, 1979; 95(2):351–8. CrossRef
Parasuraman S, Raveendran R, Kesavan R. Blood sample collection in small laboratory animals. J Pharmacol Pharmacother, 2010; 1(2):87. CrossRef
Park JE, Lee DK, Kim KT, Seo JG, Chung MJ, Ha NJ, Park JB, Kim K. Hepatoprotective effects of dual-coated and uncoated mixture of probiotics in rats. Biotechnol Biotechnol Equip, 2015; 29(6):1164–8. CrossRef
Paul J, Venugopal RV, Peter L, Hussain S, Naresh Kumar Shetty K, Shetti MP. Effects of lifestyle modification on liver enzyme and Fibroscan in Indian patients with non-alcoholic fatty liver disease. Gastroenterol Rep, 2018; 6(1):49–53. CrossRef
Poli G. Pathogenesis of liver fibrosis: role of oxidative stress. Mol Aspects Med, 2000; 21(3):49–98. CrossRef
Ragavan B, Krishnakumari S. Effect of T. arjuna stem bark extract on histopathology of liver, kidney and pancreas of alloxan-induced diabetic rats. Afr J Biomed Res, 2009; 9(3):189–97. CrossRef
Reeves HL, Friedman SL. Activation of hepatic stellate cells--a key issue in liver fibrosis. Front Biosci, 2002; 7:d808–26. CrossRef
Rishi P, Mavi SK, Bharrhan S, Shukla G, Tewari R. Protective efficacy of probiotic alone or in conjunction with a prebiotic in salmonella-induced liver damage. FEMS Microbiol Ecol, 2009; 69(2):222–30. CrossRef
Silveira PCL, Ferreira KB, da Rocha FR, Pieri BLS, Pedroso GS, De Souza CT, Nesi RT, Pinho RA. Effect of low-power laser (LPL) and light-emitting diode (LED) on inflammatory response in burn wound healing. Inflammation, 2016; 39(4):1395–404. CrossRef
Sun B, Karin M. NF-κB signaling, liver disease and hepatoprotective agents. Oncogene, 2008; 27:6228. CrossRef
Taïeb D, Malicet C, Garcia S, Rocchi P, Arnaud C, Dagorn JC, Iovanna JL, Vasseur S. Inactivation of stress protein p8 increases murine carbon tetrachloride hepatotoxicity via preserved CYP2E1 activity. Hepatology, 2005;42(1):176–82. CrossRef
Wang Y, Kirpich I, Liu Y, Ma Z, Barve S, McClain CJ, Feng W. Lactobacillus rhamnosus GG treatment potentiates intestinal hypoxiainducible factor, promotes intestinal integrity and ameliorates alcohol-induced liver injury. Am J Pathol, 2011; 179(6):2866–75. CrossRef
Yadav NP, Pal A, Shanker K, Bawankule DU, Gupta AK, Darokar MP, SPS Khanuja. Synergistic effect of silymarin and standardized extract of Phyllanthus amarus against CCl4-induced hepatotoxicity in Rattus norvegicus. Phytomedicine, 2008; 15(12):1053–61. CrossRef
Zimmerman HJ. Enzymes in hepatic disease. Diagn Enzymol, 1970; 6(1):24–6.